Fundamental and Technical Weakness Raised Concerns - Monday, January 07, 2013
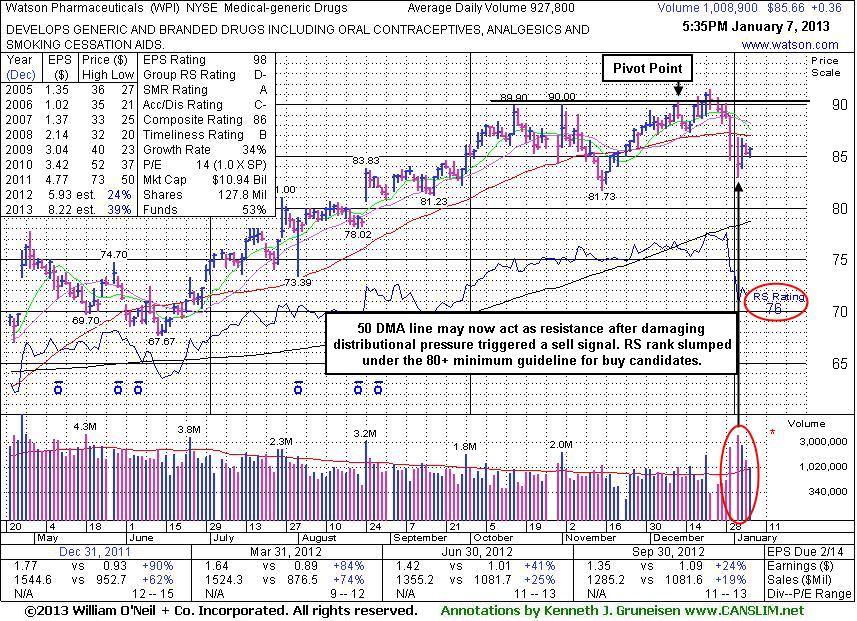
Watson Pharmaceuticals (WPI +$0.36 or +0.42% to $85.66) halted its slide after damaging distributional losses triggered a technical sell signal last week. Its 50-day moving average (DMA) line may now act as resistance. Its Relative Strength rating has slumped to a 76, below the 80+ minimum guideline for buy candidates. Based on recent deterioration in its fundamental and technical characteristics it will be dropped from the Featured Stocks list tonight. Disciplined investors might sooner choose a buy candidate without fundamental concerns, watching for a chance to accumulate shares whenever a high-ranked leader rallies above its pivot point with above average volume.
WPI was last shown in this FSU section on 12/17/12 with an annotated daily graph under the headline, "Perched Near High With No Overhead Supply". It stalled after a volume-driven gain above its pivot point on 12/21/12 triggered a new (or add-on) technical buy signal by clearing the pivot point cited based on its 12/12/12 high plus 10 cents. Disciplined investors always limit losses by selling if ever any stock falls moire than -7% from the purchase price.
As previously noted, quarterly comparisons for sales revenues and earnings increases have shown sequential deceleration in its growth rate raising some fundamental concerns. It recently reported earnings +24% on +19% sales revenues for the Sep '12 quarter, one notch below the +25% minimum guideline (C criteria), raising some concerns. The number of top-rated funds owning its shares rose from 1,011 in Mar '12 to 1,120 in Dec '12, a reassuring sign concerning the I criteria. It has maintained a strong annual earnings (A criteria) history.
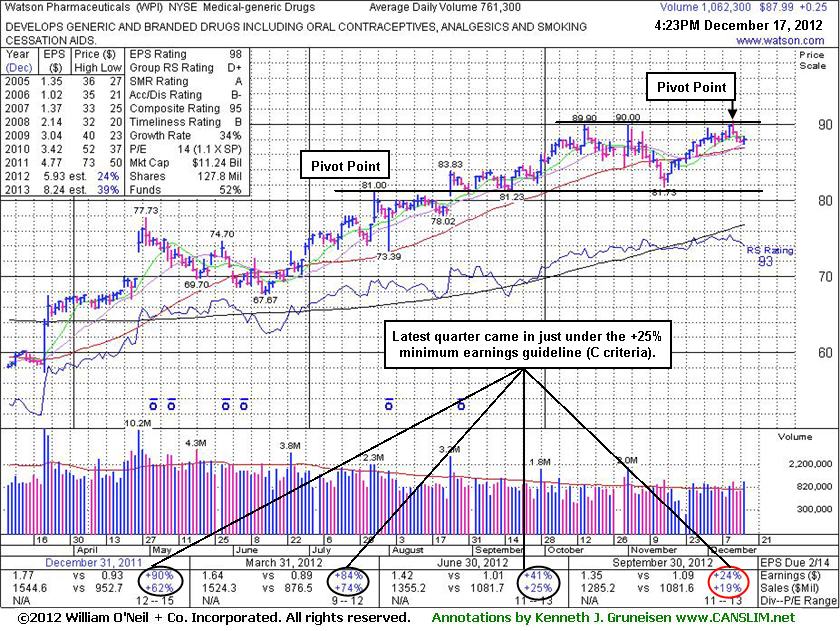
Perched Near High With No Overhead Supply - Monday, December 17, 2012
Watson Pharmaceuticals (WPI +$0.25 or +0.28% to $87.99) recently stalled after touching a new 52-week high, and yet no resistance remains due to overhead supply. Its color code was changed to yellow with new pivot point cited based on its 12/12/12 high plus 10 cents. It has formed an orderly base-on-base type pattern. Subsequent volume-driven gains above its pivot point may trigger a new (or add-on) technical buy signal.
As previously noted, quarterly comparisons for sales revenues and earnings increases have shown sequential deceleration in its growth rate raising some fundamental concerns. It recently reported earnings +24% on +19% sales revenues for the Sep '12 quarter, one notch below the +25% minimum guideline (C criteria). It has been resilient since last shown in this FSU section on 11/23/12 with an annotated graph under the headline, "Resilient Despite Noted Deceleration in Sales and Earnings Growth", as it rebounded above its 50-day moving average (DMA) line. The number of top-rated funds owning its shares rose from 1,011 in Mar '12 to 1,116 in Sep '12, a reassuring sign concerning the I criteria. It has maintained a strong annual earnings (A criteria) history.
Resilient Despite Noted Deceleration in Sales and Earnings Growth - Friday, November 23, 2012
Watson Pharmaceuticals (WPI +$0.82 or +0.96% to $86.08) wedged above its 50-day moving average (DMA) line with today's gain backed by light volume. It recently reported earnings +24% on +19% sales revenues for the Sep '12 quarter, a notch below the +25% minimum guideline (C criteria). Deceleration in its sales and earnings growth rate has raised some fundamental concerns.The number of top-rated funds owning its shares rose from 1,011 in Mar '12 to 1,100 in Sep '12, a reassuring sign concerning the I criteria. It has maintained a strong annual earnings (A criteria) history. It has been fairly resilient since
last shown in this FSU section on 11/01/12 with an annotated graph under the headline, "Found Support at 50-Day Average; Earnings Deceleration Evident".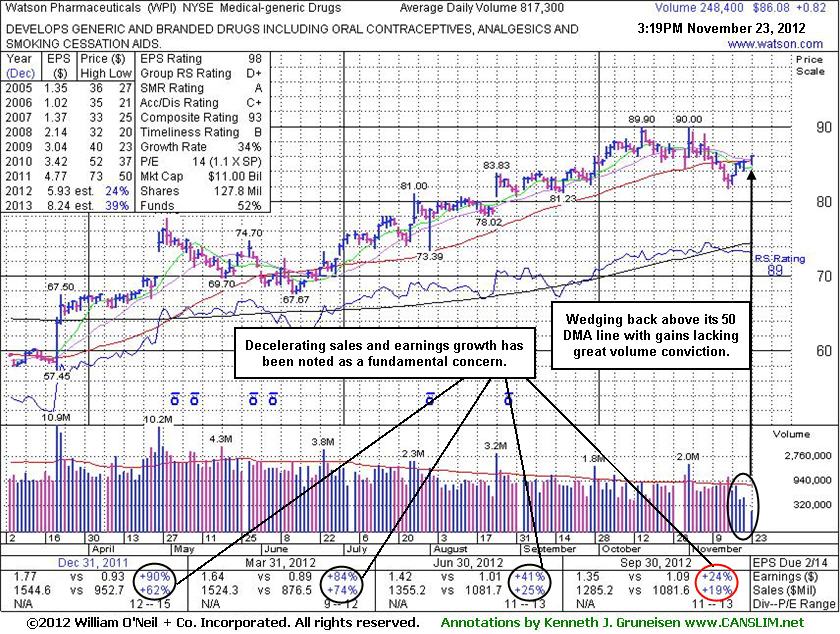
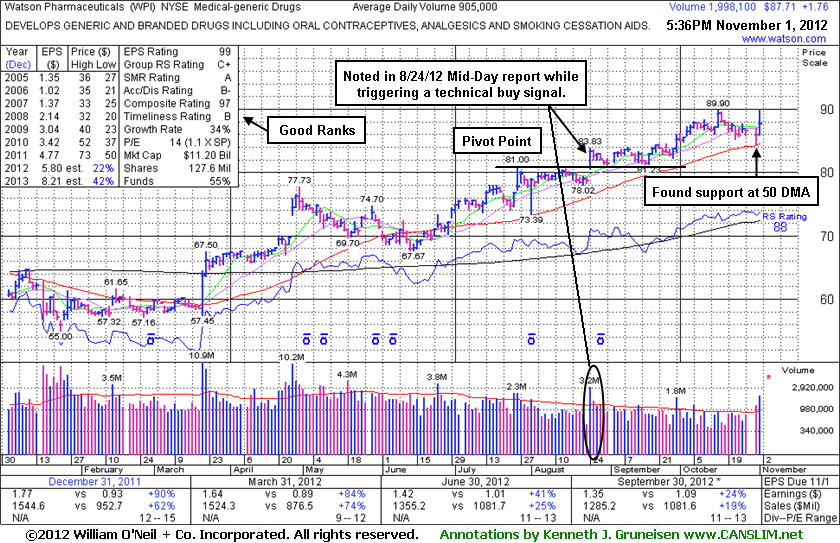
Found Support at 50-Day Average; Earnings Deceleration Evident - Thursday, November 01, 2012
Watson Pharmaceuticals (WPI +$1.76 or +2.05% to $87.71) touched a new 52-week high today, rallying with above average volume after testing support at its 50-day moving average (DMA) line. It has not formed a sound base and it is extended from a proper buy point under the fact-based system's guidelines. It was last shown in this FSU section on 9/28/12 with an annotated graph under the headline, "Volume-Driven Gain Into New 52-Week High Territory", as its gain backed by +71% above average volume lifted it above the "max buy" level. Disciplined investors know to avoid chasing stocks after they get extended from a prior base. Prior highs in the $81 area acted as support during its consolidation before it continued higher. The number of top-rated funds owning its shares rose from 1,011 in Mar '12 to 1,081 in Sep '12, a reassuring sign concerning the I criteria.It reported earnings +24% on +19% sales revenues for the Sep '12 quarter, a hair below the +25% minimum earnings (C criteria) guideline. That continued the streak of sequential comparisons showing recent deceleration in sales and earning growth rate, which has been noted as a small concern. Earlier, its 8/24/12 gap up and solid gain above its pivot point backed by +143% above average volume triggered a technical buy signal. The considerable gain with above average volume followed news that its generic Lidoderm(R) received FDA approval, an encouraging development concerning the N criteria The 5/09/12 mid-day report had previously noted - "Its improved fundamentals make it a worthy candidate for investors' watchlists. Sales revenues showed impressive acceleration while the 3 latest quarterly comparisons through Mar '12 showed earnings increases above the +25% guideline satisfying the C criteria. It also has maintained a strong annual earnings (A criteria) history."
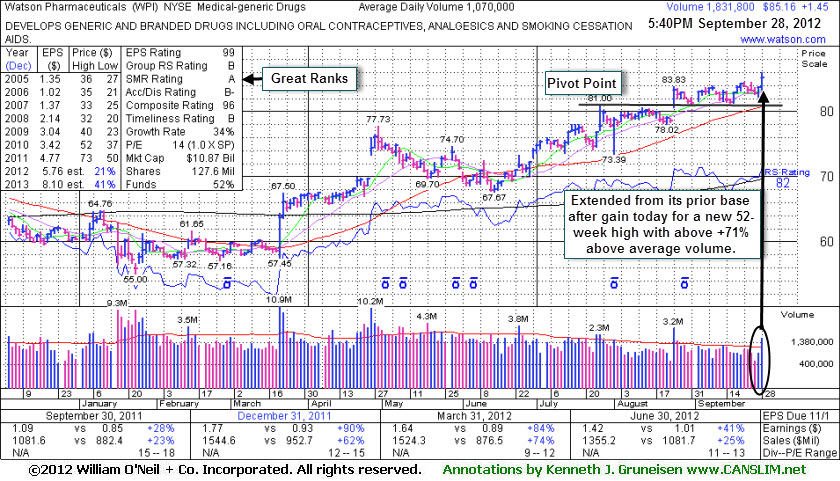
Volume-Driven Gain Into New 52-Week High Territory - Friday, September 28, 2012
Watson Pharmaceuticals (WPI +$1.45 or +1.73% to $85.16) hit a new 52-week high with today's gain backed by +71% above average volume lifting it above the "max buy" level. Its color code was changed to green after getting extended from its prior base. Disciplined investors always avoid chasing extended stocks. Prior highs in the $81 area and its 50-day moving average (DMA) line define important support to watch on pullbacks.
It was last shown in this FSU section on 8/28/12 with an annotated graph under the headline, "Holding Ground Following Recent News Driven Gap Up". It was then holding its ground after its 8/24/12 gap up and solid gain above its pivot point backed by +143% above average volume triggered a technical buy signal. The considerable gain with above average volume followed news that its generic Lidoderm(R) received FDA approval, an encouraging development concerning the N criteria.
It reported earnings +41% on +25% sales revenues for the Jun '12 quarter. However, the sequential comparisons show recent deceleration in sales and earning growth rate, which has been noted as a small concern. The 5/09/12 mid-day report had previously noted - "Its improved fundamentals make it a worthy candidate for investors' watchlists. Sales revenues showed impressive acceleration while the 3 latest quarterly comparisons through Mar '12 showed earnings increases above the +25% guideline satisfying the C criteria. It also has maintained a strong annual earnings (A criteria) history." The number of top-rated funds owning its shares rose from 1,011 in Mar '12 to 1,051 in Jun '12, a reassuring sign concerning the I criteria.
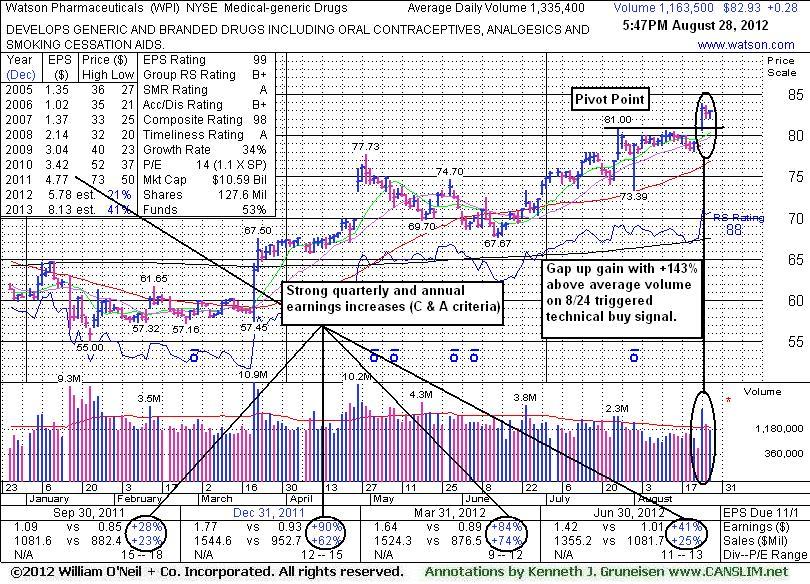
Holding Ground Following Recent News Driven Gap Up - Tuesday, August 28, 2012
Often, when a leading stock is breaking of a solid base it is highlighted in CANSLIM.net's Mid-Day Breakouts Report. The most relevant factors are noted in the report which alerts prudent CANSLIM oriented investors. After doing any necessary backup research, the investor is prepared to act after the stock triggers a technical buy signal (breaks above its pivot point on more than +50% average turnover) but before it gets too extended from a sound base. Disciplined investors know to buy as near as possible to the pivot point and avoid chasing stocks after they have rallied more than +5% above their pivot point. It is crucial to always limit losses whenever any stock heads the wrong direction, and disciplined investors sell if a struggling stock ever falls more than -7% from their purchase price.Watson Pharmaceuticals (WPI +$0.28 or +0.34% to $82.93) has been holding its ground since its 8/24/12 gap up and solid gain above its pivot point backed by +143% above average volume triggered a technical buy signal. It rallied from a very tight trading range where volume totals had cooled for several weeks. It was highlighted in yellow in the 8/24/12 mid-day report with a pivot point based on its 7/26/12 high plus 10 cents. The considerable gain with above average volume followed news that its generic Lidoderm(R) received FDA approval, an encouraging development concerning the N criteria.
It reported earnings +41% on +25% sales revenues for the Jun '12 quarter. However, the sequential comparisons show recent deceleration in sales and earning growth rate, which is a small concern. The 5/09/12 mid-day report had previously noted - "Its improved fundamentals make it a worthy candidate for investors' watchlists. Sales revenues showed impressive acceleration while the 3 latest quarterly comparisons through Mar '12 showed earnings increases above the +25% guideline satisfying the C criteria. It also has maintained a strong annual earnings (A criteria) history." The number of top-rated funds owning its shares rose from 1,015 in Mar '12 to 1,067 in Jun '12, a reassuring sign concerning the I criteria. Its current Up/Down Volume Ratio of 1.8 is also an unbiased indication its shares have been under accumulation over the past 50 days.