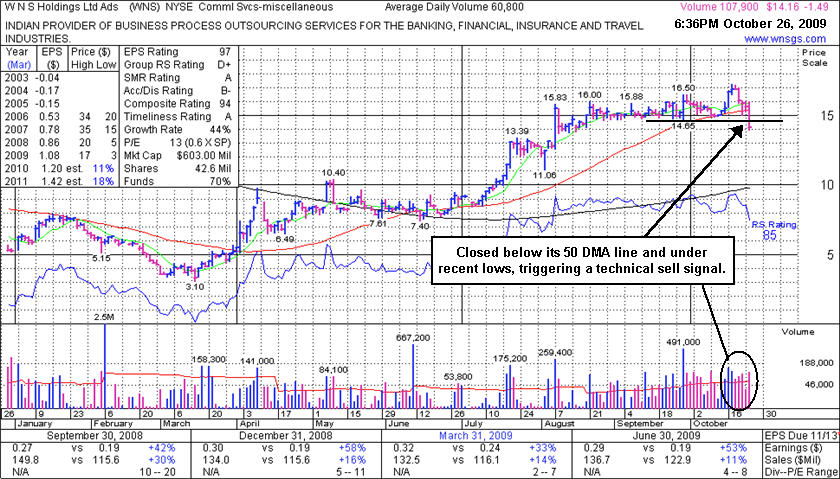
Violation Triggers Technical Sell Signal - Monday, October 26, 2009
W N S Holdings Ltd Ads (WNS -$1.49 or -10.52% to $14.16) has totally negated its breakout, and worse, as today's loss on above average volume led to a violation of its 50-day moving average (DMA) line and recent chart lows, triggering technical sell signals. The high-ranked Indian Commercial Services may serve as an example of why disciplined investors should limit losses if any stock falls more than 7-8% from the price paid. The deterioration back into its prior base had already raised concerns and been noted. It encountered prompt distribution pressure shortly after its 10/16/09 considerable gain on more than 2 times average volume which helped it trade and close above its pivot point, triggering a technical buy signal while clearing stubborn resistance.
Since featured at $15.28 in yellow in the 9/28/09 mid-day report (read here) it had encountered resistance in the $16 area while consolidating just above important support at its 50-day moving average (DMA) line. Quarterly earnings have been above the +25% guideline and its annual earnings history has been great, satisfying the C & A criteria. However, sales revenues growth has decelerated, raising some concerns. Only 14.5 million shares are in the public float, which is considered a good characteristic concerning the S criteria, and could contribute to greater volatility in the event of any heavier institutional buying or selling that may come.
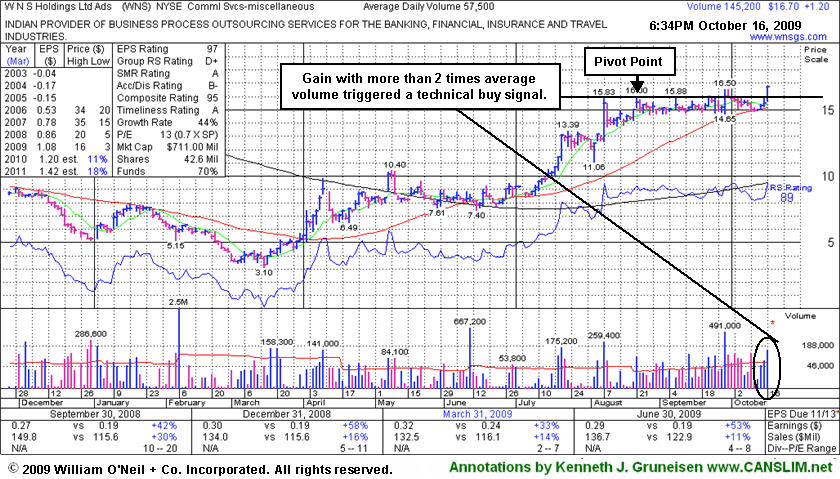
Technical BreakOut With Above Average Volume - Friday, October 16, 2009
W N S Holdings Ltd Ads (WNS +$1.20 or +7.20% to $16.70) posted a considerable gain today on more than 2 times average volume which helped it trade and close above its pivot point, triggering a technical buy signal while clearing stubborn resistance. Since featured at $15.28 in yellow in the 9/28/09 mid-day report (read here) it had encountered resistance in the $16 area while consolidating just above important support at its 50-day moving average (DMA) line. Quarterly earnings have been above the +25% guideline and its annual earnings history has been great, satisfying the C & A criteria. However, sales revenues growth has decelerated, raising some concerns. Only 14.5 million shares are in the public float, which is considered a good characteristic concerning the S criteria, and could contribute to greater volatility in the event of any heavier institutional buying or selling that may come.
For now, the high-ranked Indian Commercial Services might be an ideal candidate for investors' to accumulate, while disciplined investors would avoid chasing the stock more than +5% above its pivot point. Meanwhile, any deterioration back into its prior base would raise concerns, especially if it negates its breakout with a close under $16 again. Recent lows and its 50 DMA line are important support now, where violations would trigger technical sell signals.
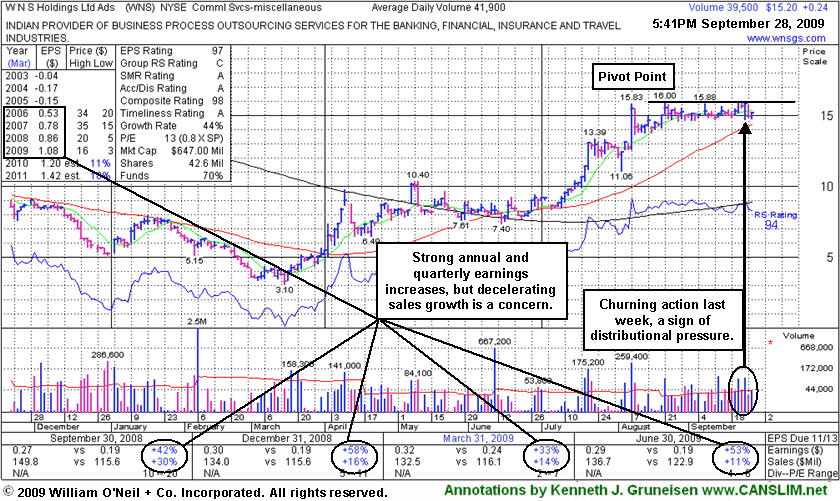
Orderly Base Takes Shape, Yet Patience Is Required - Monday, September 28, 2009
W N S Holdings Ltd Ads (WNS +$0.24 or +1.58% to $15.20) has formed an orderly flat base for at least 5-weeks, and it was featured in yellow in today's mid-day report (read here). It encountered resistance in the $16 area last week while consolidating just above important support at its 50-day moving average (DMA) line. The recent high-volume and lack of meaningful upward price progress chart-wise may be considered "churning" action, indicative of distributional selling pressure offsetting new buying efforts. Quarterly earnings have been above the +25% guideline and its annual earnings history has been great, satisfying the C & A criteria. However, sales revenues growth has decelerated, raising some concerns. Only 14.5 million shares are in the public float, which is considered a good characteristic concerning the S criteria, and could contribute to greater volatility in the event of any heavier institutional buying or selling that may come.
For now, the high-ranked Indian Commercial Services might be an ideal candidate for investors' watch lists, while disciplined investors would be patient to wait for a bullish technical buy signal. Gains above the pivot point with at least +50% above average volume or more are still needed to confirm a new technical buy signal. Meanwhile, any deterioration under recent lows or its 50 DMA line would raise concern and trigger technical sell signals.