Healthy Consolidation Above Prior Highs With Volume Cooling - Friday, July 13, 2012
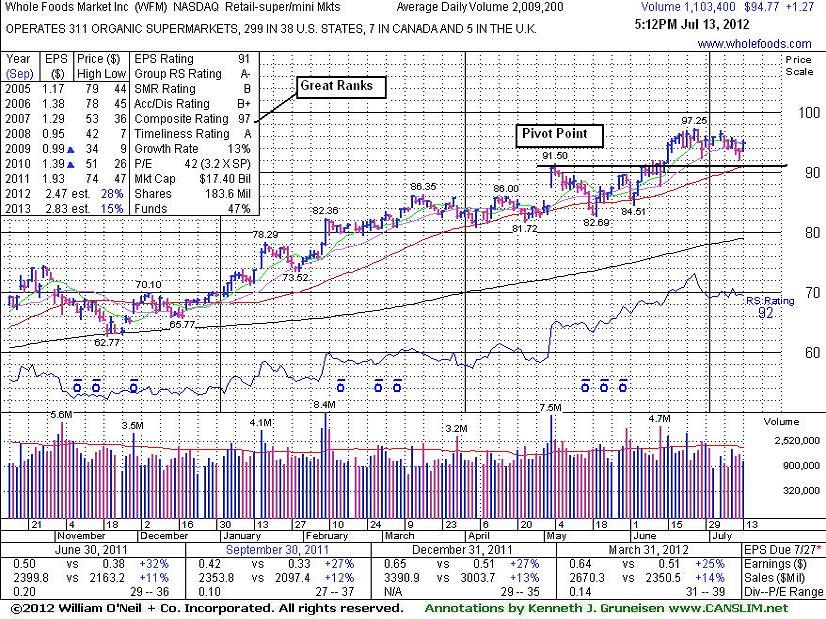
Whole Foods Market Inc (WFM +$1.27 or +1.36% to $94.77) is quietly consolidating below its "max buy" level. Volume totals have been cooling while it has been hovering above its pivot point and near its 52-week high with no resistance remaining due to overhead supply. Prior highs in the $91.50 area and its 50-day moving average DMA line define important support to watch where violations may trigger technical sell signals. It was last shown in this FSU section with an annotated graph on 6/13/12 under the headline, "New Pivot Point Cited While Contending With Distributional Pressure". A gain on 6/15/12 with +72% above average volume confirmed a technical buy signal.
The Retail - Super/Mini-Markets group has seen its Group Relative Strength Rating rise from 60 to 81 in the time since it was shown in this FSU section with an annotated graph on 5/11/12 under the headline, "Consolidating Above Prior Highs After Breakaway Gap". The improvement in group rank and ongoing leadership from a couple of other high-ranked companies in the industry group provides reassurances concerning the L criteria. Quarterly comparisons have shown strong earnings increases above the +25% guideline (C criteria). Its annual earnings (A criteria) history has been improving since a downturn in FY '08. The number of top-rated funds owning its shares rose from 1,046 in Jun '11 to 1,193 in Mar '12, a reassuring sign concerning the I criteria.
New Pivot Point Cited While Contending With Distributional Pressure - Wednesday, June 13, 2012
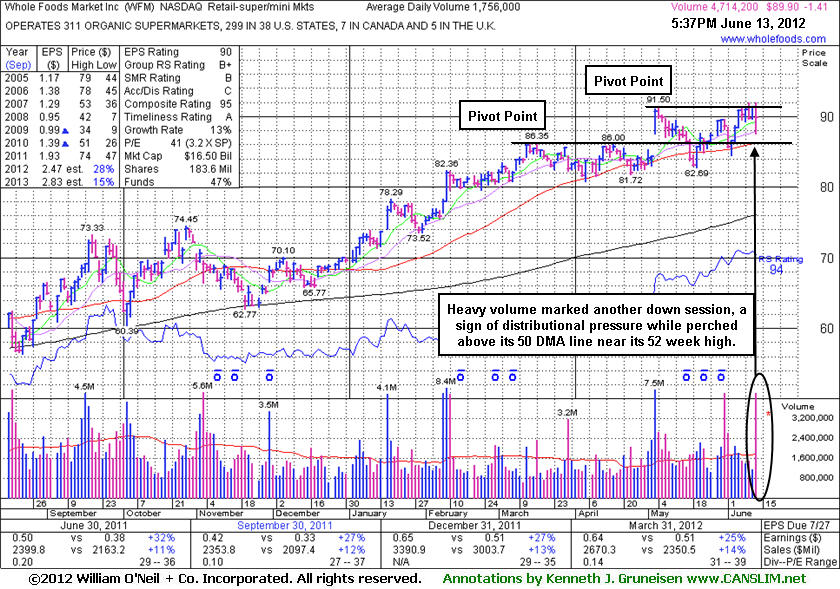
Whole Foods Market Inc (WFM -$1.41 or -1.54% to $89.90) traded heavy volume as it lost ground today, a sign of more distributional pressure. It has been churning above average volume near its 52-week high, making little progress above prior chart highs even while no resistance remains due to overhead supply. A new pivot point is being cited based on its 5/04/12 high plus 10 cents, and subsequent volume-driven gains may trigger a new (or add-on) technical buy signal. Keep in mind that 3 out of 4 stocks follow the direction of the major averages (M criteria), so the outcome in the weeks ahead depends greatly on the major averages' ability to halt the current correction and produce a new confirmed rally with a solid follow-through day.
Its 50-day moving average (DMA) line and prior lows define important near-term support, and subsequent violations would raise concerns and trigger technical sell signals. The Retail - Super/Mini-Markets group has seen its Group Relative Strength Rating rise from 60 to 76 in the time since it was last shown in this FSU section with an annotated graph on 5/11/12 under the headline, "Consolidating Above Prior Highs After Breakaway Gap". Its considerable "breakaway gap" on 5/03/12 had cleared an orderly flat base pattern, but its subsequent slump below prior highs and its 50 DMA line completely negated the bullish breakout. Ongoing leadership from a couple of other high-ranked companies in the industry group provides some reassurance concerning the L criteria. Quarterly comparisons have shown strong earnings increases above the +25% guideline (C criteria). Its annual earnings (A criteria) history has been improving since a downturn in FY '08. The number of top-rated funds owning its shares rose from 1,046 in Jun '11 to 1,202 in Mar '12, a reassuring sign concerning the I criteria.
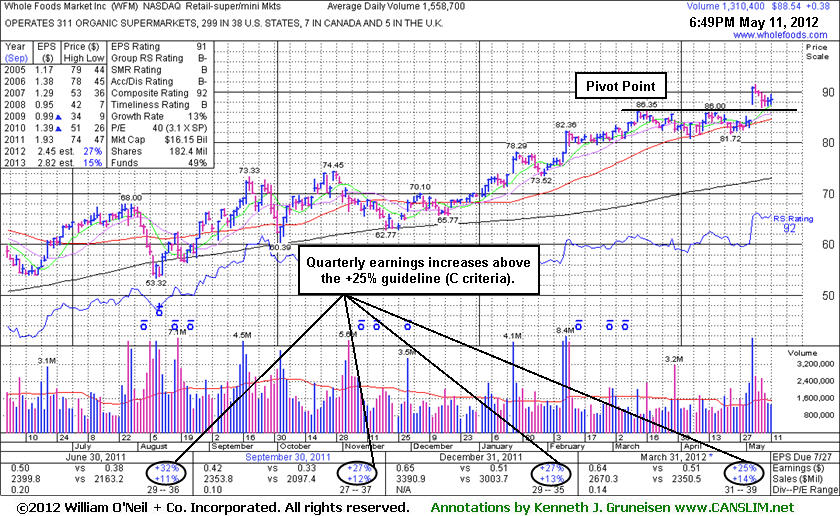
Consolidating Above Prior Highs After Breakaway Gap - Friday, May 11, 2012
Whole Foods Market Inc (WFM +$0.38 or +0.43% to $88.54) is consolidating above prior highs following its considerable "breakaway gap" on 5/03/12 that cleared an orderly flat base pattern. The is no resistance remaining due to overhead supply. Quarterly comparisons have shown strong earnings increases above the +25% guideline (C criteria). Its annual earnings (A criteria) history has been improving since a downturn in FY '08.The number of top-rated funds owning its shares rose from 1,046 in Jun '11 to 1,207 in Mar '12, a reassuring sign concerning the I criteria. The Retail - Super/Mini-Markets group currently has a mediocre Group Relative Strength Rating of 60, however leadership from a couple of other high-ranked companies in the industry group provides some reassurance concerning the L criteria. Keep in mind that 3 out of 4 stocks follow the direction of the major averages (M criteria), so the outcome in the weeks ahead depends greatly on the major averages' ability to halt the current correcrtion and produce a new confirmed rally with a solid follow-through day.