Fundamental News Leads To Big Technical Sell-Off - Tuesday, January 20, 2009
One of the critical characteristics of successful investing is knowing when to sell. Investors are best served when they buy based on the combination of strong fundamentals and technicals, then sell based on the technicals. The reason is because fundamentals often tend to lag a stock's technical condition and come to light later to help explain the technical chart action after the fact. Fundamental news can sometimes have a big and immediate impact on share prices, as is the case of today's example. However, it will take time before the actual numbers reported in the quarters ahead reveal the true impact of the news.
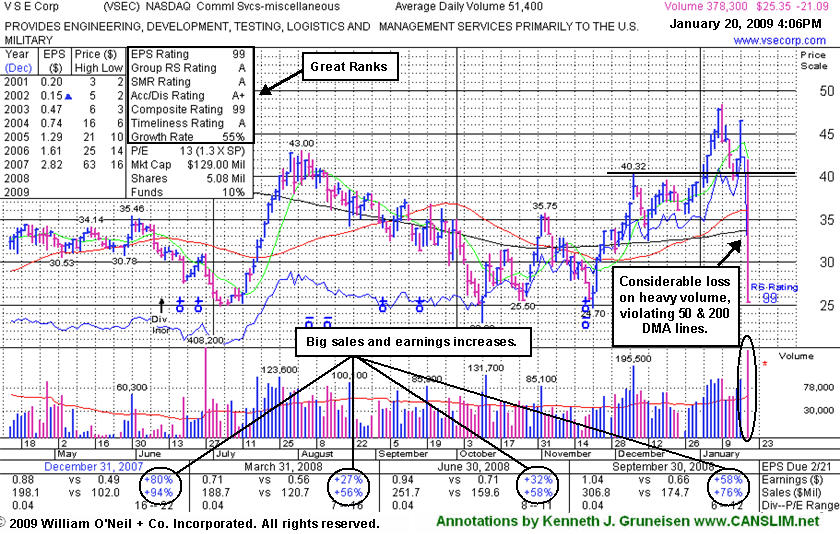
VSE Corp (VSEC -$21.09 or -45.41% to $25.35) gapped down today and suffered a huge loss, falling on very heavy volume, triggering technical sell signals while slicing under its 50-day and 200-day moving average (DMA) lines. The swift technical breakdown occurred after the military contractor announced that it lost its bid to continue working with the U.S. Army's Rapid Response program (read here). The action exemplifies how substantial fundamental news can have a very big and immediate impact on share prices. Today's weakness prompted all disciplined investors who may have accumulated an interest in VSEC's shares to rush to the exits and sell - based on the investment system's strict loss cutting rules that say to quickly sell any stock if it falls 7-8% from your buy price. Based on the fundamental and technical disappointments it will be dropped from the Featured Stocks list tonight.
The lack of market leadership coupled with the latest of many clear technical failures impacting the scant number of new breakouts re-emphasizes the call for investors to be especially cautious and protective of their capital. VSEC's negative reversal on 1/09/09 for a considerable loss on above average volume was noted in CANSLIM.net reports after the stock had gotten extended from a sound base by a streak of 9 gains on ever increasing volume and above average volume. The high-ranked leader had triggered a technical buy signal with a strong finish after featured in yellow in the 1/5/2009 CANSLIM.net Mid-Day Breakouts Report with a $40.42 pivot point (read here). Based on weak market conditions (the M criteria), recent notes in CANSLIM.net reports had suggested "caution, rather than accumulation, on pullbacks near prior chart highs - important support levels to watch now." The company's very small supply of only 3.96 million shares in the float certainly has contributed to its great volatility. It is in the Commercial Services -Miscellaneous Group which is ranked in the top quartile of the Industry Group rankings, satisfying the L criteria. Strong sales revenue growth and a solid earnings history (good C and A criteria) had also been noted. It had maintained strong fundamentals and rebounded impressively since it was previously dropped from the Featured Stocks list on on 1/3/08, after it was first featured on Tuesday, October 09, 2007 in the CANSLIM.net Mid Day Breakouts Report (read here).
C A N S L I M | StockTalk | News | Chart | SEC | Zacks Reports | ![]()
![]()
![]()
View all notes | Alert me of new notes | CANSLIM.net Company Profile
Old Resistance Often Gets Tested As Support - Tuesday, January 13, 2009
An important factor to consider is the ongoing action after a high-ranked leader has risen above its pivot point. In about 40% of the cases, the best stock market winners pulled back and tested support near prior chart highs or their pivot point before continuing on much higher. Healthy stocks rarely fall under their pivot point by more than 7%. Disciplined investors know to always limit losses and sell if ever a stock falls more than 7-8% from their buy point - per the investment system's sell rules which help investors to preserve their capital and avoid more substantial losses which are harder to make up.
VSE Corp (VSEC -$1.86 or -4.58% to $42.49) fell today on slightly higher that average volume, closing in the middle of its intra-day range and near its max buy level. A negative reversal on 1/09/09 for a considerable loss on above average volume followed a streak of 9 gains on ever increasing volume and above average volume that had gotten the stock extended from a sound base. The high-ranked leader triggered a technical buy signal with a strong finish after featured in yellow in the 1/5/2009 CANSLIM.net Mid-Day Breakouts Report with a $40.42 pivot point (read here).
It has dipped below its August chart high ($43.00), but remains above its pivot point and more recent chart highs that may now act as support. There is some additional overhead supply which could hinder its upward progress up through its 2007 high ($63 - see red circle). The company has demonstrated strong sales revenues and earnings increases and has earned stellar ranks. Its solid quarterly sales revenues are showing year-over-year growth well above the +25% guideline, and its solid quarterly and annual earnings increases satisfy the C & A criteria. It was dropped from the Featured Stocks list about one year ago, after it was first featured on Tuesday, October 09, 2007 in the CANSLIM.net Mid Day Breakouts Report (read here). VSEC was first featured on Tuesday, October 09, 2007 in the CANSLIM.net Mid Day Breakouts Report (read here).
C A N S L I M | StockTalk | News | Chart | SEC | Zacks Reports | ![]()
![]()
![]()
View all notes | Alert me of new notes | CANSLIM.net Company Profile
Breakout Stock In Demand Still Faces Additional Resistance - Monday, January 05, 2009
Often, when a leading stock is setting up to breakout of a solid base it is highlighted in CANSLIM.net's Mid-Day Breakouts Report. The most relevant factors are noted in the report which allows prudent investors to place the issue in their watch list. After doing any necessary backup research, the investor is prepared to act if and when the stock triggers a technical buy signal (breaks above its pivot point on more than +50% average turnover). In the event the stock fails to trigger a technical buy signal and its price declines then it will simply be removed from the watch list.
VSE Corp (VSEC +$2.53 or +6.36% to $42.34) finished the day with a solid gain above its pivot point on heavy volume after appearing earlier in the Mid-Day BreakOuts Report (read here). That helped it trigger a technical buy signal, however it will be important to watch closely for it to make additional headway above its August chart high ($43.00). There is some additional overhead supply which could hinder its upward progress up through its 2007 high ($63 - see red circle). However, after its choppy action in the past year and all of the horrific bear market action has been considered, VSEC has rebounded impressively. It is considered noteworthy now, while clearing resistance with streak of gains backed by ever-increasing volume. Disciplined investors know to always limit losses and seel if ever a stock falls more than 7-8% from their buy point - per the investment system's sell rules which help investors to preserve their capital and avoid more substantial losses which arer harder to make up.
The company has demonstrated strong sales revenues and earnings increases and has earned stellar ranks. Its solid quarterly sales revenues are showing year-over-year growth well above the +25% guideline, and its solid quarterly and annual earnings increases satisfy the C & A criteria. It was dropped from the Featured Stocks list about one year ago, after it was first featured on Tuesday, October 09, 2007 in the CANSLIM.net Mid Day Breakouts Report (read here).
C A N S L I M | StockTalk | News | Chart | SEC | Zacks Reports | ![]()
![]()
![]()
View all notes | Alert me of new notes | CANSLIM.net Company Profile
Small Supply Of Shares For This High-Ranked Breakout - Tuesday, October 09, 2007
Group action plays a very important role, and experienced investors learn that they can increase their odds of picking a great winner by always focusing their buying efforts in the market's leading groups. The L criteria tells us to choose leading companies in leading industry groups, thus it is suggested that investors choose from the top quartile of the 197 Industry Groups (listed in the paper most days on page B4). A classic example of the success enjoyed by many CANSLIM.net readers usually starts when an investor reads a CANSLIM.net report and buys a featured stock before it has risen above the pivot point by greater than 5%. After a stock breaks out above its pivot point, there is only a +5% window that investors have to purchase the stock under the proper guidelines. Once a stock rises above the "maximum buy price" the risk of a shake out balloons, meaning that even a normal retracement in the stock might force you to employ the 7-8% loss cutting rule. Much can be told by the stock's daily action in the weeks and months that follow a breakout. Typically, a light volume and orderly pullback suggests that the bulls remain in control. However, high volume pullbacks that violate support paint a totally different picture.
VSE Corp. (VSEC +$5.89 or 9+11.56% to $56.93) surged into new high territory and triggered a new technical buy signal when it vaulted out of a choppy cup-with-handle base on above average volume. This stock was first featured in yellow today with an annotated graphs (Tuesday, October 9, 2007) in the CANSLIM.net Mid Day Breakouts Report (read here) with a $51.43 pivot point. VSE Corp sports a very healthy Earnings Per Share (EPS) rating of 99 and an equally impressive Relative Strength (RS) rating of 99. VSEC resides in the Commercial Services- misc group which is currently ranked 50th of out the 197 Industry Groups covered in the paper (essentially satisfying the L criteria). The number of top-rated funds with an ownership interest has increased from 9 funds in December ‘06 to 10 funds as of September '07, a sign of increasing institutional interest (the I criteria). This high ranked leader quickly jumped above its $54 maximum buy price which made it a stretch for disciplined investors know to avoid chasing extended stocks. As long as this breakout is not negated, odds favor that further highs will follow. Its small supply of shares outstanding (the S criteria) contributed to the stock's volatility as it showed clear signs of institutional accumulation with today's strong technical breakout. It was a new high close with volume about twice its average daily trading total.
C A N S L I M | StockTalk | News | Chart | ![]()
![]()
![]() SEC | Zacks Reports
SEC | Zacks Reports

View all notes | Alert me of new notes | CANSLIM.net Company Profile