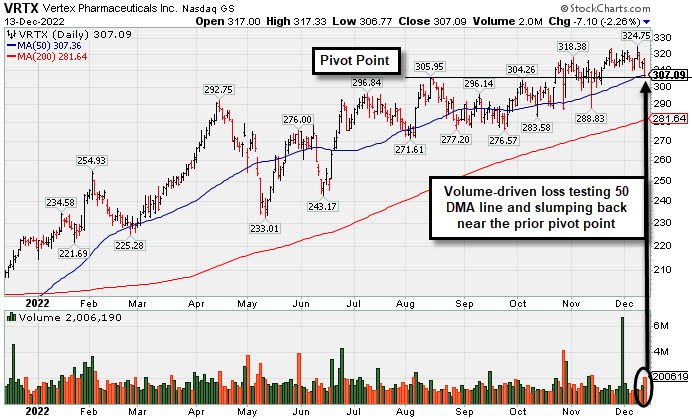
Testing Support Near 50-Day Moving Average Line and Prior Pivot - Tuesday, December 13, 2022
Vertex Pharmaceuticals (VRTX -$7.10 or -2.26% to $307.09) pulled back today with above average volume after wedging to new highs with light volume. It is testing near its 50-day moving average (DMA) line ($307.36) which defines near-term support to watch. Recently it reported Sep '22 quarterly earnings +14% on +18% sales revenues versus the year ago period, below the +25% minimum earnings guideline, raising fundamental concerns (C criteria). Annual earnings (A criteria) history has been strong.
VRTX was highlighted in yellow in the 10/24/22 mid-day report (read here) with pivot point cited based on its 8/15/22 high plus 10 cents. It was covered in this FSU section in greater detail on 11/16/22 with an annotated graph under the headline, "Made Little Progress Following Breakout and Latest Earnings News".
VRTX currently has a 98 Earnings Per Share Rating. It fell from 99 recently after it reported Sep '22 quarterly earnings +14% on +18% sales revenues versus the year ago period, below the +25% minimum earnings guideline, raising fundamental concerns (C criteria). Annual earnings (A criteria) history has been strong.
It hails from the Medical-Biomed/Biotech industry which is currently ranked 30th on the 197 Industry Groups list. It has 256.7 million shares outstanding (S criteria). The number of top-rated funds owning its shares rose from 2,722 in Dec '21 to 3,292 in Sep '22, a reassuring sign concerning the I criteria. Its current Up/Down Volume Ratio of 1.7 is an unbiased indication its shares have been under accumulation over the past 50 days. It has a Timeliness Rating of A and Sponsorship Rating of C.
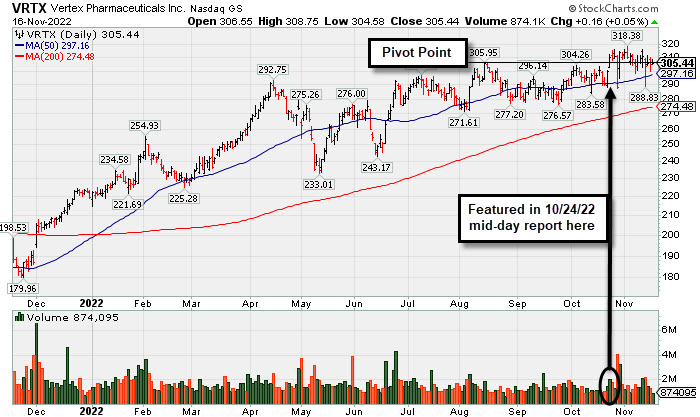
Made Little Progress Following Breakout and Latest Earnings News - Wednesday, November 16, 2022
Vertex Pharmaceuticals (VRTX +$0.16 or +0.05% to $305.44) recently showed resilience after briefly undercutting its 50-day moving average (DMA) line ($297). That important moving average defines near-term support above recent intra-day lows in the $287-288 area.
VRTX was highlighted in yellow in the 10/24/22 mid-day report (read here) with pivot point cited based on its 8/15/22 high plus 10 cents. That evening it was covered in this FSU section in greater detail with an annotated graph under the headline, "Volume-Driven Gain Triggered Technical Buy Signal".
VRTX currently has a 98 Earnings Per Share Rating. It fell from 99 recently after it reported Sep '22 quarterly earnings +14% on +18% sales revenues versus the year ago period, below the +25% minimum earnings guideline, raising fundamental concerns (C criteria). Annual earnings (A criteria) history has been strong.
It hails from the Medical-Biomed/Biotech industry which is currently ranked 14th on the 197 Industry Groups list It has 256.7 million shares outstanding (S criteria). The number of top-rated funds owning its shares rose from 2,722 in Dec '21 to 3,257 in Sep '22, a reassuring sign concerning the I criteria. Its current Up/Down Volume Ratio of 1.4 is an unbiased indication its shares have been under accumulation over the past 50 days. It has a Timeliness Rating of A ad Sponsorship Rating of B.
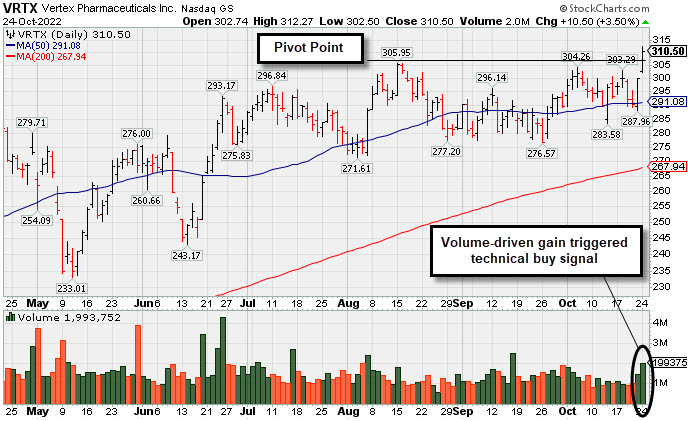
Volume-Driven Gain Triggered Technical Buy Signal - Monday, October 24, 2022
Vertex Pharmaceuticals (VRTX +$10.50 or +3.50% to $310.50) was highlighted in yellow in the earlier mid-day report (read here) with pivot point cited based on its 8/15/22 high plus 10 cents. It hit a new 52-week high with today's gain above the pivot point backed by +56% above average volume triggering a proper technical buy signal.
VRTX has a highest possible 99 Earnings Per Share Rating. It reported greatly improved earnings on +22% sales revenues for the Jun '22 quarter versus the year-ago period, and 3 of the past 4 quarterly comparisons were above the +25% minimum earnings guideline (C criteria). Its annual earnings (A criteria) history has been strong.
It hails from the Medical-Biomed/Biotech industry which is currently ranked 7th on the 197 Industry Groups list It has 256.5 million shares outstanding (S criteria). The number of top-rated funds owning its shares rose from 2,722 in Dec '21 to 3,215 in Sep '22, a reassuring sign concerning the I criteria. Its current Up/Down Volume Ratio of 1.3 is an unbiased indication its shares have been under accumulation over the past 50 days. It has a Timeliness Rating of A ad Sponsorship Rating of B.