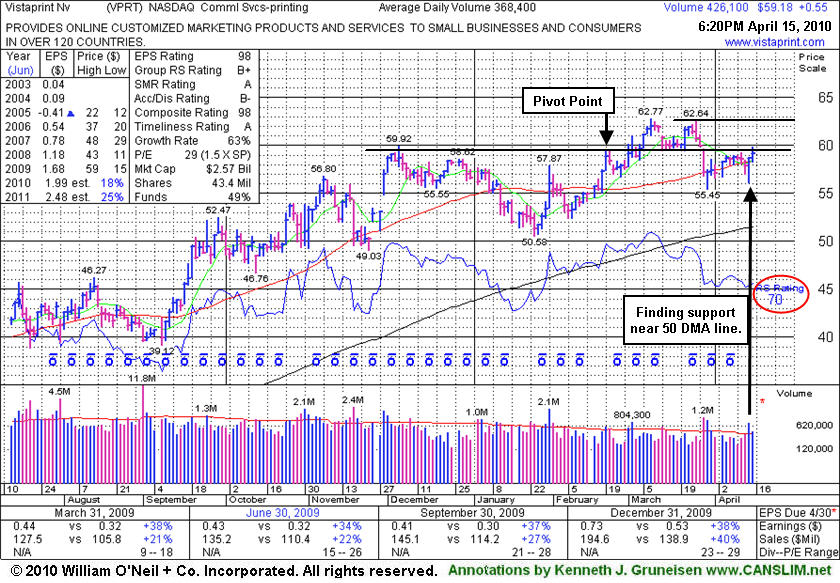
Vistaprint Nv. (VPRT +$0.55 or +0.94% to $59.18) posted a gain today, and it recently has been finding impressive support near its 50-day moving average (DMA) line. A subsequent violation of the short-term average or recent chart low ($55.45) would raise concerns and trigger technical sell signals. It is still too early to consider its $62.64 high a valid new pivot point for a "double bottom" type base, as it has only been consolidating for 6 weeks since peaking at $62.77. The minimum length for a proper double bottom base is 8 weeks. If it undercuts the recent chart low ($55.45) and then rebounds, today's high may end up being the pivot point of a double bottom base of sufficient length. In a proper double bottom base, the second low undercuts an earlier low, and the pivot point its the middle high of the "W" pattern formed.
The Netherlands headquartered high-ranked Commercial Services - Printing firm is known for its aggressive online advertising for a small order of free business cards. The C and A criteria are satisfied as the company has demonstrated solid quarterly sales revenues and earnings increases (above the +25% minimum guideline) and it has a good annual earnings history. Technically, however, its Relative Strength rank (see red circle) has slumped to 70 from 82 since it was featured in the March 2010 CANSLIM.net News monthly newsletter (read here). As previously noted, "Its gain on 3/02/10 was below the volume guidelines for buyable breakouts under the investment system. The stock needed to produce gains above its $59.70 pivot point with +50% above average volume or greater to trigger a solid technical buy signal.
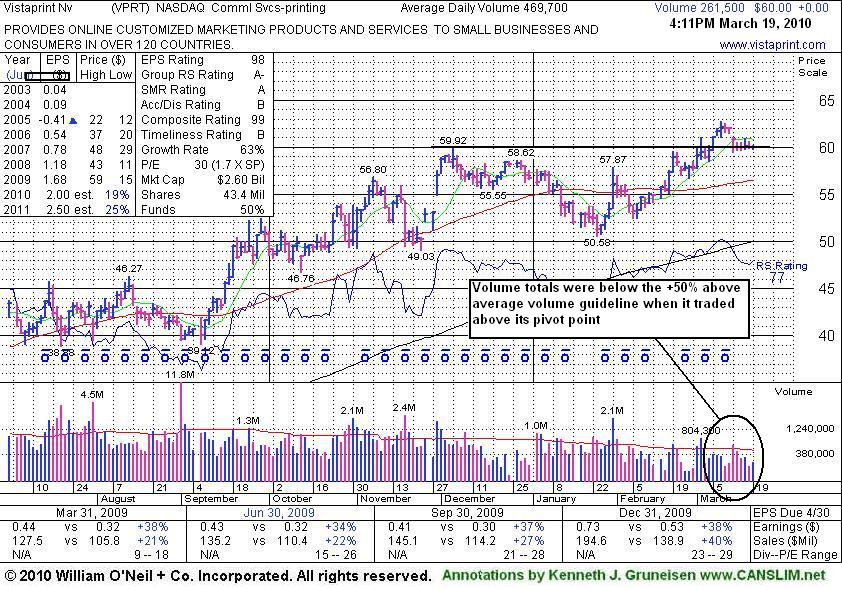
Vistaprint Nv. (VPRT $60.00) traded with mostly light volume this week while consolidating in a tight trading range and closing only -4.4% from its 3/09/10 all-time high. It did not trigger a technical buy signal, and its Relative Strength rank has slumped to 77 from 82 since it was featured in the March 2010 CANSLIM.net News monthly newsletter (read here). The market produced a follow-through-day from at least one of the major averages to satisfy the M criteria, giving disciplined investors a green light to accumulate shares of companies that have met the guidelines. However, as previously noted, "Its gain on 3/02/10 was below the volume guidelines for buyable breakouts under the investment system. The stock needs to produce gains above its $59.70 pivot point (previously cited) with +50% above average volume or greater to trigger a solid technical buy signal.
The Netherlands headquartered high-ranked Commercial Services - Printing firm is known for its aggressive online advertising for a small order of free business cards. The C and A criteria are satisfied as the company has demonstrated solid quarterly sales revenues and earnings increases (above the +25% minimum guideline) and it has a good annual earnings history. Volume totals have been generally cooling off in recent weeks. The quiet action suggests that very few shareholders are exiting while it hovers near all-time highs, which is reassuring.
An upward trendline, by definition, develops as a stock steadily appreciates over an extended period of time. During that period the stock vacillates between the lower and upper boundaries of trendlines which can be drawn connecting a series of recent highs or lows. In order to ensure the overall health of the stock, the lower boundary should not be violated. Technically, if the lower boundary is violated this signals that the trend is deteriorating and bears are gaining control, making the odds start to favor the possibility of further downside testing.
VistaPrint Ltd. (VPRT -$1.35 or -3.49% to $37.38) sliced below its multi-month upward trendline on Monday. This stock was first featured on Wednesday, January 10, 2007 with an annotated DailyGraph(R) in the CANSLIM.net Mid Day Breakouts Report and a $36.67 pivot point (read here). For the next month the stock rallied impressively, hitting a new all time high of $43.30 before pulling back. This was a respectable +18% advance above the stock's pivot point. While the major averages went through their steep correction, VPRT was pressured down below its 50-day moving average (DMA) line, but it made a stand near prior chart highs.
Recently VPRT appeared in the April 2, 2007 CANSLIM.net After Market Update (read here) as it was testing its well-defined upward trendline. At that time VPRT found support, and it spent the month of April consolidating, then advancing toward its prior highs. However, new highs were not actually reached, and the company's shares were punished after it reported its first quarter results, earning $0.20 per share, which is +25% higher than the $0.16 earned in the same period last year. Sales revenues for the quarter jumped to $69.3 million, up +67% from the $41.6 million in Q1 of 2006. Despite the fact that it satisfied the "C" criteria (minimum +25% earnings growth over the past few quarters) the stock's technical deterioration is what warrants discussion. The stock has sliced under its 50 DMA line again and now it has also violated its upward trendline, with losses coming on heavier than average volume as both important areas of support were breached. Ideally, one would like to see volume expand as stocks advance and see volume get lighter as they decline.
Disciplined investors are not likely to be stubborn about holding a stock that is acting like a laggard, but its low close of $35.95 on March 5th now marks an important low close for chart readers to keep an eye on, where a violation technically could signal more serious trouble ahead. The stock's Earnings Per Share rating (EPS) and Relative Strength ratings have also fallen to a 62 and 75 respectively, both lower than the 80+ guideline for most new buy candidates you will find featured in CANSLIM.net reports. Much of the past few months' worth of bullish action has been negated. As a result of all above factors, VRPT will be removed from the CANSLIM.net Featured Stocks List.
C A N S L I M | StockTalk | News | Chart | ![]() DGO | SEC | Zacks Reports
DGO | SEC | Zacks Reports

View all notes | Alert me of new notes | CANSLIM.net Company Profile
An upward trendline, by definition, develops as a stock steadily appreciates over an extended period of time. During that period, the stock vacillates between the lower and upper boundaries of trendlines which can be drawn connecting a series of recent highs or lows. In order to ensure the overall health of the stock, the lower boundary should not be violated. Technically, if the lower boundary is violated this signals that the trend is deteriorating and bears are gaining control, making the odds start to favor the possibility of further downside testing.
VistaPrint Ltd. (VPRT -$0.86 or -2.25% to $37.44) traded down today on lighter than average volume, continuing to fall toward the lower boundary of its multi-month upward trendline (shown below). This stock's Earnings Per Share (EPS) rank was 84 when it was first featured on Wednesday, January 10, 2007 with an annotated DailyGraph(R) in the CANSLIM.net Mid Day Breakouts Report and a $36.67 pivot point (read here). A few weeks later, VPRT appeared with a detailed analysis in the January 26, 2007 CANSLIM.net After Market Report (read here) as it was gapping up and rising into new all-time high territory. That momentum carried it higher for a few days, but the stock failed to make very significant price progress. Instead, over a period of weeks it flashed a flurry of technical sell signs. Several of its losses in the past couple of months came on higher than average volume, but few of its gains did. Within a few weeks, the January 26, 2007 bullish gap up was filled as this stock drifted down toward its 50-day moving average (DMA) line. The stock failed to find support at its 50 DMA line, instead slicing under it. However, its most recent chart low coincided nicely with support near its prior chart highs, another very logical support level for chart readers.
Now it would take a rally above its most recent chart high ($40.91 on March 21st) to rise clear of resistance. Meanwhile, VPRT is approaching longer-term support offered the lower boundary of the stock's multi-month upward trendline. If that technical level is breached, additional concerns would be raised about its deteriorating strength. Beyond that, a violation of the March 5th low close ($35.95) would create a worrisome situation, as the bears would gain the upper hand and the odds would increase that lower prices would more likely follow. Notice that its EPS rank has fallen to a 72 today, even though it showed a +69% earnings increase for the quarter ended December 31, 2006, well above the +25% guideline for the "C" criteria. Knowing when to sell is, in many cases, just as important as knowing when to buy.
C A N S L I M | StockTalk | News | Chart | ![]() DGO | SEC | Zacks Reports
DGO | SEC | Zacks Reports

View all notes | Alert me of new notes | CANSLIM.net Company Profile
A classic example of the success enjoyed by many CANSLIM.net readers usually starts when an investor reads a CANSLIM.net report and buys a featured stock before it has risen above the pivot point by greater than 5%. After a stock breaks out above its pivot point, there is only a +5% window that investors have to purchase the stock under the proper guidelines. Once a stock rises above the "maximum buy price" the risk of a shake out balloons, meaning that even a normal retracement in the stock might force you to employ the 7-8% loss cutting rule. Much can be told by the stock's daily action in the weeks and months that follow a breakout. Typically, a light volume and orderly pullback suggests that the bulls remain in control. However, high volume pullbacks that violate support paint a totally different picture.
VistaPrint Ltd. (VPRT +$5.14 or +11.03% to $41.45) gapped up and ended at a new all-time high close with a considerable gain on nearly 8 times normal volume Friday. A gap up is an indication of heavy institutional buying demand, helping satisfy the "I" criteria. This stock was recently featured on Wednesday, January 10, 2007 in the CANSLIM.net Mid Day Breakouts Report (read here) at $36.67 as it was approaching its $37.04 pivot point. VistaPrint sports an Earnings Per Share (EPS) rating of 84. It is also encouraging to see the company earn a Relative Strength (RS) rating of 82, which will likely change for the better after such an explosive move to the upside. The company has managed to increase its earnings by above the +25% guideline in each of the past four quarterly comparisons versus the year earlier, satisfying the "C" criteria. VPRT resides in the Comml Svcs-printing group which is currently ranked 81st of out the 197 Industry Groups covered in the paper, placing outside of the much preferred top quartile. Shortly after VPRT triggered a technical buy signal with its breakout, the stock pulled back and found support near its pivot point, never closing back under its November '06 high closes or under its February '06 high close. It held up perfectly well even while many market leaders encountered selling pressure in then past week, another sign of a true leader. And after promptly finding support, it was very encouraging to see this issue blast into new high territory with gains on monstrous volume after reporting solid Q4 financial results.
It is important to note that this stock has quickly jumped above its pivot point by more than +5%, exceeding its "maximum buy" price of $38.89. It is usually best to trade within the proper guidelines. As always, it is of the utmost importance to sell a stock if it drops 7-8% below your purchase price.
C A N S L I M | StockTalk | News | Chart | ![]() DGO | SEC | Zacks Reports
DGO | SEC | Zacks Reports

View all notes | Alert me of new notes | CANSLIM.net Company Profile
Volume is a vital component of technical analysis. Prudent investors that incorporate volume into their stock analysis have often benefited several fold. Ideally, healthy stocks will more often tend to rise on higher volume and pullback on lighter volume. Volume is a great proxy for institutional sponsorship. Conversely, high volume declines can be an ominous, as this usually signals distribution and further price deterioration are more likely to follow.
VistaPrint Ltd. (VPRT +1.86 or +4.80% to $36.92) vaulted out of a very long cup-with-handle type pattern with a considerable gain on more than 4 times its average daily trading volume. This stock was first featured today in the CANSLIM.net Mid Day Breakouts Report (read here) with a $37.04 pivot point, as its early action was triggering a technical buy signal. The stock has impressive ranks including its earnings per share rating (EPS) of 84 and its relative strength rating (RS) of 91. Both ranks are above the minimum 80+ guideline. The company has managed to increase its earnings by triple digit percentages in each of its past four quarterly comparisons versus the year earlier (satisfying the "C" criteria). However, VPRT resides in the Comml Svcs-printing group which is currently ranked 76 out of the 197 Industry Groups covered in the paper, placing the group below the much preferred top quartile.
The annotated DailyGraph(R) below does not allow you to see the full cup-with-handle pattern formed over the prior 10 months, so it may be helpful to study the longer term chart further below. It was very encouraging to see volume surge as this leader jumped above its pivot point. Some might argue that this stock has emerged out of a shorter "double bottom" pattern, or a relatively flat base which would perhaps generate a slightly different pivot point. However, a breakout to new all-time highs is a necessity in the context of a system designed for selecting stocks that might rise many-fold in price.
Regardless of which base one selects, in the prior days, volume did not jump above average to meet the required +50% above average level to trigger a proper technical buy signal. So, today was the first chance to buy properly, as volume behind the early gains met that important guideline. Additional gains on above average volume may be watched for to provide confirmation of the breakout, especially since it closed today's session off its earlier highs and slightly under the pivot point we have identified in our analysis. Investors can usually avoid greater losses when the sell rules are strictly followed, which is why it is equally important to always play good defense whenever any stock falls more than 7-8% below your purchase price.
C A N S L I M | StockTalk | News | Chart | ![]() DGO | SEC | Zacks Reports
DGO | SEC | Zacks Reports

View all notes | Alert me of new notes | CANSLIM.net Company Profile

