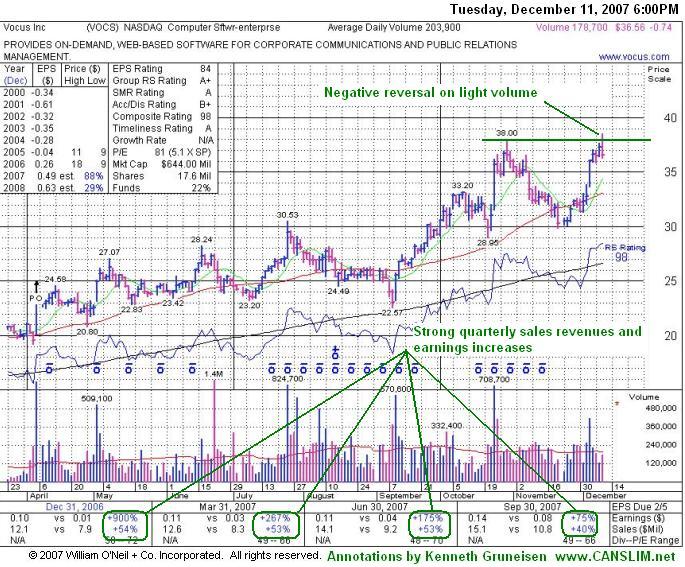
After a stock breaks out, it is imperative to continue monitoring its daily and weekly price and volume patterns for any possible ailments that may develop. Every so often, there are a few ominous technical signals that emerge. Prudent investors have learned to identify them due to the fact that they tend to lead to lower prices. One of these disconcerting technical signals is called a negative reversal. A negative reversal occurs when a stock opens up the session heading higher but then reverses and ultimately closes lower. Reversals are often considered more severe if the stock's initial gains lift it to a new high, but it then reverses and closes for a loss on heavier than average volume and ends near the session's utmost lows. Negative reversals can occur on a daily, weekly and monthly chart. In general, the longer the time frame involved, the more concern is prompted by the severity of the reversal. Volume is directly correlated with the severity as well.
Vocus Inc. (VOCS -$0.74 or -2.07% to $36.56) negatively reversed from early gains that had helped it hit a new all-time. Negative reversals from new chart highs with heavy volume can be worrisome signs that a stock is encountering resistance due to distributional selling pressure. In this case, below average volume was a reassuring sign that at least there was not a great rush to the exits by large institutional owners. The stock sports a healthy Earnings Per Share (EPS) rating of an 84 and Relative Strength rating (RS) of 90. VOCS was first featured in yellow with an annotated graph on Thursday, April 05, 2007 in the CANSLIM.net Mid Day Breakouts Report (read here) with a $21.92 pivot point and a $23.02 maximum buy price. Without falling back to close in the prior base, the stock quickly gained +25% in the next month. VOCS last appeared in the October 24, 2007 edition of the CANSLIM.net's Mid Day Breakouts Report (read here) with a new pivot point of $30.63 and a $32.16 maximum buy price. Since then, the stock rallied another +12% before pulling back. After finding support near its pivot point, the stock quickly shot up and hit a fresh all-time high.
C A N S L I M | StockTalk | News | Chart | SEC | Zacks Reports | ![]()
![]()
![]()
View all notes | Alert me of new notes | CANSLIM.net Company Profile
An upward trendline, by definition, develops as a stock steadily appreciates over an extended period of time. During that period the stock vacillates between the lower and upper boundaries of trendlines which can be drawn connecting a series of recent highs or lows. In order to ensure the overall health of the stock, the lower boundary should not be violated. Technically, if the lower boundary is violated this signals that the trend is deteriorating and bears are gaining control, making the odds start to favor the possibility of further downside testing.
Vocus Inc. (VOCS +$0.04 or +0.16% to $25.17) closed near the lower boundary of its multi-month upward trendline. The stock has been a strong leader of late, which is best evidenced by the stock's solid upward trendline and its very healthy Relative Strength rating (RS) of 93. It also sports a healthy Earnings Per Share (EPS) rating of an 84, and it has held up well in recent weeks as the market corrected. Due to the fact that 3 out of 4 stocks typically follow the direction of the broader market, a proper follow-through day is needed to satisfy the "M", and a powerful gain on heavy volume from a proper base needs to occur before this stock should be considered a sound new buy candidate. When this occurs, one point we have made before about investors buying additional shares at higher levels is that they must be careful to buy fewer shares at the higher price, avoiding substantially raising their cost basis.
VOCS was first featured in yellow with an annotated graph on Thursday, April 05, 2007 in the CANSLIM.net Mid Day Breakouts Report (read here) with a $21.92 pivot point and a $23.02 maximum buy price. Without falling back to close in the prior base, the stock quickly gained +25% in the next month. VOCS last appeared in the July 3, 2007 edition of CANSLIM.net's After Market Report as it was testing its 50 DMA and its shorter term upward trendline (read here).
C A N S L I M | StockTalk | News | Chart | ![]() DGO | SEC | Zacks Reports
DGO | SEC | Zacks Reports

View all notes | Alert me of new notes | CANSLIM.net Company Profile
An upward trendline, by definition, develops as a stock steadily appreciates over an extended period of time. During that period the stock vacillates between the lower and upper boundaries of trendlines which can be drawn connecting a series of recent highs or lows. In order to ensure the overall health of the stock, the lower boundary should not be violated. Technically, if the lower boundary is violated this signals that the trend is deteriorating and bears are gaining control, making the odds start to favor the possibility of further downside testing.
Vocus Inc. (VOCS -$0.24 or -0.98% to $24.25) pulled back on light volume and continued testing the lower boundary of its multi-month upward trendline. This is the second consecutive day the stock closed below its 50-day moving average (DMA) line and is now testing its longer term upward trendline. It is very important for the bulls to show up and defend this multi month upward trendline. As long as VOCS continues trading above this important technical area of support, odds are good that higher prices will eventually follow. However, damaging losses leading to a close below this important trendline would be a worrisome technical sell signal.
VOCS was first featured in yellow with an annotated DailyGraph(R) on Thursday, April 05, 2007 in the CANSLIM.net Mid Day Breakouts Report (read here) with a $21.92 pivot point and a $23.02 maximum buy price. Without falling back to close in the prior base, the stock quickly gained +25% in the next month. Ideally, one would like to see it bounce off support near its 50 DMA line while volume swells as it again blasts to new high territory. Its June rally attempt that briefly got it trading up over its May highs lacked sufficient volume behind the gains as it reached new high ground. Now any close above its best prior close of $27.31 on June 21st, 2007, with considerable gains backed by at least +50% above average volume, would be a bullish new technical breakout. Consider watching for a new pivot point ten cents above its recent high of $28.24, however, one should realize it may take weeks for a proper new buy signal to materialize. Investors buying additional shares at higher levels need to be careful to buy fewer shares at the higher price, avoiding substantially raising their cost basis.
C A N S L I M | StockTalk | News | Chart | ![]() DGO | SEC | Zacks Reports
DGO | SEC | Zacks Reports

View all notes | Alert me of new notes | CANSLIM.net Company Profile
A very important technical tool that savvy investors have learned to incorporate in their technical analysis is the 50-day moving average (DMA) line. The 50 DMA line plays a pivotal role relative to a stock's price. If the price of a stock is above its 50 DMA then odds are that its 50 DMA will act as formidable support. Conversely, if the price is below its 50 DMA then the moving average acts as resistance. Healthy stocks sometimes trade under their 50 DMA lines briefly, but usually a strong candidate will promptly bounce and repair a 50 DMA violation. When a stock has violated its 50 DMA line and then lingers beneath it, the stock's outlook gets worse and worse as it spends a greater period of time trading under that important short-term average line. Once the 50 DMA line starts sloping downward it should also be acknowledged that the stock has been struggling for a while, and it might be time to reduce exposure and look for places to put that money to work in stronger buy candidates.
Vocus Inc. (VOCS +$0.92 or +3.55% to $24.96) closed four cents under its intra-day high today. Its has spent the past few weeks quietly finding support above its 50 DMA line and above the lower boundary of its longer term upward trendline. It is very healthy to see a stock find support at or above important areas of chart support. Another healthy sign is that volume has dried up over the past six weeks as this stock lingered near its highs while consolidating. As long as VOCS continues trading above these technical levels of support, odds are that higher prices will eventually follow. However, losses leading to violations and closes below those key areas would be worrisome technical sell signals.
This stock was first featured in yellow with an annotated DailyGraph(R) on Thursday, April 05, 2007 in the CANSLIM.net Mid Day Breakouts Report (read here) with a $21.92 pivot point and a $23.02 maximum buy price. Without falling back to close in the prior base, the stock quickly gained +25% in the next month. Ideally, one would like to see it bounce off its 50 DMA line while volume swells as it again blasts to new high territory. Any close above its best prior close of $26.26 on May 8th, 2007 with considerable gains backed by heavy volume would be a bullish sign. Consider watching a new pivot point ten cents above that day's high, or $27.17 . Gains beyond that level backed by at least +50% above average volume would trigger a new buy signal. Investors buying additional shares at higher levels need to be careful to buy fewer shares at the higher price, avoiding substantially raising their cost basis.
C A N S L I M | StockTalk | News | Chart | ![]() DGO | SEC | Zacks Reports
DGO | SEC | Zacks Reports

View all notes | Alert me of new notes | CANSLIM.net Company Profile
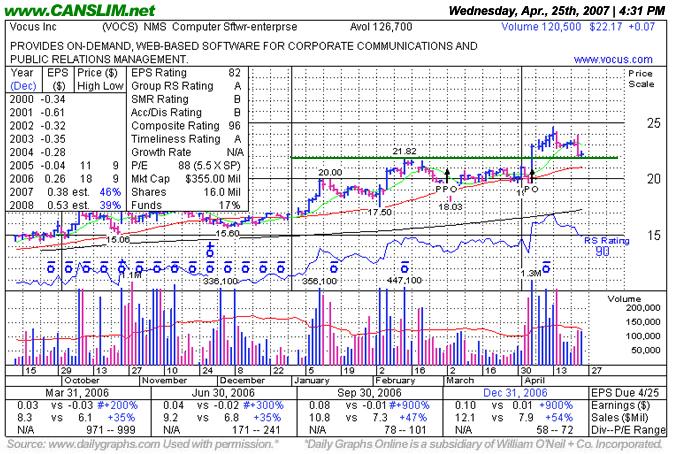
Another important factor is the relationship between an uptrend and a stock's pivot point. Typically, stocks begin forming an uptrend after rising above their pivot point. In the event the upward trend is violated, the stock will generally be expected to continue falling until it can retest support. Initial support is often the 50 DMA, or its pivot point, whichever is higher.
Vocus Inc. (VOCS +$X.XX or +X.XX% to $XX.XX) pulled back and found support just above its prior chart highs from February 14, 2007. This stock was first featured on Thursday, April 05, 2007 in the CANSLIM.net Mid Day Breakouts Report (read here) with a $21.92 pivot point and a $23.02 maximum buy price. Vocus sports an Earnings Per Share (EPS) rating of 82. It is also encouraging to see the company earn a very healthy Relative Strength (RS) rating of 90. The company has enjoyed impressive gains in each of the past four quarterly comparisons versus the year earlier, satisfying the "C" criteria. VOCS resides in the Computer Software-enterprise group which is currently ranked 20th of out the 197 Industry Groups covered in the paper, placing it in the much preferred top quartile and satisfying the "L" criteria.
After its initial appearance in the CANSLIM.net reports, VOCS continued advancing before its recent pullback. There are two important events that have occurred as this stock pulled back. First, volume dried up as this stock pulled back, a very healthy feat. Second, VOCS managed to find support near its prior chart highs. Statistically, about 40% of winning stocks will pull back after breaking out. In other words, it is not uncommon for stocks to pullback and retest support near their pivot point after breaking out. It is important to see the bulls show up and offer support at or above the pivot point. This may offer investors a chance to increase their exposure before the stock continues advancing. Heavy volume behind losses can be cause for concern, especially if the stock does not find support at its pivot point. Therefore, as long as this stock continues trading above its pivot point and old chart high closes, then the breakout will remain intact and odds favor further gains are likely.
Another important factor is the relationship between an uptrend and a stock's pivot point. Typically, stocks begin forming an uptrend after rising above their pivot point. In the event the upward trend is violated, the stock will generally be expected to continue falling until it can retest support. Initial support is often the 50 DMA, or its pivot point, whichever is higher.
Vocus Inc. (VOCS +$0.07 or +0.31% to $22.17) has pulled back to a level of important chart support just above its prior chart high ($21.82) from February 14, 2007. This stock was first featured on Thursday, April 05, 2007 in the CANSLIM.net Mid Day Breakouts Report (read here) with a $21.92 pivot point and a $23.02 maximum buy price. Vocus presently sports a healthy Earnings Per Share (EPS) rating of 82. It is also encouraging to see the company earn a very healthy Relative Strength (RS) rating of 90. The company has enjoyed impressive gains in each of the past four quarterly comparisons versus the year earlier, satisfying the "C" criteria. VOCS resides in the Computer Software-enterprise group which is currently ranked 20th of out the 197 Industry Groups covered in the paper, placing it in the much preferred top quartile and satisfying the "L" criteria.
After its initial appearance in yellow in the 4/05/07 CANSLIM.net Mid Day Breakouts Report, VOCS had traded up as much as +13.58% at its peak on 4/13/07. There are two encouraging events that have occurred as this stock pulled back. First, volume generally has dried up as this stock pulled back, which is considered a very healthy sign. Second, it has thus far held up above the expected support level near its prior chart highs. Statistically, about 40% of winning stocks pull back and re-test that important chart support level after breaking out, so it is not uncommon for stocks to do exactly what VOCS has done. Of course, it is very important to see the bulls show up and offer support at or above the pivot point. This re-testing period may offer investors a chance to accumulate shares before a stock continues advancing. However, any stock that falls more than 7-8% from your buy point should always be sold to protect your capital from greater erosion. Heavy volume behind losses can be particularly ominous causes for concern, as they could signal institutional distribution, especially if the stock does not find support near its pivot point. As long as VOCS continues trading above its pivot point and above its old chart high closes, the breakout remains intact, and odds still favor further gains.
News Headline of Note: The company, with the help of underwriters, announced on 4/05/07 that it had priced a previously announced follow-on public offering of about 3.05 million shares at $19.50 a share. About 1.8 million shares were being sold by stockholders and about 1.2 million were being offered by the company (read here). The market immediately showed great enthusiasm to the news, which appears to have relieved selling pressure from insiders and also given the company some additional working capital. News that is fundamental in nature often can have a quick impact on share prices, as this example demonstrates.
C A N S L I M | StockTalk | News | Chart | ![]() DGO | SEC | Zacks Reports
DGO | SEC | Zacks Reports
View all notes | Alert me of new notes | CANSLIM.net Company Profile
|
Vocus Inc. |
| |
|
Ticker Symbol: VOCS (NASDAQ) |
Industry Group: Computer Software- Enterprise |
Shares Outstanding: 16,000,000 |
|
Price: $22.05 1:20PM ET |
Day's Volume: 866,600 4/5/2007 1:20PM ET |
Shares in Float: 6,410,000 |
|
52 Week High: $22.11 4/5/2007 1:20PM ET |
50-Day Average Volume: 100,900 |
Up/Down Volume Ratio: 1.1 |
|
Pivot Point: $21.92 |
Pivot Point +5% = Max Buy Price: $23.01 |
Web Address: http://www.vocus.com/ |
C A N S L I M | StockTalk | News | Chart | SEC | Zacks Reports
View all notes | Alert me of new notes | CANSLIM.net Company Profile
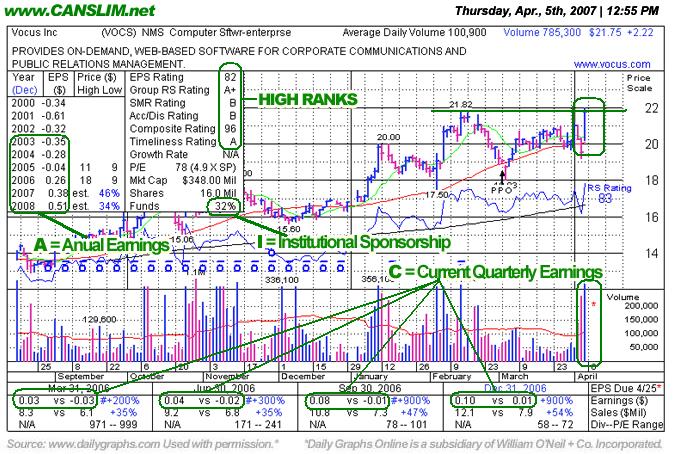
CANSLIM.net Profile: Vocus, Inc. provides on-demand software for public relations management. Its software automates and integrates various functions of public relations, including media relations, news distribution, and news monitoring. The company's public relations management software modules include Contact Management, which allows customers to access a database of journalists, media outlets, and publicity opportunities, as well as to create targeted lists, fax or mail, and track meetings and telephone calls; and Collateral Management that provides a repository to store information, such as media kits, photographs, videos, annual reports, and executive biographies. It also offers Project Management that facilitates organizing press releases, speaking engagements, and publicity events; Newsrooms, which provides access to an organizations news, press releases, digital collateral, grassroots advocacy tools, and other public information for journalists, analysts, and public officials; and PRWeb Online Newswire that distributes news directly to online news sites, and to the public through daily RSS feeds and other social media tools. Email Campaigns, which enables organizations to deliver interactive communications that provide online access to related collateral material, and to track and measure response rates and other campaign metrics; Analytics & Measurement that transforms data about news coverage, public relations activities, and online newsroom statistics into insight about programs and results; and News On-Demand, which monitors news sources to identify and deliver relevant news coverage to customers based on individual criteria. As of December 31, 2006, Vocus served 1,727 customers in financial and insurance, technology, healthcare and pharmaceuticals, and retail and consumer products industries, as well as government agencies, not-for-profit organizations, and educational institutions. The company is headquartered in Lanham, Maryland.
From when it first turned a profitable quarter in the period ending December 31, 2005 its earnings have increased dramatically versus the year earlier in its quarterly comparisons (the "C" criteria) yet the company just turned profitable in 2006 so it lacks the annual earnings history (the "A" guideline) of at least 3-5 years of earnings growth. The "I" criteria is clinched by the number of top rated funds owning an interest rising from 15 funds in March '06 to 27 funds as of December '06, and its bullish price/volume chart action shows that its shares are being accumulated. VOCS is a member of the 16th ranked Computer - Software/Enterprise out of the 197 Industry Groups covered in the paper, easily satsifying the "L" criteria. In addition, the company provides
News Headline of Note: The company, with the help of underwriters, announced today that it had priced a previously announced follow-on public offering of about 3.05 million shares at $19.50 a share. About 1.8 million shares were being sold by stockholders and about 1.2 million were being offered by the company (read here). The market has immediately shown great enthusiasm to this news, which appears to have relieved selling pressure from insiders and also given the company some additional working capital. News that is fundamental in nature often can have a quick impact on share prices, as this example demonstrates.
What to Look For and What to Look Out For: For the best results it is often wise to avoid buying stocks extended beyond guidelines, so be careful not to buy this stock if it surges above its $23.01 maximum buy price. VOCS triggered a technical buy signal when it vaulted above its pivot point on well over the +150% above volume. Look for this stock to continue advancing in the next few days and weeks on heavier volume. Conversely, VOCS rolls over and falls back into its prior base then the recent bullish action will be negated. Any serious reversal and technical breakdown beyond 7-8% from one's purchase price would serve as a decisive technical sell signal.
Technical Analysis: The stock surged above its resistance and its pivot point today on the necessary volume to trigger a technical buy signal. Whenever a stock jumps into new high territory on heavy volume it is a classic sign of heavy institutional buying demand (the "I" criteria). At the time of this writing volume is over 959,300 shares traded on a stock that normally trades about 100,900 shares daily. The breakout to new all-time highs may be the beginning of a substantial and sustained rise, which is why there is always a focus on stocks with very heavy volume behind a meaningful rise in price. Its weekly chart also has bullish characteristics that include several up weeks on above average volume with only one or two down weeks on above average volume.