Fundamental and Technical Deterioration Recently Noted - Tuesday, April 11, 2017
Veritex Holdings Inc (VBTX +$0.02 or +0.07% to $26.98) has been lingering below its 50-day moving average (DMA) line. Subsequent gains above that short-term average are needed for its outlook to improve. It recently undercut the prior low ($26.82 on 3/10/17) raising concerns, but then halted its slide after the weak action triggered a technical sell signal. More damaging losses would raise greater concerns.
VBTX was last shown in this FSU section on 3/08/17 with an annotated graph under the headline, "Hovering Near Highs But Latest Earnings Were Below Guidelines". The deteriorating technical and fundamental characteristics might be a strong enough argument for reducing exposure even when a stock has not fallen more than -7% from an investor's purchase price. That is especially true if broader market conditions erode, since 3 out of 4 stocks tend to follow the direction of the major averages.
The number of top-rated funds owning its shares rose from 18 in Jun '15 to 149 in Mar '17. However, its current Up/Down Volume Ratio of 0.8 is an unbiased indication its shares have been under slight distributional pressure over the past 50 days (I criteria). Its small supply of only 10.7 million shares (S criteria) in the public float can contribute to greater volatility in the event of institutional buying or selling.
Veritex made limited headway after highlighted in yellow with new pivot point cited based on its 12/23/16 high plus 10 cents in the 1/23/17 mid-day report (read here). Disciplined investors will observe that it was noted repeatedly since 1/24/17 - "Reported Dec '16 quarterly earnings +17% on +26% sales revenues, below the +25% minimum guideline (C criteria) for buy candidates, raising fundamental concerns." The prior 12 quarterly comparisons had shown earnings increases versus the year ago period(s) well above the +25% minimum guideline (C criteria). Its annual earnings history (A criteria) has been good, but it has a limited history since its Oct 2014 IPO at $13.
Charts courtesy www.stockcharts.com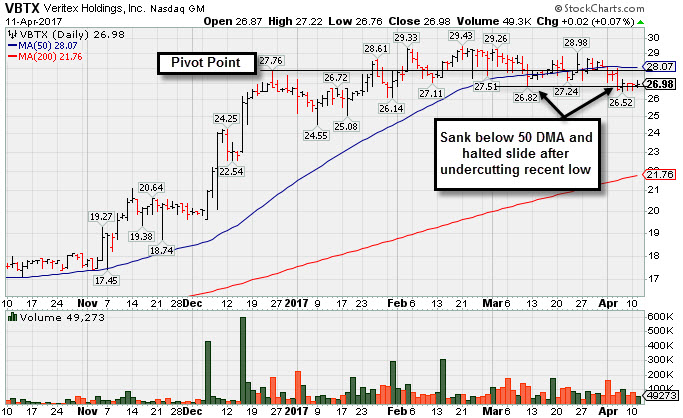
Hovering Near Highs But Latest Earnings Were Below Guidelines - Wednesday, March 8, 2017
Veritex Holdings Inc (VBTX +$0.01 or +0.04% to $28.38) has been stubbornly holding its ground and hovering below its "max buy" level. Prior highs in the $27 area and its 50-day moving average (DMA) line ($27.52) define important near-term support where violations would trigger technical sell signals. VBTX was last shown in this FSU section on 1/23/17 with an annotated graph under the headline, "Challenged Highs But Ended in Bottom Third of Intra-day Range".
It was highlighted in yellow with new pivot point cited based on its 12/23/16 high plus 10 cents in the 1/23/17 mid-day report (read here). However, disciplined investors will observe that it was noted on 1/24/17 - "Reported Dec '16 quarterly earnings +17% on +26% sales revenues, below the +25% minimum guideline (C criteria) for buy candidates, raising fundamental concerns." The prior 12 quarterly comparisons had shown earnings increases versus the year ago period(s) well above the +25% minimum guideline (C criteria). Its annual earnings history (A criteria) has been good, but it has a limited history since its Oct 2014 IPO at $13.
The number of top-rated funds owning its shares rose from 18 in Jun '15 to 135 in Dec '16. Its current Up/Down Volume Ratio of 1.1 is an unbiased indication its shares have been under only slight accumulation over the past 50 days (I criteria). Its small supply of only 10.2 million shares (S criteria) in the public float can contribute to greater volatility in the event of institutional buying or selling.
Charts courtesy www.stockcharts.com
Challenged Highs But Ended in Bottom Third of Intra-day Range - Monday, January 23, 2017
Veritex Holdings Inc (VBTX +$0.08 or +0.30% to $26.50) finished weak after it was highlighted in yellow with new pivot point cited based on its 12/23/16 high plus 10 cents in today's earlier mid-day report (read here). It challenged its all-time high with the session's early gain after a short flat base. Higher volume without meaningful price progress is considered to be a sign of distributional pressure. It is due to report earnings results before the open on Tuesday. Disciplined investors will observe that it was noted - "A gain above the pivot point backed by at least +40% above average volume is needed to trigger a proper technical buy signal. Due to report Dec '16 quarterly earnings, and volume and volatility often increase near earnings news."
VBTX completed a new Public Offering on 12/15/16 and was noted in prior mid-day reports - "Patient investors may watch for a new base or secondary buy point to possibly develop and be noted in the weeks ahead. Reported earnings +35% on +32% sales revenues for the Sep '16 quarter, and its fundamentals remain strong. It went through a long and deep consolidation below its 200 DMA line after dropped from the Featured Stocks list on 1/15/16."
The past 12 quarterly comparisons earnings increases versus the year ago periods were well above the +25% minimum guideline (C criteria). Its annual earnings history (A criteria) has been good, but it has a limited history since its Oct 2014 IPO at $13. VBTX went through a long consolidation since last shown in this FSU section on 1/05/16 with an annotated graph under the headline, "Met Resistance Due to Overhead Supply When Rebounding". Disciplined investors will note that it never produced the necessary gains above its pivot point backed by at least +40% above average volume needed to trigger a technical buy signal. It was highlighted in yellow with pivot point cited based on its 7/08/15 high plus 10 cents in the 11/04/15 mid-day report (read here).
The number of top-rated funds owning its shares rose from 18 in Jun '15 to 107 in Dec '16. Its current Up/Down Volume Ratio of 2.9 is an unbiased indication its shares have been under accumulation over the past 50 days (I criteria). Its small supply of only 10.2 million shares (S criteria) in the public float can contribute to greater volatility in the event of institutional buying or selling.
Charts courtesy www.stockcharts.com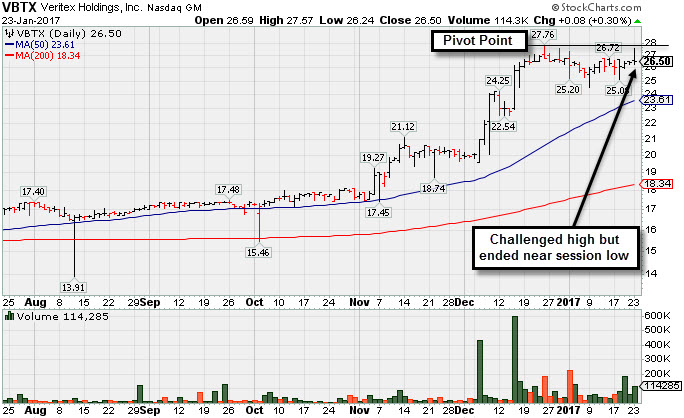
Met Resistance Due to Overhead Supply When Rebounding - Tuesday, January 5, 2016
Veritex Holdings Inc (VBTX +$0.28 or +1.75% to $16.31) met resistance today and ended below its 50-day moving average (DMA) line again after considerable early gains helped it rally from support near its 200 DMA line and prior lows in the $15.50 area. Its color code was changed to yellow as its outlook improved, however, members were reminded - "A volume-driven breakout above its pivot point is still needed to trigger a proper technical buy signal."
VBTX was last shown in this FSU section on 12/24/15 with an annotated graph under the headline, "50-Day Moving Average Acted as Resistance After 200 DMA Test". Disciplined investors will note that it never produced the necessary gains above its pivot point backed by at least +40% above average volume needed to trigger a technical buy signal. It was highlighted in yellow with pivot point cited based on its 7/08/15 high plus 10 cents in the 11/04/15 mid-day report (read here).
The number of top-rated funds owning its shares rose from 18 in Jun '15 to 22 in Sep '15. Its current Up/Down Volume Ratio of 1.4 is an unbiased indication its shares have been under accumulation over the past 50 days (I criteria). Its small supply of only 10.7 million shares (S criteria) in the public float can contribute top greater volatility in the event of institutional buying or selling.
Reported earnings +64% on +31% sales revenue for the Sep '15 quarter and the past 8 quarterly comparisons earnings increases versus the year ago periods well above the +25% minimum guideline (C criteria). Its annual earnings history (A criteria) has been good, but its has a limited history since its Oct 2014 IPO at $13.
Charts courtesy www.stockcharts.com
50-Day Moving Average Acted as Resistance After 200 DMA Test - Thursday, December 24, 2015
Veritex Holdings Inc (VBTX +$0.33 or +2.06% to $16.32) met resistance at its 50-day moving average (DMA) line when rebounding. Recent lows and its 200 DMA line define important near-term support in the $15.50 area where subsequent violations would raise greater concerns. A rebound above the 50 DMA line is needed for its outlook to improve.
VBTX was last shown in this FSU section on 12/10/15 with an annotated graph under the headline, "Finding Support Above 50-Day Moving Average Line", as members were cautioned - "Recently churning above average volume and not making meaningful price progress, a sign of distributional pressure." Disciplined investors will note that it never produced the necessary gains above its pivot point backed by at least +40% above average volume needed to trigger a technical buy signal. It was highlighted in yellow with pivot point cited based on its 7/08/15 high plus 10 cents in the 11/04/15 mid-day report (read here).
The number of top-rated funds owning its shares rose from 18 in Jun '15 to 22 in Sep '15. Its current Up/Down Volume Ratio of 1.6 is an unbiased indication its shares have been under accumulation over the past 50 days (I criteria). Its small supply of only 10.7 million shares (S criteria) in the public float can contribute top greater volatility in the event of institutional buying or selling.
Reported earnings +64% on +31% sales revenue for the Sep '15 quarter and the past 8 quarterly comparisons earnings increases versus the year ago periods well above the +25% minimum guideline (C criteria). Its annual earnings history (A criteria) has been good, but its has a limited history since its Oct 2014 IPO at $13.
Charts courtesy www.stockcharts.com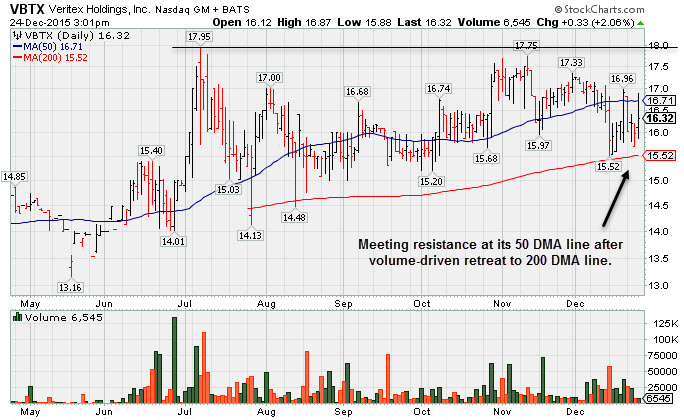
Finding Support Above 50-Day Moving Average Line - Thursday, December 10, 2015
Veritex Holdings Inc (VBTX +$0.19 or +1.14% to $16.80) is consolidating above its 50-day moving average (DMA) line after recently churning above average volume and not making meaningful price progress, a sign of distributional pressure.
VBTX was last shown in this FSU section on 11/20/15 with an annotated graph under the headline, "Found Support This Week Above 50-Day Moving Average". Disciplined investors will note that it still has not produced the necessary gains above its pivot point backed by at least +40% above average volume needed to trigger a technical buy signal. It was highlighted in yellow with pivot point cited based on its 7/08/15 high plus 10 cents in the 11/04/15 mid-day report (read here).
The number of top-rated funds owning its shares rose from 18 in Jun '15 to 22 in Sep '15. Its current Up/Down Volume Ratio of 1.8 is an unbiased indication its shares have been under accumulation over the past 50 days (I criteria). Its small supply of only 10.7 million shares (S criteria) in the public float can contribute top greater volatility in the event of institutional buying or selling.
Reported earnings +64% on +31% sales revenue for the Sep '15 quarter and the past 8 quarterly comparisons earnings increases versus the year ago periods well above the +25% minimum guideline (C criteria). Its annual earnings history (A criteria) has been good, but its has a limited history since its Oct 2014 IPO at $13.
Charts courtesy www.stockcharts.com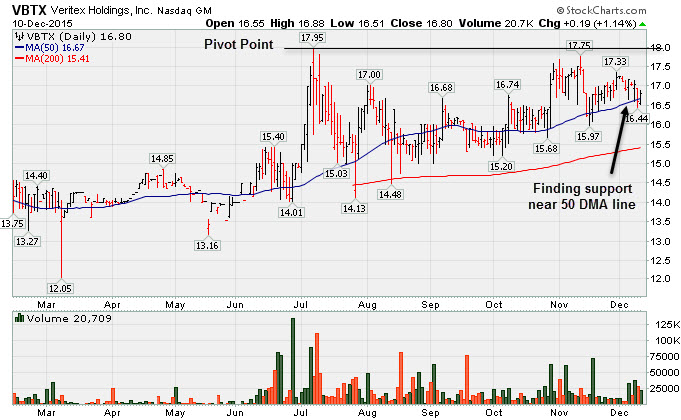
Found Support This Week Above 50-Day Moving Average - Friday, November 20, 2015
Veritex Holdings Inc (VBTX +$0.03 or +0.18% to $16.81) has been sputtering but finding support above its 50-day moving average DMA line ($16.35). Disciplined investors will note that it still has not produced the necessary gains above its pivot point backed by at least +40% above average volume needed to trigger a technical buy signal.
VBTX was last shown in this FSU section on 11/04/15 with an annotated graph under the headline, "Perched Within Striking Distance of Highs in 19-Week Base", was highlighted in yellow with pivot point cited based on its 7/08/15 high plus 10 cents in the earlier mid-day report (read here).
The number of top-rated funds owning its shares rose from 18 in Jun '15 to 22 in Sep '15. Its current Up/Down Volume Ratio of 1.4 is an unbiased indication its shares have been under accumulation over the past 50 days (I criteria). Its small supply of only 10.7 million shares (S criteria) in the public float can contribute top greater volatility in the event of institutional buying or selling.
Reported earnings +64% on +31% sales revenue for the Sep '15 quarter and the past 8 quarterly comparisons earnings increases versus the year ago periods well above the +25% minimum guideline (C criteria). Its annual earnings history (A criteria) has been good, but its has a limited history since its Oct 2014 IPO at $13.
Charts courtesy www.stockcharts.com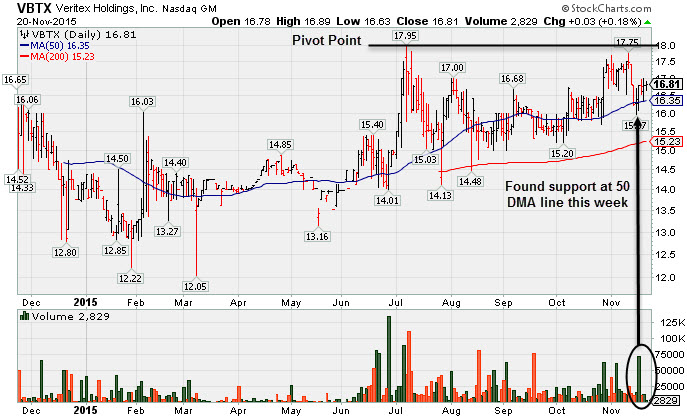
Perched Within Striking Distance of Highs in 19-Week Base - Wednesday, November 4, 2015
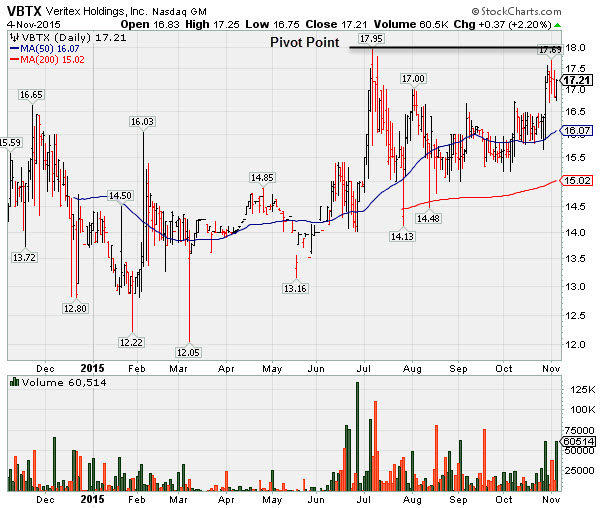
Veritex Holdings Inc (VBTX +$0.37 or +2.20% to $17.21) was highlighted in yellow with pivot point cited based on its 7/08/15 high plus 10 cents in the earlier mid-day report (read here). It is consolidating within striking distance of a new 52-week high (N criteria). Subsequent gains above its pivot point backed by at least +40% above average volume may trigger a technical buy signal. The 200 DMA line recently acted as support.
The number of top-rated funds owning its shares rose from 18 in Jun '15 to 20 in Sep '15. Its current Up/Down Volume Ratio of 1.2 is an unbiased indication its shares have been under slight accumulation over the past 50 days (I criteria). Its small supply of only 10.7 million shares (S criteria) in the public float can contribute top greater volatility in the event of institutional buying or selling.
Reported earnings +64% on +31% sales revenue for the Sep '15 quarter and the past 8 quarterly comparisons earnings increases versus the year ago periods well above the +25% minimum guideline (C criteria). Its annual earnings history (A criteria) has been good, but its has a limited history since its Oct 2014 IPO at $13.
Charts courtesy www.stockcharts.com