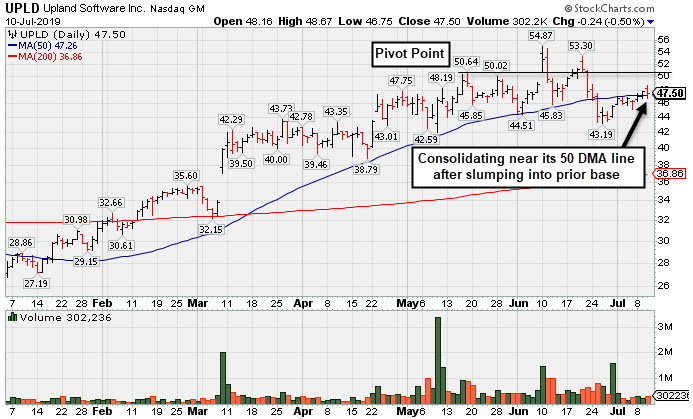
Consolidating Near 50-Day Average After Slump Into Prior Base - Wednesday, July 10, 2019
Upland Software Inc (UPLD-$0.24 or -0.50% to $47.50) is consolidating near its 50-day moving average (DMA) line ($47.26) after slumping back into the prior base. The recent low ($43.19 on 6/26/19) defines important near term support to watch.
It was last shown in this FSU section on 6/10/19 with an annotated graph under the headline, "Rose From an Advanced Ascending Base", after highlighted in yellow in the earlier mid-day report (read here) with pivot point cited based on its 5/17/19 high plus 10 cents after an advanced ascending base. It gapped up with a big volume-driven gain triggering a technical buy signal.
The number of top-rated funds owning its shares rose from 200 in Jun '18 to 243 in Jun '19, a reassuring sign concerning the I criteria. Its current Up/Down Volume Ratio of 1.6 is an unbiased indication its shares have been under accumulation over the past 50 days. It completed a new Public Offering on 5/08/19. Such offerings often hinder price progress for the short-term, yet they usually serve to attract greater institutional interest. It has a small supply of only 24.8 million shares outstanding (S criteria), which can contribute to greater price volatility in the event of institutional buying or selling.
Quarterly comparisons through Mar '19 have shown impressive sales revenues growth and greatly improved earnings increases above the +25% minimum guideline (C criteria). After years of losses it had a profitable FY '16 and strong annual earnings (A criteria) growth. That helps it better match with the fact-based investment system's fundamental guidelines calling for 3-5 years of strong and steady earnings growth.
Charts used courtesy of www.stockcharts.com
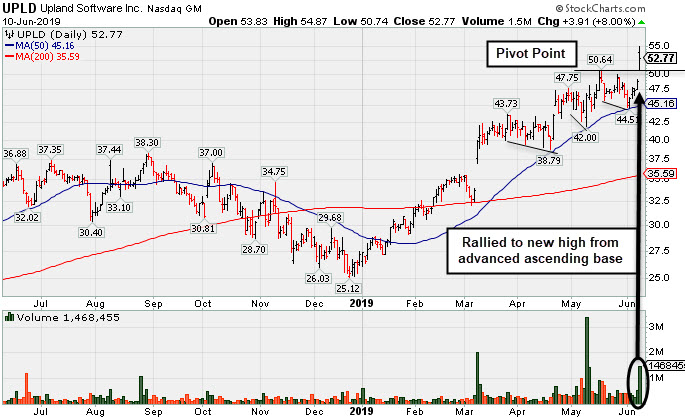
Rose From an Advanced Ascending Base - Monday, June 10, 2019
Upland Software Inc (UPLD +$3.91 or +8.00% to $52.77) was highlighted in yellow in the earlier mid-day report (read here) with pivot point cited based on its 5/17/19 high plus 10 cents after an advanced ascending base. It gapped up today with a big volume-driven gain triggering a technical buy signal. It found support above its 50-day moving average (DMA) line ($45.17) during the recent consolidation.
The number of top-rated funds owning its shares rose from 200 in Jun '18 to 247 in Mar '19, a reassuring sign concerning the I criteria. Its current Up/Down Volume Ratio of 2.0 is an unbiased indication its shares have been under accumulation over the past 50 days. It completed a new Public Offering on 5/08/19. Such offerings often hinder price progress for the short-term, yet they usually serve to attract greater institutional interest. It has a small supply of only 24.8 million shares outstanding (S criteria), which can contribute to greater price volatility in the event of institutional buying or selling.
Quarterly comparisons through Mar '19 have shown impressive sales revenues growth and greatly improved earnings increases above the +25% minimum guideline (C criteria). After years of losses it had a profitable FY '16 and strong annual earnings (A criteria) growth. That helps it better match with the fact-based investment system's fundamental guidelines calling for 3-5 years of strong and steady earnings growth.
Charts used courtesy of www.stockcharts.com