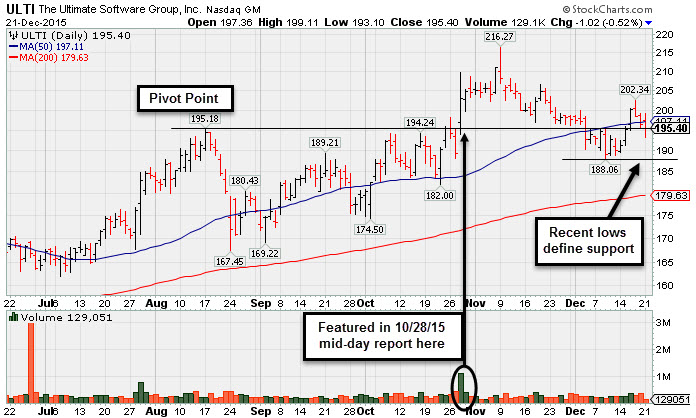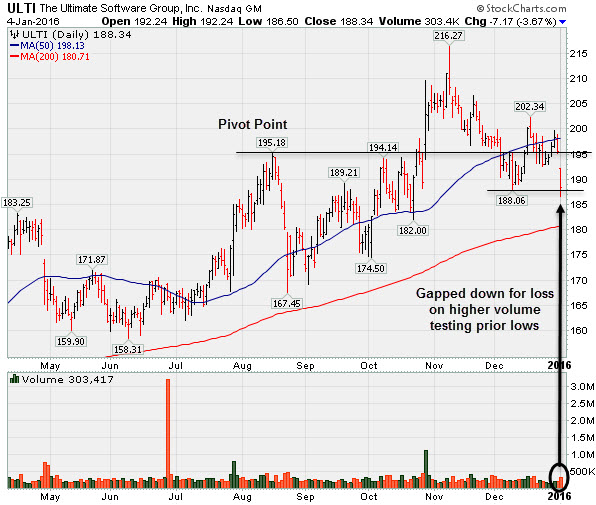
Ultimate Software Group (ULTI -$7.17 or -3.67% to $188.34) gapped down today after meeting resistance at its 50-day moving average (DMA) line while trying to rebound. A rally back above the 50 DMA line is needed for its outlook to improve. ULTI was last shown in this FSU section on 12/21/15 with an annotated graph under the headline, "Slumped Back Below 50-Day Moving Average Line Raising Concerns". It was then noted - "Subsequent deterioration below recent lows ($188) would raise greater concerns."
Following its breakout with powerful volume in late October it soon stalled. It was highlighted in yellow with pivot point cited based on its 8/17/15 high plus 10 cents in the 10/28/15 mid-day report (read here). The strong close above the pivot point had clinched a technical buy signal.
ULTI reported earnings +38% on +22% sales revenues for the Sep '15 quarter. In 7 of the past 8 quarterly comparisons it showed earnings increases above the +25% minimum guideline (C criteria). Earnings rose +47%, +35%, +25%, +26%, +11%, +35%, and +38% in the Mar, Jun, Sep, Dec '14, Mar, Jun and Sep '15 quarters, respectively. Sales revenues rose +24%, +25%, +24%, +21%, +20%, +21%, and +22% during the same span. Annual earnings (A criteria) history has been strong and steady.
The number of top-rated funds owning its shares rose from 497 in Dec '14 to 524 in Sep '15, a reassuring sign (I criteria). Its small supply (S criteria) of only 28.7 million shares outstanding can contribute to greater volatility in the event of institutional buying or selling. Its current Up/Down Volume Ratio of 0.9 its an unbiased indication its shares have been under slight distributional pressure over the past 50 days.
Ultimate Software Group (ULTI -$1.02 or -0.52% to $195.40) has been slumping back below its 50-day moving average (DMA) line raising concerns again and its color code was changed to green. Subsequent deterioration below recent lows ($188) would raise greater concerns. ULTI was last shown in this FSU section on 12/04/15 with an annotated graph under the headline, "Volume Light But Slump Below 50-Day Average Raised Concerns". It was noted - "Violations triggered a technical sell signal, however the lighter than average volume total suggested that there was not a great deal of selling pressure coming from the institutional crowd. More damaging losses may raise greater concerns. Meanwhile, only a prompt rebound above the 50 DMA line would help its outlook improve."
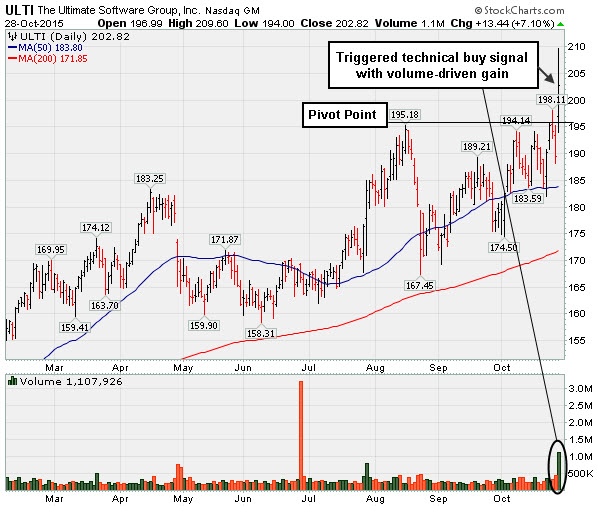
Volume totals suggested that few investors were headed to the exit following its breakout with powerful volume in late October. It was highlighted in yellow with pivot point cited based on its 8/17/15 high plus 10 cents in the 10/28/15 mid-day report (read here). The strong close above the pivot point clinched a technical buy signal.
ULTI reported earnings +38% on +22% sales revenues for the Sep '15 quarter. In 7 of the past 8 quarterly comparisons it showed earnings increases above the +25% minimum guideline (C criteria). Earnings rose +47%, +35%, +25%, +26%, +11%, +35%, and +38% in the Mar, Jun, Sep, Dec '14, Mar, Jun and Sep '15 quarters, respectively. Sales revenues rose +24%, +25%, +24%, +21%, +20%, +21%, and +22% during the same span. Annual earnings (A criteria) history has been strong and steady.
The number of top-rated funds owning its shares rose from 497 in Dec '14 to 536 in Sep '15, a reassuring sign (I criteria). Its small supply (S criteria) of only 28.7 million shares outstanding can contribute to greater volatility in the event of institutional buying or selling. Its current Up/Down Volume Ratio of 0.8 its an unbiased indication its shares have been under distributional pressure over the past 50 days.
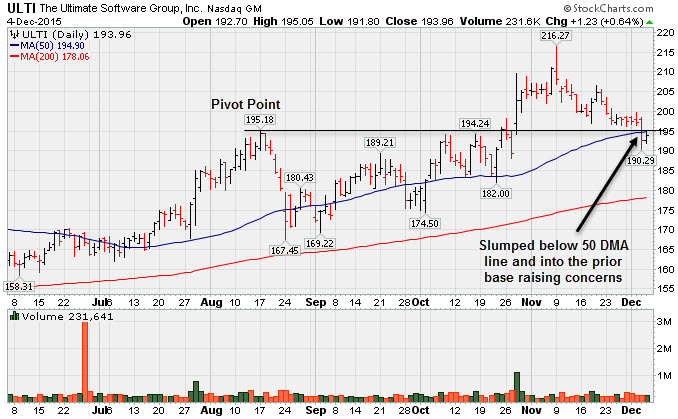
Ultimate Software Group (ULTI +$1.20 or +0.62% to $193.95) halted its slide and posted a small gain today on even lighter volume. On the prior session it quietly slumped below prior highs in the $195 area defining support along with its 50-day moving average (DMA) line ($194.90). Thursday's violations triggered a technical sell signal, however the lighter than average volume total suggested that there was not a great deal of selling pressure coming from the institutional crowd. More damaging losses may raise greater concerns. Meanwhile, only a prompt rebound above the 50 DMA line would help its outlook improve.
ULTI was last shown in this FSU section on 11/16/15 with a annotated graph under the headline, "Following Big Breakout Volume Totals Have Cooled". Volume totals suggested that few investors were headed to the exit following its breakout with powerful volume in late October. It was highlighted in yellow with pivot point cited based on its 8/17/15 high plus 10 cents in the 10/28/15 mid-day report (read here). The strong close above the pivot point clinched a technical buy signal.
ULTI reported earnings +38% on +22% sales revenues for the Sep '15 quarter. In 7 of the past 8 quarterly comparisons it showed earnings increases above the +25% minimum guideline (C criteria). Earnings rose +47%, +35%, +25%, +26%, +11%, +35%, and +38% in the Mar, Jun, Sep, Dec '14, Mar, Jun and Sep '15 quarters, respectively. Sales revenues rose +24%, +25%, +24%, +21%, +20%, +21%, and +22% during the same span. Annual earnings (A criteria) history has been strong and steady.
The number of top-rated funds owning its shares rose from 497 in Dec '14 to 537 in Sep '15, a reassuring sign (I criteria). Its small supply (S criteria) of only 28.7 million shares outstanding can contribute to greater volatility in the event of institutional buying or selling.
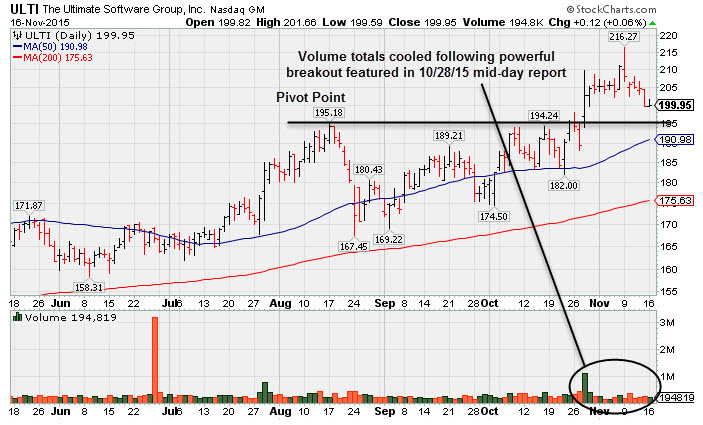
Ultimate Software Group (ULTI +$0.12 or +0.06% to $199.95) is quietly consolidating below its "max buy" level. Prior highs in the $195 area define initial support to watch on pullbacks. Lower than average volume totals suggest that few investors have headed to the exit following its breakout with powerful volume in late October.
ULTI was last shown in this FSU section on 10/28/15 with a annotated graph under the headline, "Technical Breakout Backed By Heavy Volume", when it gapped up and rallied to a new 52-week high with volume +347% above average. It was highlighted in yellow with pivot point cited based on its 8/17/15 high plus 10 cents in the earlier mid-day report (read here). The strong close above the pivot point clinched a technical buy signal.
ULTI reported earnings +38% on +22% sales revenues for the Sep '15 quarter. In 7 of the past 8 quarterly comparisons it showed earnings increases above the +25% minimum guideline (C criteria). Earnings rose +47%, +35%, +25%, +26%, +11%, +35%, and +38% in the Mar, Jun, Sep, Dec '14, Mar, Jun and Sep '15 quarters, respectively. Sales revenues rose +24%, +25%, +24%, +21%, +20%, +21%, and +22% during the same span. Annual earnings (A criteria) history has been strong and steady.
The number of top-rated funds owning its shares rose from 497 in Dec '14 to 532 in Sep '15, a reassuring sign (I criteria). Its small supply (S criteria) of only 28.7 million shares outstanding can contribute to greater volatility in the event of institutional buying or selling.
ULTI reported earnings +38% on +22% sales revenues for the Sep '15 quarter. In 7 of the past 8 quarterly comparisons it showed earnings increases above the +25% minimum guideline (C criteria). Earnings rose +47%, +35%, +25%, +26%, +11%, +35%, and +38% in the Mar, Jun, Sep, Dec '14, Mar, Jun and Sep '15 quarters, respectively. Sales revenues rose +24%, +25%, +24%, +21%, +20%, +21%, and +22% during the same span. Annual earnings (A criteria) history has been strong and steady.
The number of top-rated funds owning its shares rose from 497 in Dec '14 to 531 in Sep '15, a reassuring sign (I criteria). Its small supply (S criteria) of only 28.6 million shares outstanding can contribute to greater volatility in the event of institutional buying or selling.
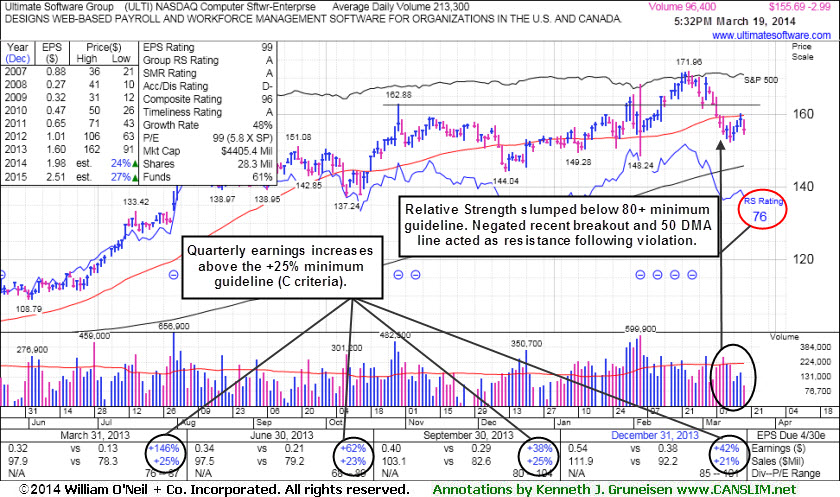
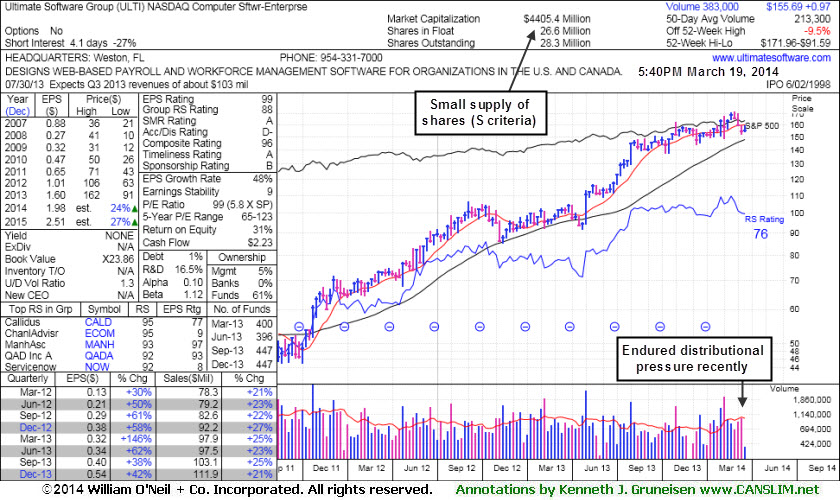
Ultimate Software Group (ULTI -$2.99 or -1.88% to $155.69) encountered resistance at its 50-day moving average (DMA) line. A rebound above that important short-term average would help its outlook improve. It posted light volume gains following damaging losses which led to a slump back into its prior base. Meanwhile, the Relative Strength rating has slumped to 76, below the 80+ minimum guideline for buy candidates.
ULTI was in healthier shape when last shown in this FSU section on 3/04/14 with annotated graphs under the headline, "Near 52--Week High Following Another Volume-Driven Gain". It found support above its 50-day moving average (DMA) line following a worrisome "negative reversal" on 2/05/14, but the latest slump below the 50 DMA line has not been met with such a prompt show of resilience.
Fundamentals remain strong after solid Dec '13 earnings up +42% on +21% sales revenues, continuing its strong earnings history satisfying the C and A criteria. The Computer Software - Enterprise firm saw the number of top-rated funds owning its shares rise from 396 in Jun '13 to 447 funds as of Dec '13, a reassuring trend in place concerning the I criteria. Its small supply of only 26.6 million shares (S criteria) in the public float can contribute to greater price volatility in the event of institutional buying or selling. Disciplined investors avoid chasing stocks extended more than +5% above prior highs and always limit losses by selling if any stock falls more than -7% from their purchase price. Any stock that is sold can always be bought again if strength returns.
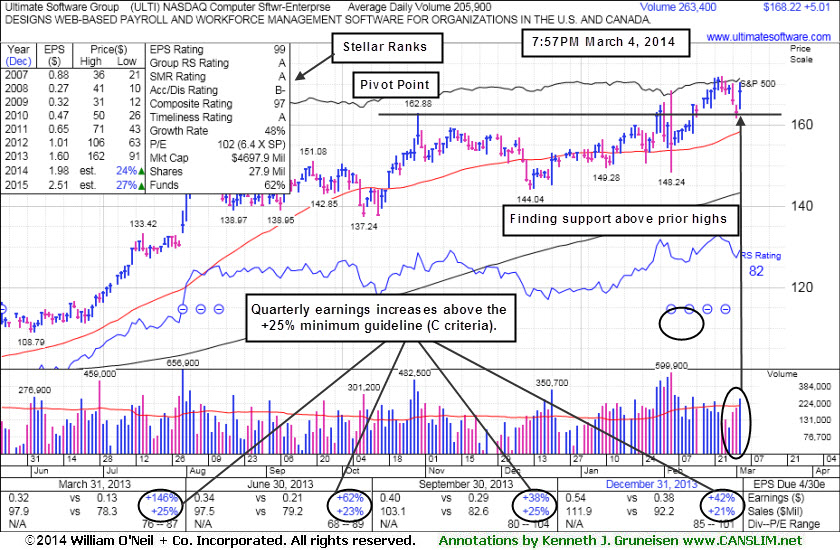
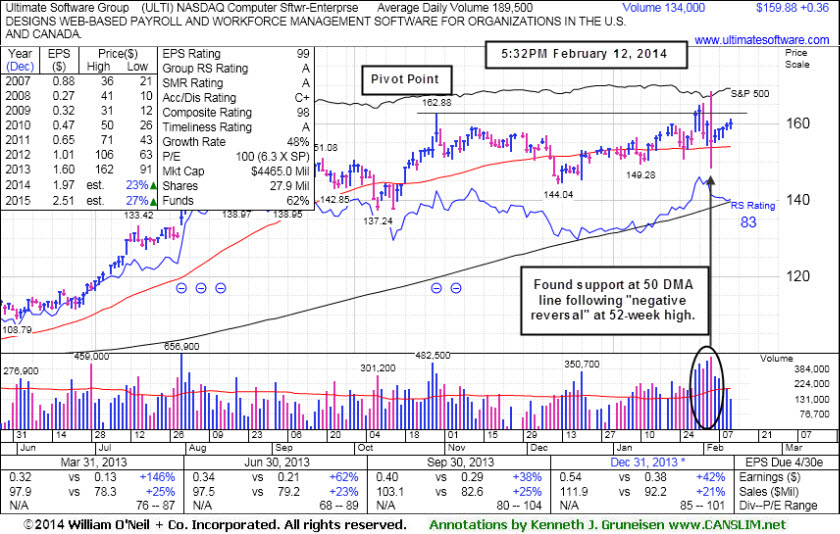
Ultimate Software Group (ULTI +$5.01 or +3.07 to $168.22 is perched near its all-time high stubbornly holding its ground after recently wedging higher with gains lacking great volume conviction. It is still trading below its "max buy" level. It found support above its 50-day moving average (DMA) line following a worrisome "negative reversal" on 2/05/14. It was last shown in this FSU section on 2/12/14 with annotated graphs under the headline, "Stalled and Encountering Distributional Pressure", holding its ground following a "negative reversal" on 2/05/14 and an earlier negative reversal on 2/03/14.
Fundamentals remain strong after solid Dec '13 earnings up +42% on +21% sales revenues, continuing its strong earnings history satisfying the C and A criteria. The Computer Software - Enterprise firm's Relative Strength rating of 82 now, above 80+ minimum level for buy candidates. The number of top-rated funds owning its shares rose from 395 in Dec '12 to 446 funds as of Dec '13, a reassuring trend in place concerning the I criteria. Its small supply of only 26.3 million shares (S criteria) in the public float can contribute to greater price volatility in the event of institutional buying or selling. Disciplined investors avoid chasing stocks extended more than +5% above prior highs and always limit losses by selling if any stock falls more than -7% from their purchase price.
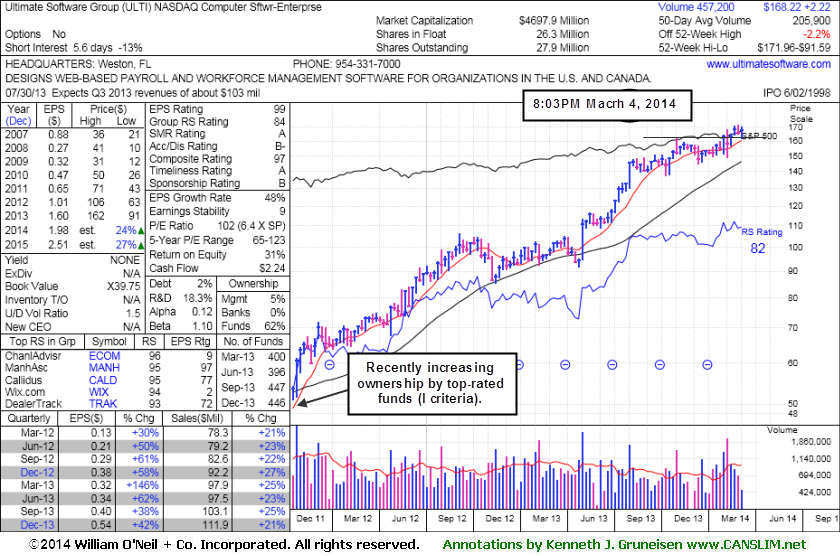
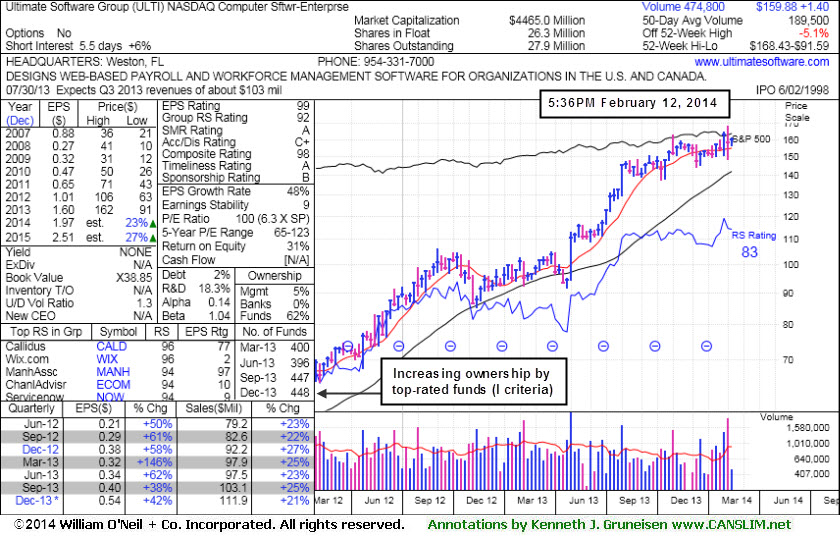
The Computer Software - Enterprise firm's Relative Strength rating of 83 now, above 80+ minimum level for buy candidates. The number of top-rated funds owning its shares rose from 395 in Dec '12 to 448 funds as of Dec '13, a reassuring trend in place concerning the I criteria. Its small supply of only 26.3 million shares (S criteria) in the public float can contribute to greater price volatility in the event of institutional buying or selling. Disciplined investors avoid chasing stocks extended more than +5% above prior highs and always limit losses by selling if any stock falls more than -7% from their purchase price.
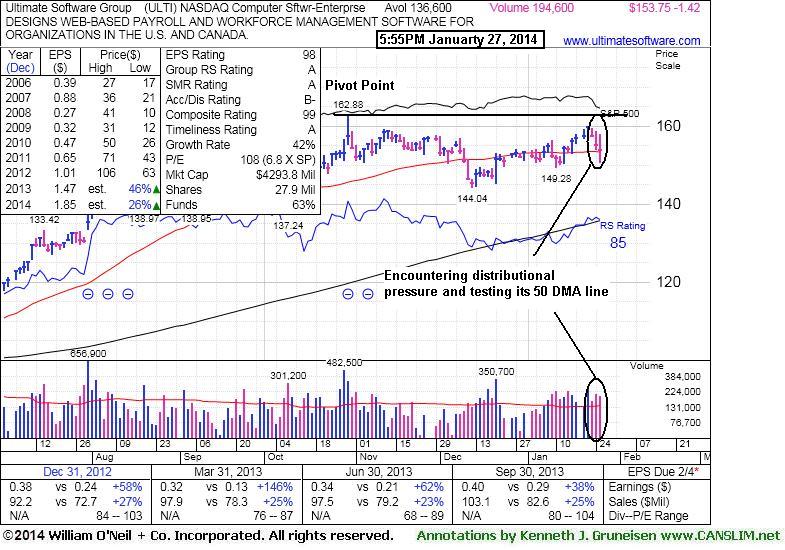
Ultimate Software Group (ULTI -$1.42 or +0.92% to $153.75) has recently been encountering distributional pressure while testing support at its 50-day moving average (DMA) line. A new pivot point has been cited based on its 10/30/13 high plus 10 cents. Subsequent volume-driven gains above the pivot point are needed to trigger a proper new technical buy signal. Meanwhile, deterioration below the 50 DMA line would raise concerns and hurt its outlook.
The company is due to report 2013 fourth quarter and year-end financial results after 4:00PM on February 4, 2014. Keep in mind that volume and volatility often increase near earnings news. Its last appearance in this FSU section was on 12/26/13 under the headline, "Gain on Light Volume While Inching Above 50-Day Average", when a finish just above its 50-day moving average (DMA) line helped its technical stance improve.
The Computer Software - Enterprise firm's Relative Strength rating of 85 now, above 80+ minimum level for buy candidates. Subsequent deterioration below its recent low ($144.04 on 12/12/13) would raise serious concerns and trigger more worrisome technical sell signals.
It made limited headway since highlighted in yellow with pivot point cited based on its 9/19/13 high plus 10 cents in the mid-day report on 10/16/13 (read here). Since then it reported earnings +38% on +25% sales revenues for the Sep '13 quarter, continuing its strong earnings history satisfying the C and A criteria. The number of top-rated funds owning its shares rose from 395 in Dec '12 to 446 funds as of Dec '13, a reassuring trend in place concerning the I criteria. Its small supply of only 26.3 million shares (S criteria) in the public float can contribute to greater price volatility in the event of institutional buying or selling. Disciplined investors avoid chasing stocks extended more than +5% above prior highs and always limit losses by selling if any stock falls more than -7% from their purchase price.
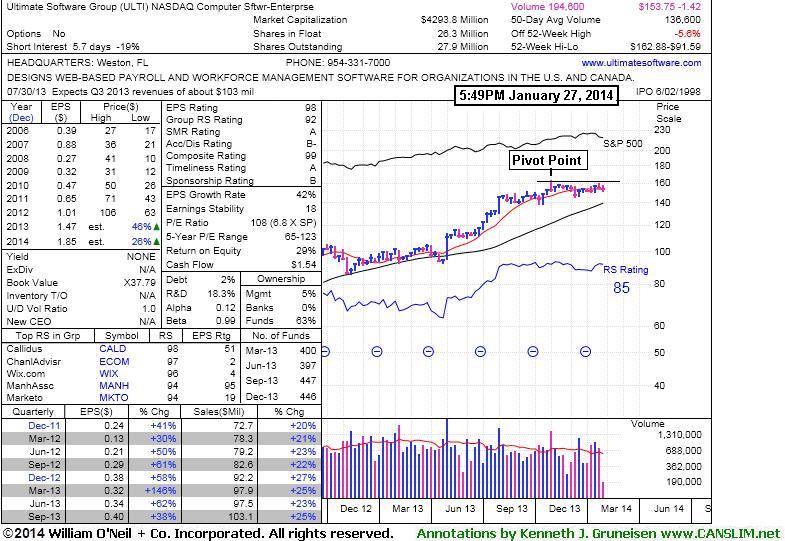
It made limited headway since highlighted in yellow with pivot point cited based on its 9/19/13 high plus 10 cents in the mid-day report on 10/16/13 (read here). Since then it reported earnings +38% on +25% sales revenues for the Sep '13 quarter, continuing its strong earnings history satisfying the C and A criteria. The number of top-rated funds owning its shares rose from 395 in Dec '12 to 448 funds as of Sep '13, a reassuring trend in place concerning the I criteria. Its current Up/Down Volume Ratio of 1.7 is an unbiased indication its shares have been under accumulation over the past 50 days. Its small supply of only 26.2 million shares (S criteria) in the public float can contribute to greater price volatility in the event of institutional buying or selling. Disciplined investors avoid chasing stocks extended more than +5% above prior highs and always limit losses by selling if any stock falls more than -7% from their purchase price.
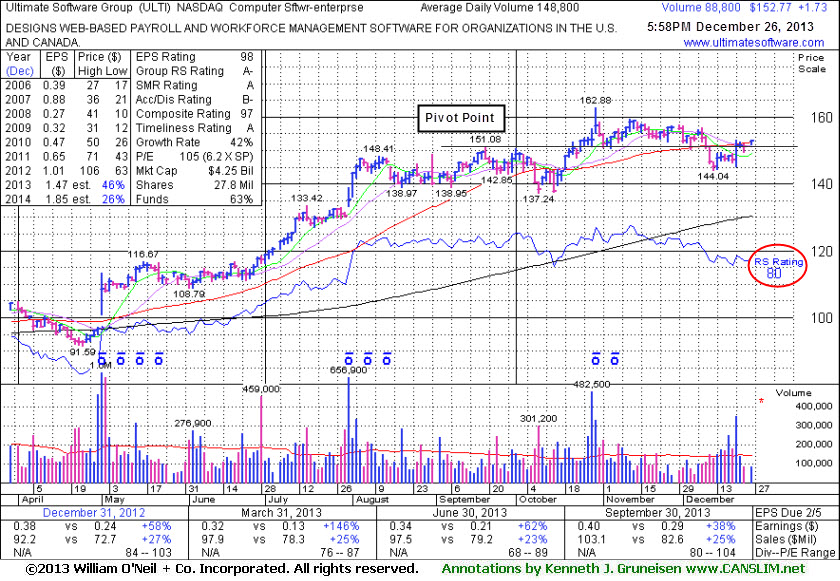
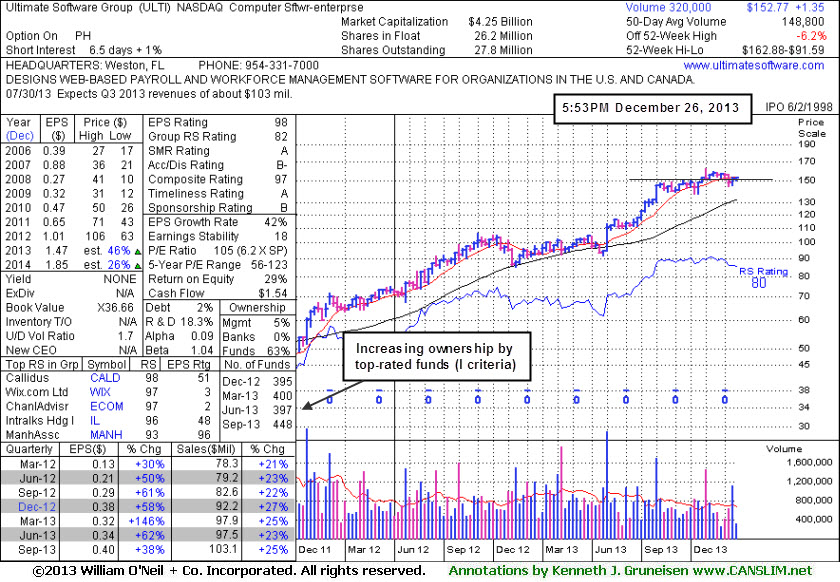
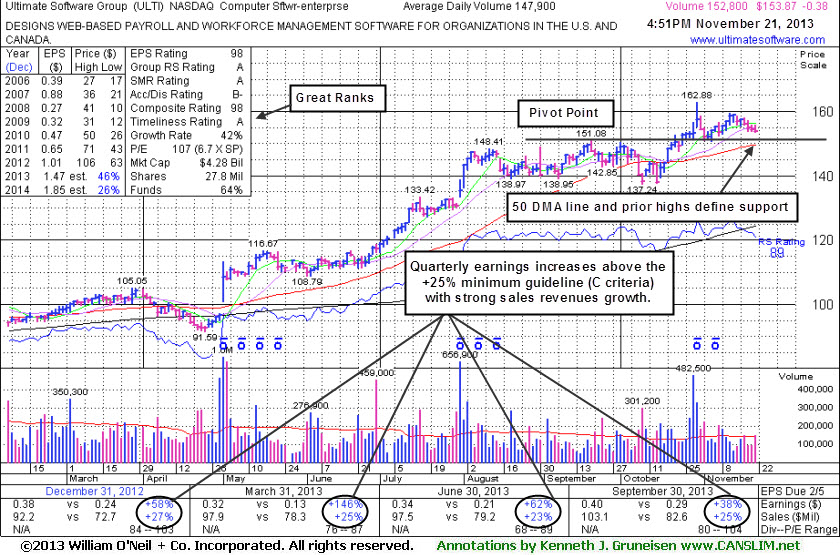
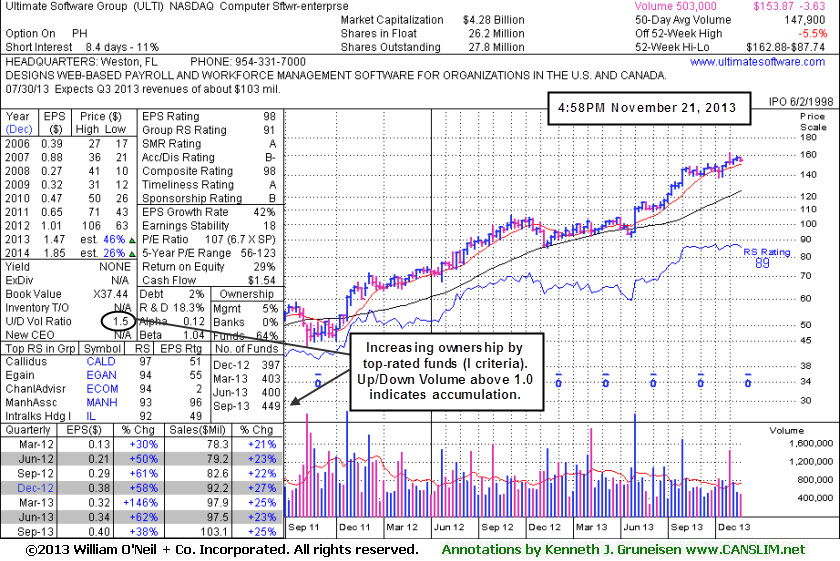
Ultimate Software Group (ULTI -$0.38 or -0.25% to $153.87) has seen its volume totals generally cooling in recent weeks while it has been holding its ground near its 52-week high yet below its "max buy" level. Lighter volume totals while hovering near its highs suggests that few investors have been headed for the exit, however its Relative Strength has been waning recently. Its 50-day moving average (DMA) line and prior highs in the $151 area define important near-term support to watch on pullbacks where subsequent violations would raise concerns and trigger technical sell signals.
Its last appearance in this FSU section was on 10/17/13 under the headline, "Hovering Less Than -5% From 52-Week High", after highlighted in yellow with pivot point cited based on its 9/19/13 high plus 10 cents in the mid-day report on 10/16/13 (read here). Since then it reported earnings +38% on +25% sales revenues for the Sep '13 quarter, continuing its strong earnings history satisfying the C and A criteria. The number of top-rated funds owning its shares rose from 258 in Sep '11 to 449 funds as of Sep '13, a very reassuring trend in place concerning the I criteria. Its current Up/Down Volume Ratio of 1.5 is an unbiased indication its shares have been under accumulation over the past 50 days. Its small supply of only 26.2 million shares (S criteria) in the public float can contribute to greater price volatility in the event of institutional buying or selling. Disciplined investors avoid chasing stocks extended more than +5% above prior highs and always limit losses by selling if any stock falls more than -7% from their purchase price.
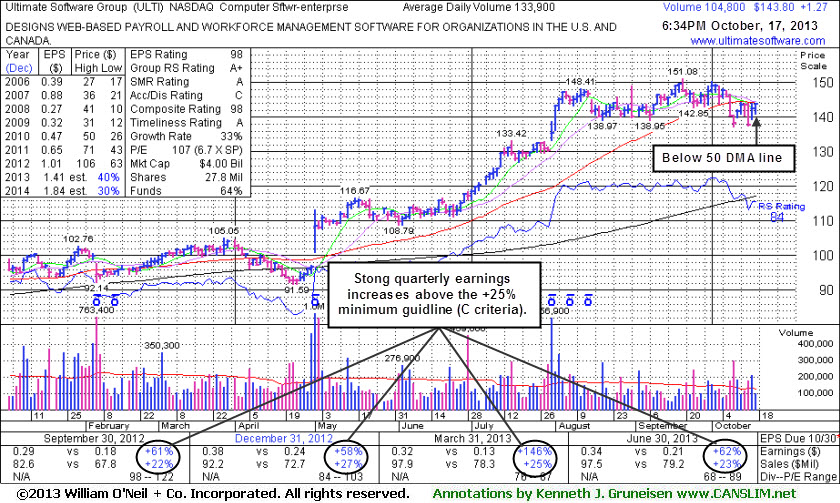
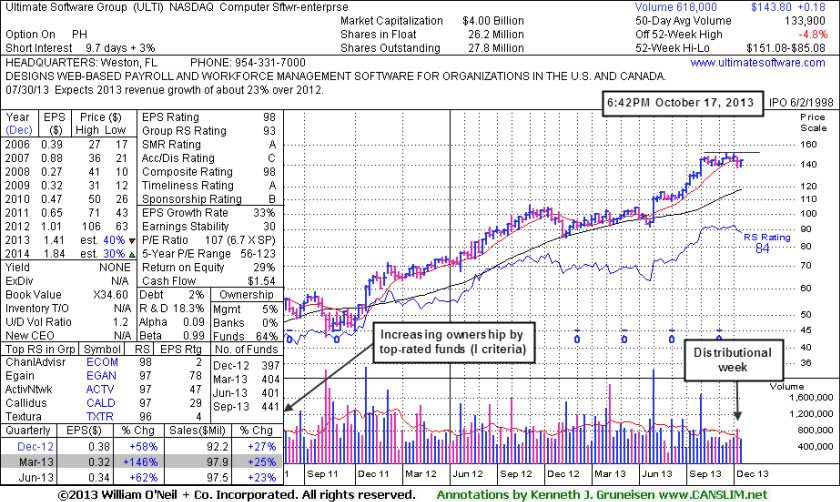
Ultimate Software Group (ULTI +$1.27 or +0.89% to $143.80) was highlighted in yellow with pivot point cited based on its 9/19/13 high plus 10 cents in the mid-day report on 10/16/13 (read here). It has been encountering recent distributional pressure yet finding support near prior lows in the $138 area. Subsequent volume-driven gains above the pivot point may trigger a technical buy signal. Disciplined investors know that it is criitical to see fresh proof of institutional buying demand before any new buying efforts may be justified. First, gains above its 50-day moving average (DMA) line ($144.20) are needed to help its outlook and technical stance improve, meanwhile that short-term average has recently been acting as resistance. The longer any stock lingers below that short-term average the worse its outlook gets.
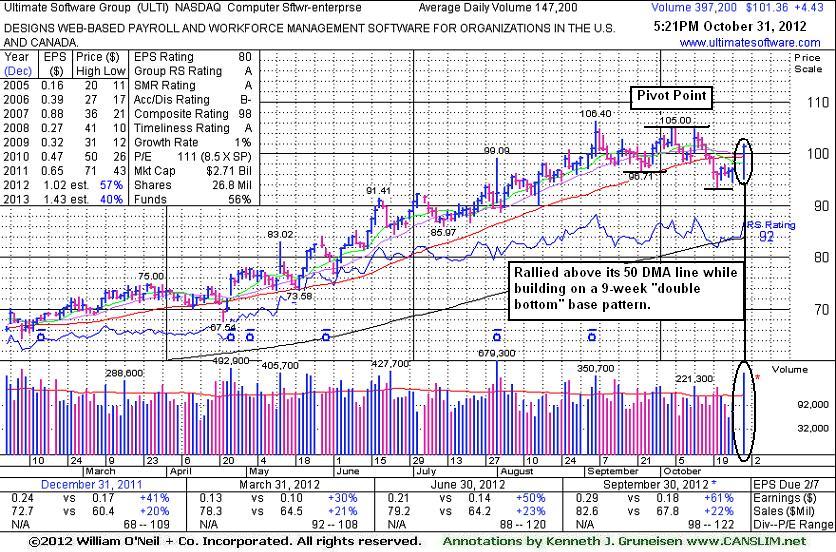
Its last appearance in this FSU section was on 10/31/12 under the headline, "Following Strong Quarterly Results it Rallied Above 50-Day Moving Average". Prior reports noted - "Reported earnings +62% on +23% sales revenues for the Jun '13 quarter, continuing its strong earnings history satisfying the C and A criteria. Found support near its 200 DMA line then rebounded during its orderly consolidation since dropped from the Featured Stocks list on 11/07/12." Quarterly earnings increases have been above the +25% guideline (C criteria) and its annual earnings (A criteria) have been steadily improving since a downturn in FY '08. The number of top-rated funds owning its shares rose from 258 in Sep '11 to 441 funds as of Sep '13, a very reasuring trend in place concerning the I criteria.
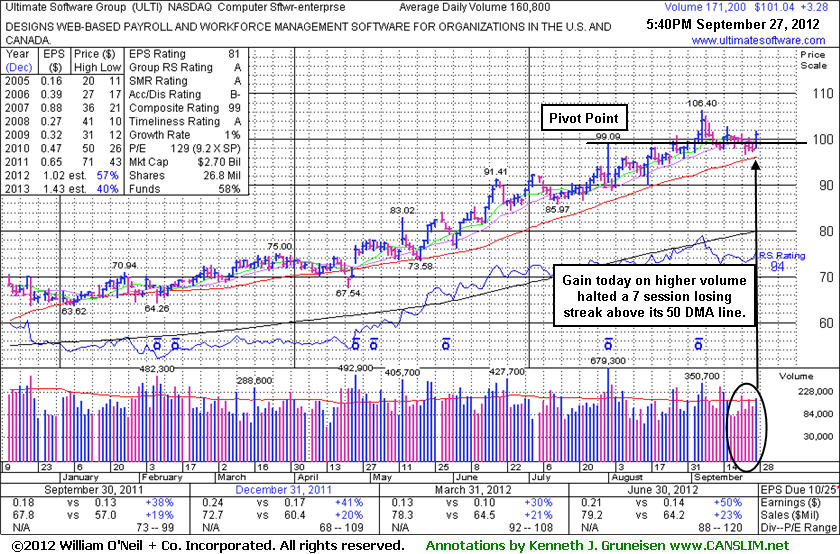
It was last shown in this FSU section on 9/27/12 with an annotated graph under the headline, "Halted 7-Session Losing Streak With Gain on Higher Volume". It promptly halted its slide after more recently undercutting prior lows in the $96 area and violating its 50 DMA line triggering technical sell signals. Quarterly earnings increases have been above the +25% guideline (C criteria) and its annual earnings (A criteria) have been steadily improving since a downturn in FY '08. The number of top-rated funds owning its shares rose from 258 in Sep '11 to 336 in Sep '12, a reassuring sign concerning the I criteria.
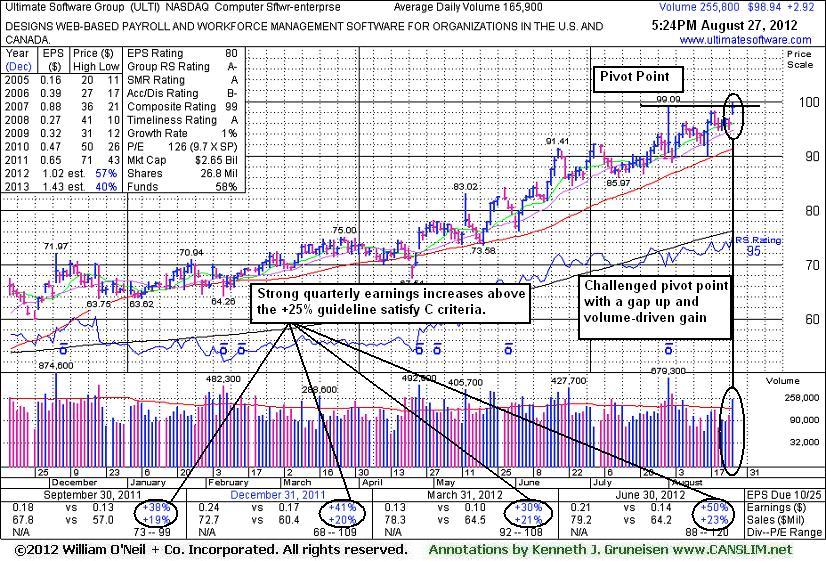
ULTI was highlighted in yellow in the 8/27/12 mid-day report with pivot point cited based on its 8/01/12 high plus 10 cents (read here). It was last shown in this FSU section on 8/27/12 with an annotated graph under the headline, "Institutional Interest Increasing in Software Firm", while tallying a gain backed by +54% above average volume, however it did not clinch a technical buy signal as it finished the session below its pivot point. Subsequent volume-driven gains confirmed a technical buy signal.
Quarterly earnings increases have been above the +25% guideline (C criteria) and its annual earnings (A criteria) have been steadily improving since a downturn in FY '08. The number of top-rated funds owning its shares rose from 258 in Sep '11 to 318 in Jun '12, a reassuring sign concerning the I criteria. Its Up/Down Volume Ratio of 1.2 also offers an unbiased indication that its shares have been under modest accumulation over the past 50 days.
Often, when a leading stock is setting up to breakout of a solid base it is highlighted in CANSLIM.net's Mid-Day Breakouts Report. The most relevant factors are noted in the report which alerts prudent CANSLIM oriented investors to place the issue in their watch list. After doing any necessary backup research, the investor is prepared to act after the stock triggers a technical buy signal (breaks above its pivot point on more than +50% average turnover) but before it gets too extended from a sound base. In the event the stock fails to trigger a technical buy signal and its price declines then it will simply be removed from the watch list. Disciplined investors know to buy as near as possible to the pivot point and avoid chasing stocks after they have rallied more than +5% above their pivot point. It is crucial to always limit losses whenever any stock heads the wrong direction, and disciplined investors sell if a struggling stock ever falls more than -7% from their purchase price.
Ultimate Software Group (ULTI +$2.92 or +3.04% to $98.94) gapped up and touched a new 52-week high today while tallying a gain backed by +54% above average volume, however it did not clinch a technical buy signal as it finished the session below its pivot point. It was highlighted in yellow with pivot point cited based on its 8/01/12 high plus 10 cents in the earlier mid-day report (read here). It found support above its 50-day moving average (DMA) line during its brief "square box" base. A volume-driven gain and strong close above its pivot point may trigger technical buy signal.
Quarterly earnings increases have been above the +25% guideline (C criteria) and its annual earnings (A criteria) have been steadily improving since a downturn in FY '08. The number of top-rated funds owning its shares rose from 258 in Sep '11 to 318 in Jun '12, a reassuring sign concerning the I criteria. Its Up/Down Volume Ratio of 1.6 also offers an unbiased indication that its shares have been under accumulation over the past 50 days.