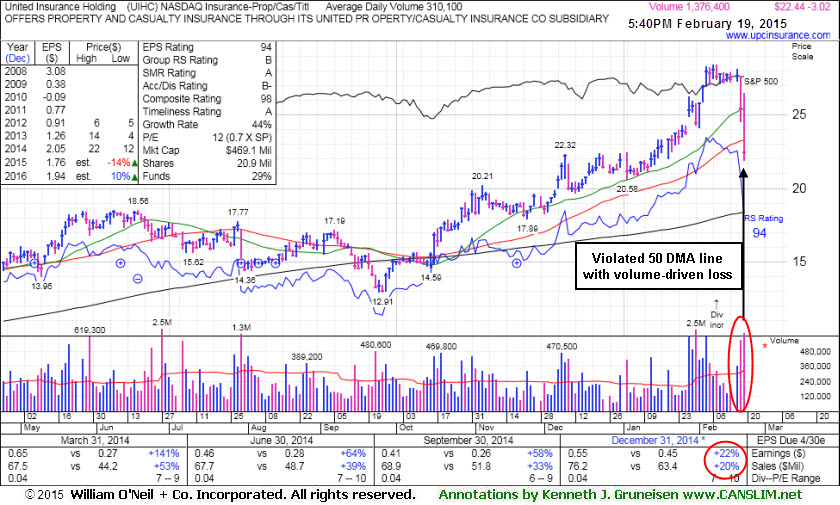
United Insurance Holding (UIHC -$3.02 or -11.86% to $22.44) violated its 50-day moving average (DMA) line and triggered a technical sell signal. Today's 2nd consecutive volume-driven loss was noted as action indicative of distributional pressure. It reported earnings +22% on +20% sales revenues for the Dec '14 quarter, below the +25% minimum earnings guideline (C criteria), raising fundamental concerns.
UIHC traded up as much as +30.63% since first highlighted in yellow at $20.64 with pivot point cited based on its 11/05/14 high plus 10 cents in the 12/05/14 mid-day report (read here). It was last shown in this FSU section on 1/29/15 with annotated graphs under the headline, "Extended After Tallying More Volume-Driven Gains".
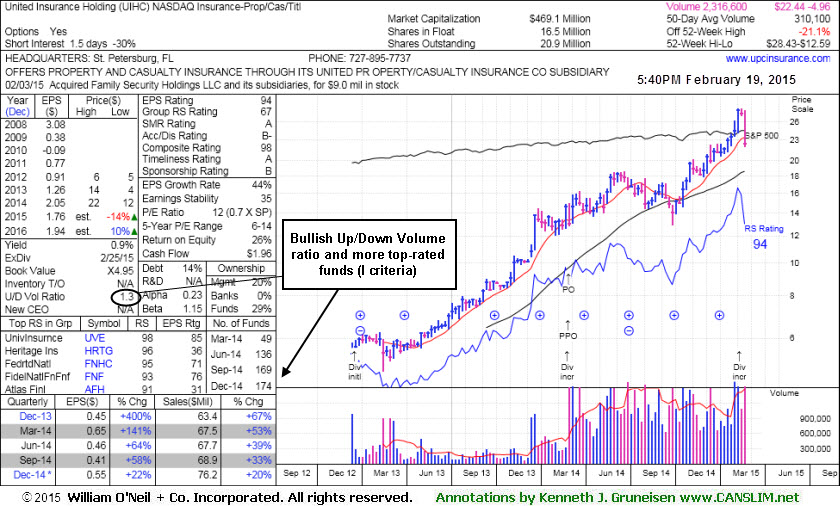
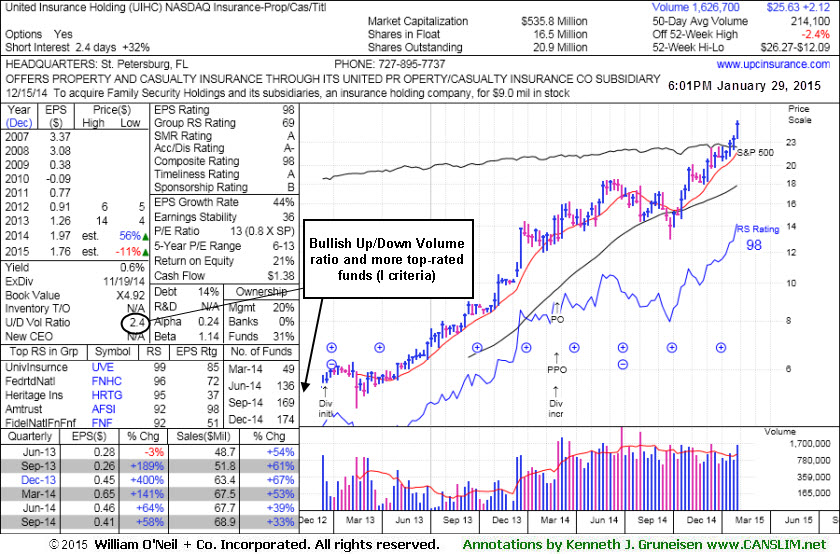
Annual earnings (A criteria) have been strong. It completed a new Public Offering on 2/27/14. The number of top-rated funds owning its shares rose from 30 in Dec '13 to 174 in Dec '14. Its current Up/Down Volume Ratio of 1.3 still hints that its shares have been under accumulation over the past 50 days. Still, disciplined investors might consider looking for a fresh buy candidate without flaws developing with respect to the fact-based investment system's guidelines.
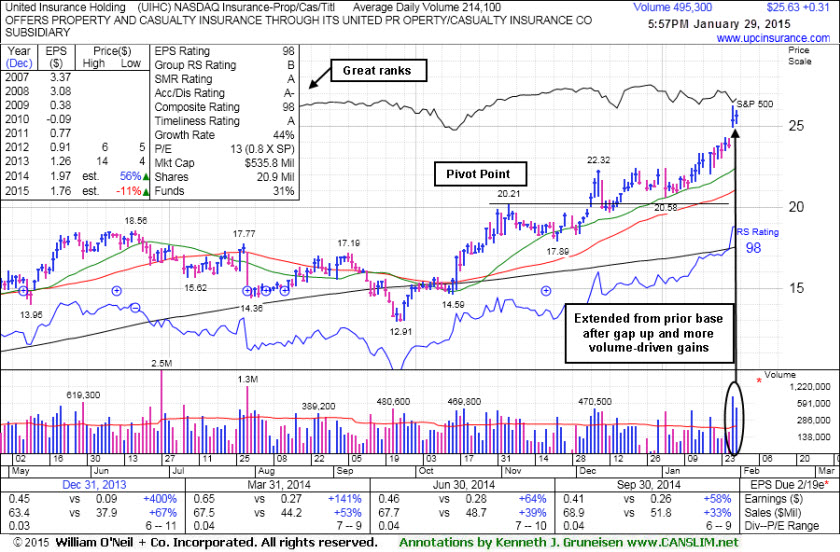
United Insurance Holding (UIHC +$0.31 or +1.22% to $25.63) gapped up on the prior session for a considerable volume-driven gain it is perched at its 52-week high. It is extended from any sound base. Its 50-day moving average (DMA) line defines near-term support to watch on pullbacks.
It was last shown in this FSU section on 1/13/15 with annotated graphs under the headline, "Consolidation Following 'Negative Reversal' Not Considered a Sound Base", as its consolidation was too short to be considered a sound base pattern. Disciplined investors avoid chasing stocks more than +5% above prior highs and always limit losses by selling any stock that falls more than -7% from its purchase price.
UIHC has traded up as much as +27.3% since first highlighted in yellow at $20.64 with pivot point cited based on its 11/05/14 high plus 10 cents in the 12/05/14 mid-day report (read here). It was previously noted - "Heavy volume behind gains for new highs indicated that meaningful institutional buying demand was lurking. It reported earnings +58% on +33% sales revenues for the Sep '14 quarter, its 5th consecutive quarterly comparison above the +25% minimum guideline (C criteria). Annual earnings (A criteria) have been strong."
It completed a new Public Offering on 2/27/14. The number of top-rated funds owning its shares rose from 30 in Dec '13 to 174 in Dec '14, and its current Up/Down Volume Ratio of 2.4 is also a reassuring sign is shares have been under accumulation over the past 50 days.
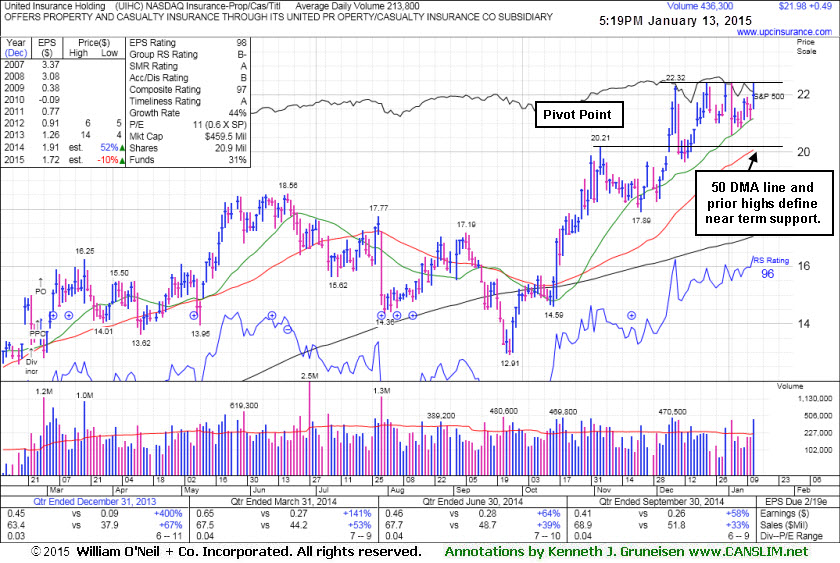
United Insurance Holding (UIHC +$0.49 or +2.28% to $21.98) flashed a "negative reversal" after touching a new 52-week high on 1/02/15. Its recent consolidation is too short to be considered a sound base pattern. The prior highs and its 50-day moving average DMA line ($20.06) define near-term support to watch. It was last shown in this FSU section on 12/23/14 with annotated graphs under the headline, "Recent Streak of Gains Lacked Volume Conviction", as it rose above its "max buy" level. Disciplined investors avoid chasing stocks more than +5% above prior highs and always limit losses by selling any stock that falls more than -7% from its purchase price.
UIHC was highlighted in yellow at $20.64 with pivot point cited based on its 11/05/14 high plus 10 cents in the 12/05/14 mid-day report (read here). Heavy volume behind gains for new highs indicated that meaningful institutional buying demand was lurking. It reported earnings +58% on +33% sales revenues for the Sep '14 quarter, its 5th consecutive quarterly comparison above the +25% minimum guideline (C criteria). Annual earnings (A criteria) have been strong.
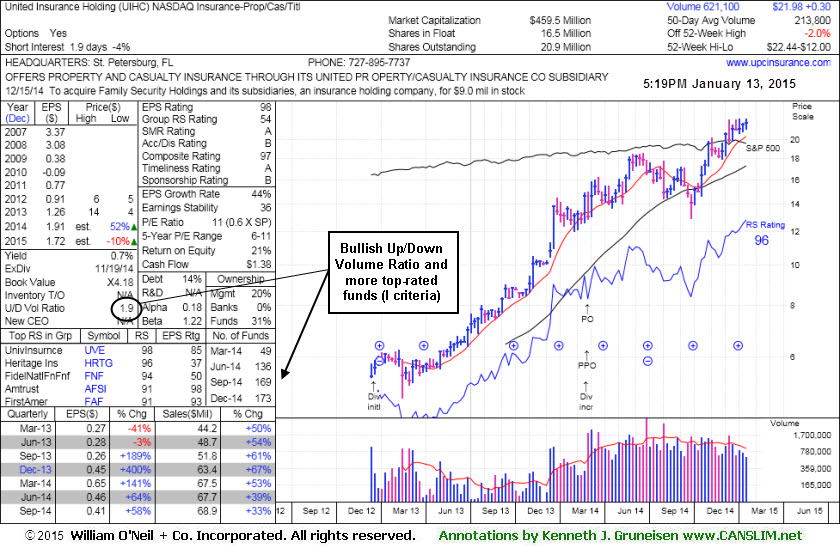
It completed a new Public Offering on 2/27/14. The number of top-rated funds owning its shares rose from 30 in Dec '13 to 173 in Dec '14, and its current Up/Down Volume Ratio of 1.9 is also a reassuring sign is shares have been under accumulation over the past 50 days.
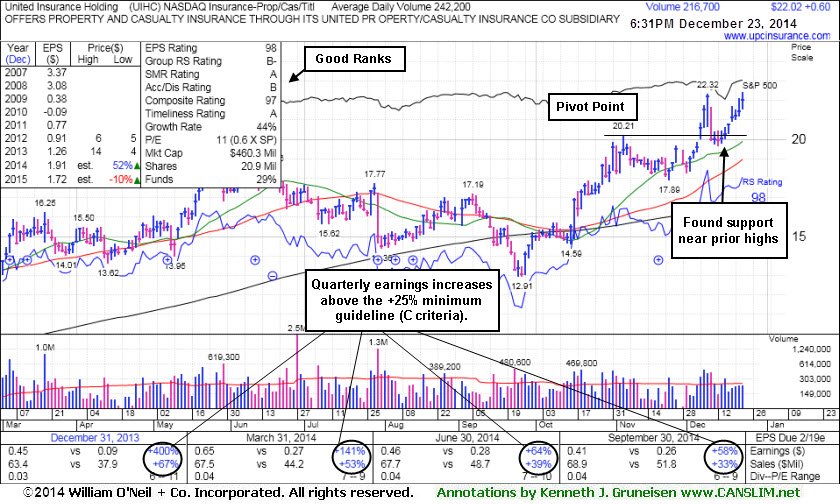
United Insurance Holding (UIHC +$0.60 or +2.80% to $22.02) rose above its "max buy" level as it posted a 6th consecutive gain and its color code was changed to green. Disciplined investors avoid chasing stocks more than +5% above prior highs and always limit losses by selling any stock that falls more than -7% from its purchase price.
UIHC found support near prior highs in the $20 area during its consolidation since last shown in this FSU section on 12/05/14 with annotated graphs under the headline, "Technical Breakout Indicative of Institutional Demand". It was highlighted in yellow with pivot point cited based on its 11/05/14 high plus 10 cents in the 12/05/14 mid-day report (read here). Heavy volume behind gains for new highs was considered a sign of meaningful institutional buying demand. Recent gains lacked great volume conviction.
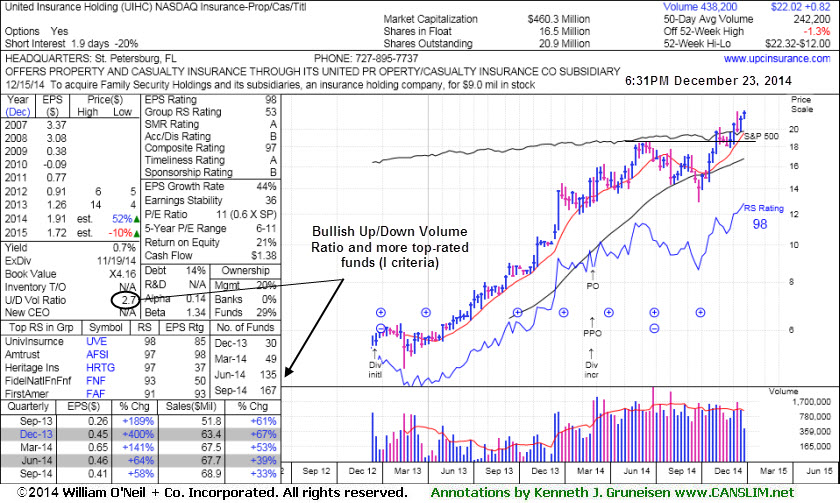
It reported earnings +58% on +33% sales revenues for the Sep '14 quarter, its 5th consecutive quarterly comparison above the +25% minimum guideline (C criteria). Annual earnings (A criteria) have been strong. It completed a new Public Offering on 2/27/14. The number of top-rated funds owning its shares rose from 30 in Dec '13 to 167 in Sep '14, and its current Up/Down Volume Ratio of 2.7 is also a reassuring sign is shares have been under accumulation over the past 50 days.
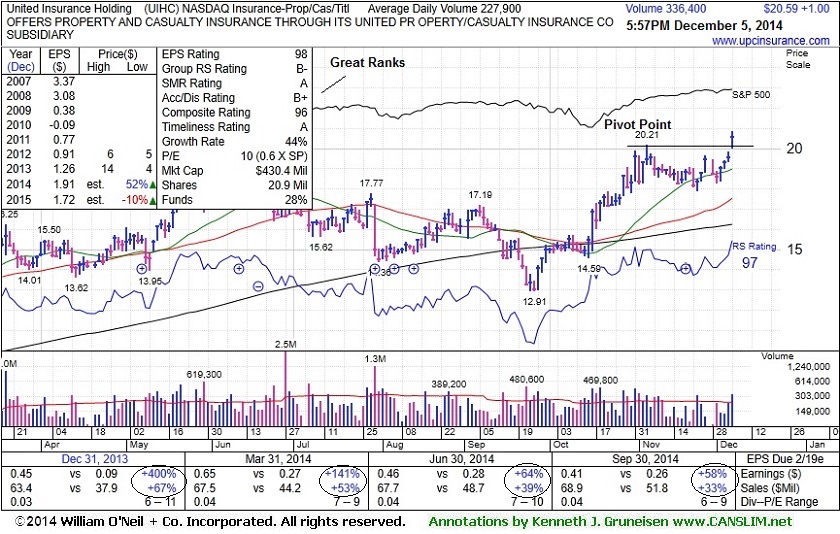
United Insurance Holding (UIHC +$1.00 or +5.15% to $20.59) was highlighted in yellow with pivot point cited based on its 11/05/14 high plus 10 cents in the earlier mid-day report (read here). It hit a new 52-week high with today's 4th consecutive gain, rising from an orderly flat base-on-base pattern with volume +48% above average. Volume should be at least +40% above average behind gains above a stock's pivot point to trigger a proper technical buy signal. Heavy volume is always considered a more serious sign of institutional buying demand.
It reported earnings +58% on +33% sales revenues for the Sep '14 quarter, its 5th consecutive quarterly comparison above the +25% minimum guideline (C criteria). Annual earnings (A criteria) have been strong.
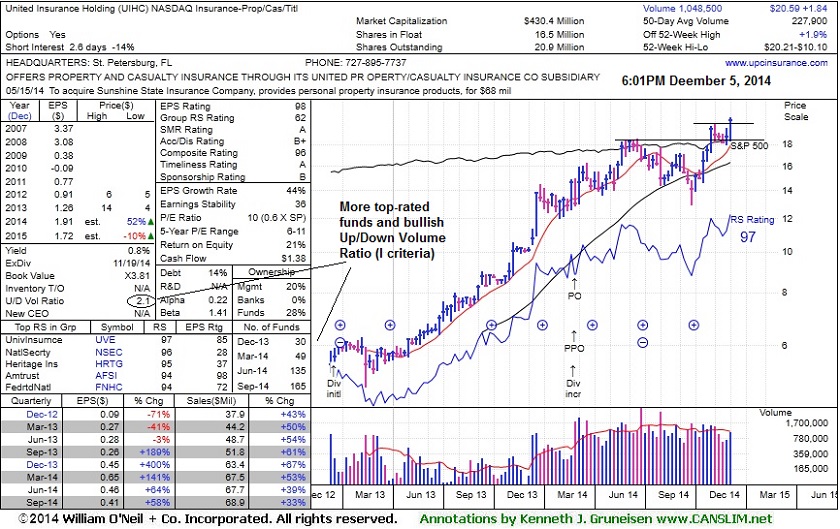
It completed a new Public Offering on 2/27/14.The number of top-rated funds owning its shares rose from 30 in Dec '13 to 165 in Sep '14, and its current Up/Down Volume Ratio of 2.1 is also a reassuring sign is shares have been under accumulation over the past 50 days.