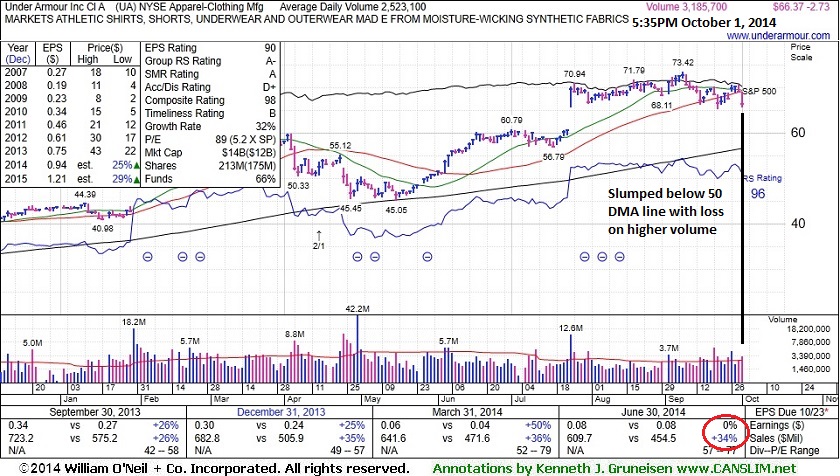
Fundamental and Technical Deterioration Raised Concerns - Wednesday, October 01, 2014
Under Armour Inc (UA -$2.73 or -3.95% to $66.37) sank well below its 50-day moving average (DMA) line with higher volume behind today's damaging loss triggering technical sell signals. Widespread market weakness (M criteria) has been raising concerns. Due to noted fundamental and technical deterioration it will be dropped from the Featured Stocks list tonight.
Keep in mind that, while retreating from its 52-week high, fundamental concerns were raised by earnings reported +0% on +34% sales revenues for the Jun '14 quarter, below the +25% minimum earnings guideline (C criteria). When UA was last shown in this FSU section on 9/15/14 with annotated graphs under the headline "Higher Volume Behind Loss Testing 50-Day Moving Average", members were cautioned - The fact-based investment system's rule prompts selling if any stock falls more than -7% from the purchase price. If market conditions deteriorate it could be extra motivation to limit losses in fundamentally faltering stocks even before a loss might reach the -7% threshold." Also previously noted - "Some concerns are raised by the fact that it made only limited headway following a considerable "breakaway gap" on 7/24/14 with more than 4 times average volume."
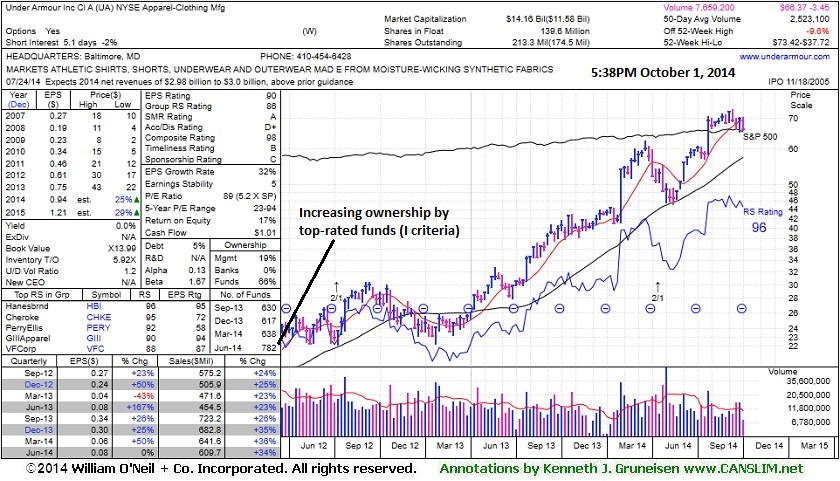
The high-ranked Apparel firm was highlighted in yellow with pivot point based on its 7/01/14 high in the 7/10/14 mid-day report (read here). Its annual earnings (A criteria) history has been strong. The number of top-rated funds owning its shares rose from 637 in Dec '13 to 782 in Jun '14, a reassuring trend concerning the I criteria.
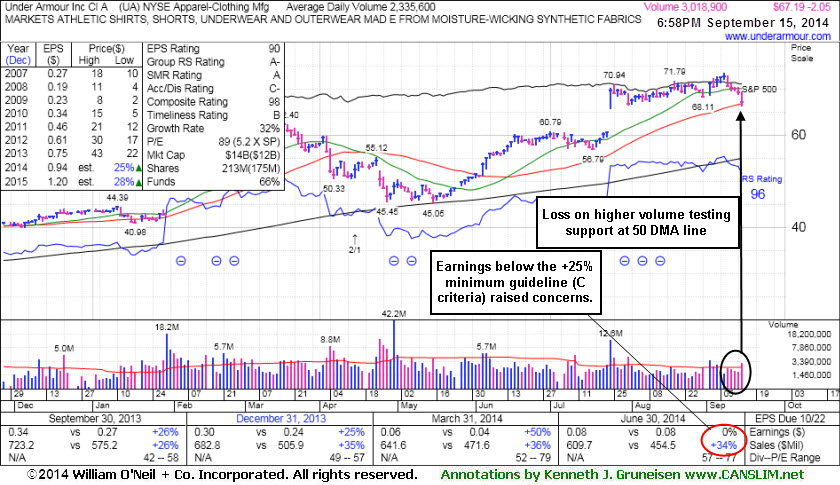
Higher Volume Behind Loss Testing 50-Day Moving Average - Monday, September 15, 2014
Under Armour Inc (UA -$2.05 or -0.54% to $67.19) slumped to its 50-day moving average (DMA) line ($66.73) with higher volume behind today's 5th consecutive loss. Keep in mind that, while retreating from its 52-week high, fundamental concerns were raised by earnings reported +0% on +34% sales revenues for the Jun '14 quarter, below the +25% minimum earnings guideline (C criteria). The fact-based investment system's rule prompts selling if any stock falls more than -7% from the purchase price. If market conditions deteriorate it could be extra motivation to limit losses in fundamentally faltering stocks even before a loss might reach the -7% threshold.
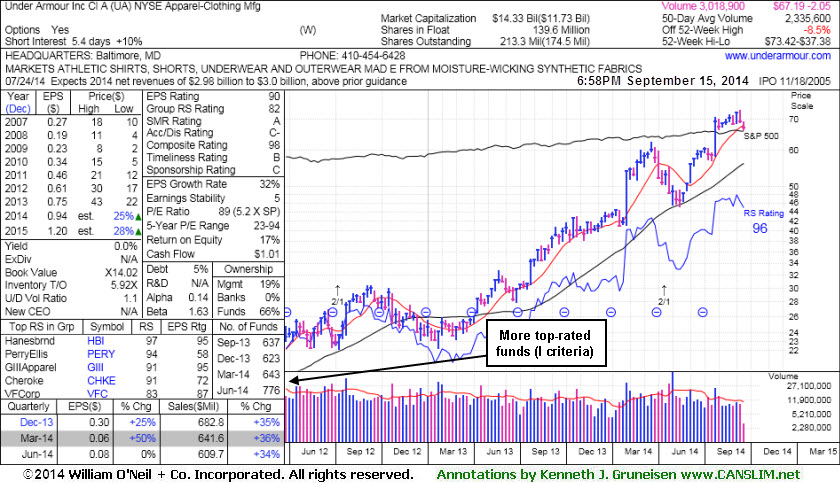
UA was last shown in this FSU section on 8/26/14 with annotated graphs under the headline, "Holding Ground Near All-Time Highs Despite Fundamental Concerns". A small bit of resistance remains due to overhead supply and it may find support near its 50 DMA line. However, some concerns are raised by the fact that it made only limited headway following a considerable "breakaway gap" on 7/24/14 with more than 4 times average volume. The high-ranked Apparel firm was highlighted in yellow with pivot point based on its 7/01/14 high in the 7/10/14 mid-day report (read here). Its annual earnings (A criteria) history has been strong. The number of top-rated funds owning its shares rose from 637 in Dec '13 to 776 in Jun '14, a reassuring trend concerning the I criteria.
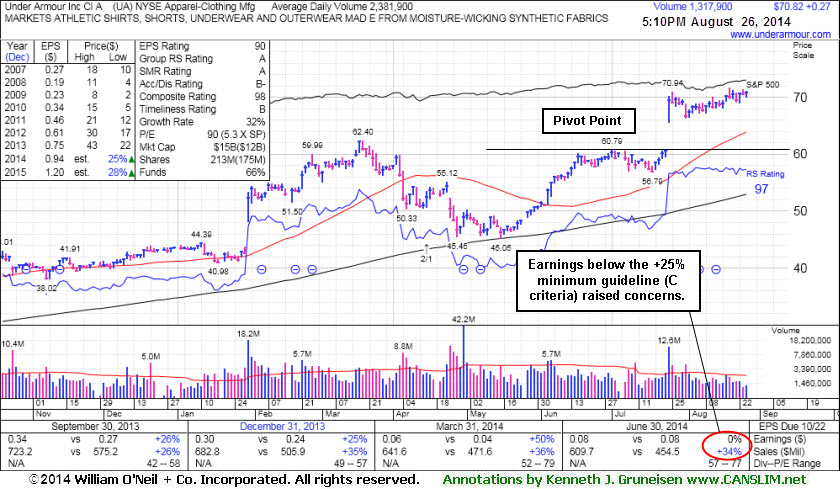
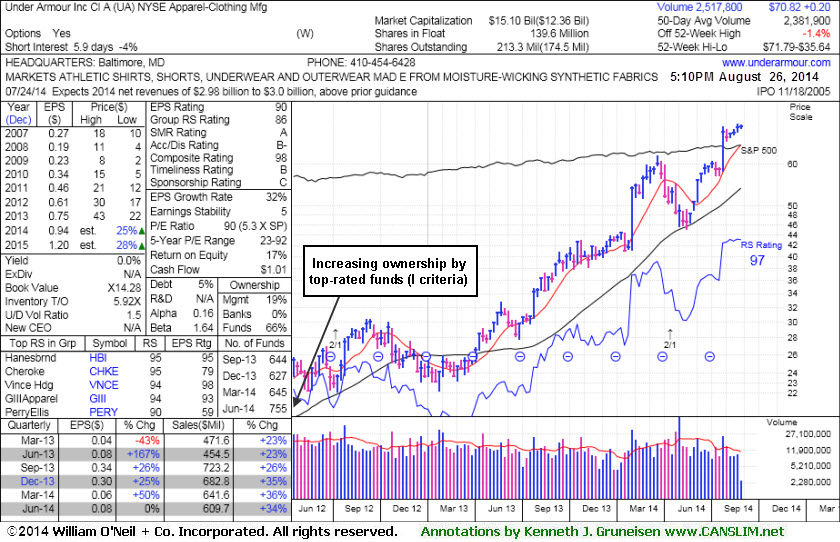
Holding Ground Near All-Time Highs Despite Fundamental Concerns - Tuesday, August 26, 2014
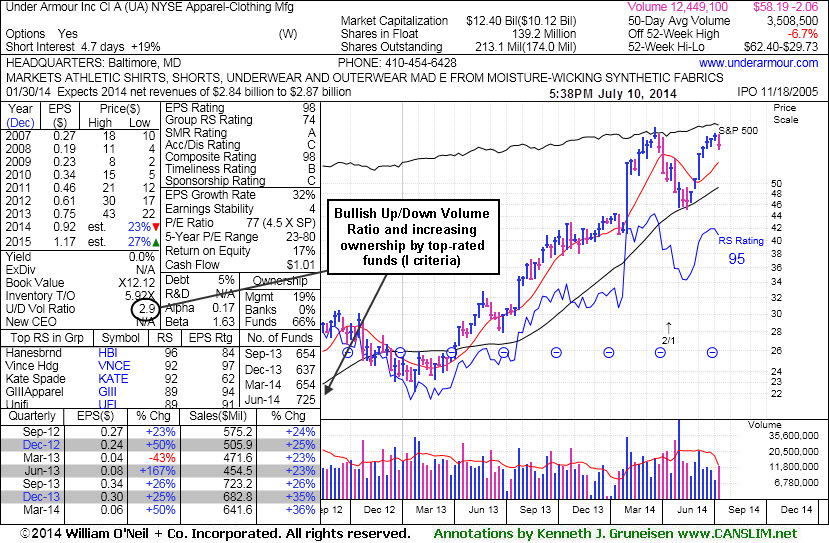
Under Armour Inc (UA +$0.37 or +0.54% to $69.22) is stubbornly holding its ground near its all-time high and no resistance remains due to overhead supply. Fundamental concerns were recently raised as the Apparel - Clothing Manufacturing firm reported earnings +0% on +34% sales revenues for the Jun '14 quarter, below the +25% minimum earnings guideline (C criteria), yet the company raised its guidance. It was last shown in this FSU section on 7/30/14 with annotated graphs under the headline, "Bullish Action Despite Latest Earnings Below +25% Minimum Guideline".
It has been stubbornly holding its ground at its 52-week high following a considerable "breakaway gap" on 7/24/14 with more than 4 times average volume. A breakaway gap is the one noted exception where investors may chase a stock more than +5% above prior highs, but the risks increase the further above prior highs one buys that an ordinary pullback may prompt investors into selling based on the fact-based investment system's rule of always selling if any stock falls more than -7% from the purchase price. However, fundamental concerns were raised by its sub par earnings growth in the most current quarter.
UA was highlighted in yellow with pivot point based on its 7/01/14 high in the 7/10/14 mid-day report (read here). Its annual earnings (A criteria) history has been strong. The number of top-rated funds owning its shares rose from 637 in Dec '13 to 7565 in Jun '14, a reassuring trend concerning the I criteria. Its current Up/Down Volume Ratio of 1.5 is an unbiased indication that its shares have been under accumulation over the past 50 days.
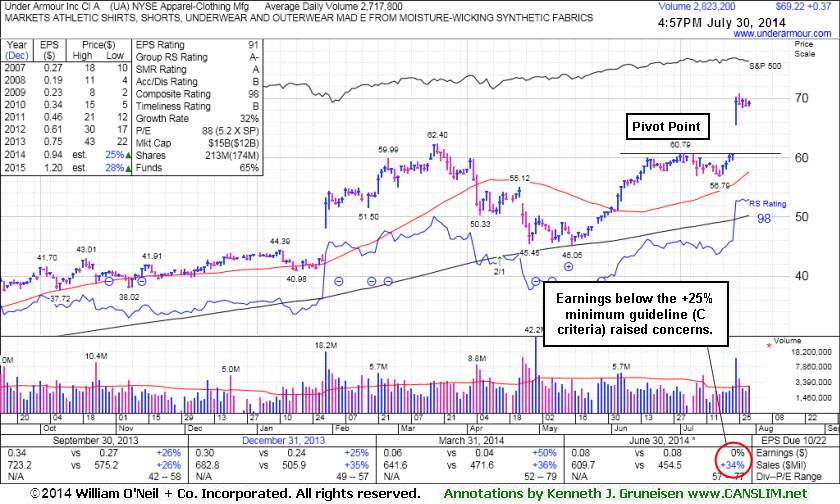
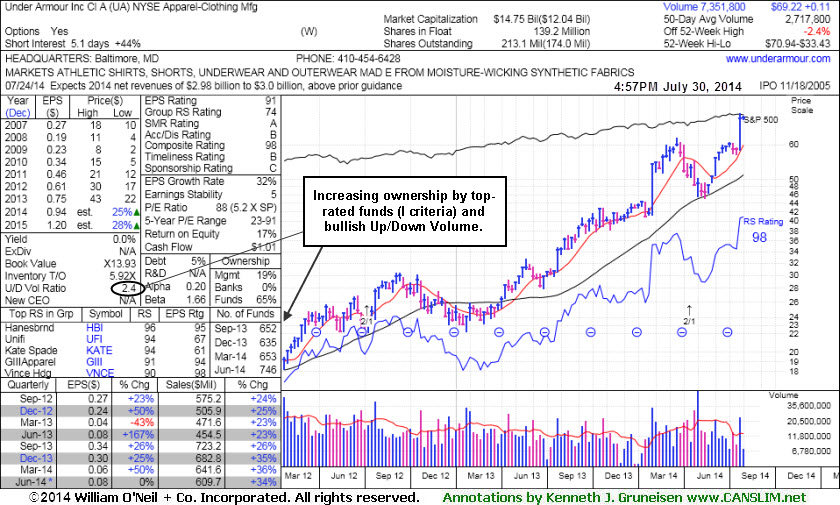
Bullish Action Despite Latest Earnings Below +25% Minimum Guideline - Wednesday, July 30, 2014
Under Armour Inc (UA +$0.37 or +0.54% to $69.22) recently reported earnings +0% on +34% sales revenues for the Jun '14 quarter, below the +25% minimum earnings guideline (C criteria) and raising concerns, yet the company increased its guidance. It has been stubbornly holding its ground at its 52-week high following a considerable "breakaway gap" on 7/24/14 with more than 4 times average volume. A breakaway gap is the one noted exception where investors may chase a stock more than +5% above prior highs, but the risks increase the further above prior highs one buys that an ordinary pullback may prompt investors into selling based on the fact-based investment system's rule of always selling if any stock falls more than -7% from the purchase price. However, fundamental concerns were raised by its sub par earnings growth in the most current quarter.It was last shown in this FSU section on 7/10/14 with annotated graphs under the headline, "Forming Handle on Cup-With-Handle Base Pattern", after highlighted in yellow with pivot point based on its 7/01/14 high in the earlier mid-day report (read here). The high-ranked Apparel - Clothing manufacturing firm's annual earnings (A criteria) history has been strong. The number of top-rated funds owning its shares rose from 637 in Dec '13 to 725 in Jun '14, a reassuring trend concerning the I criteria. Its current Up/Down Volume Ratio of 2.9 is an unbiased indication that its shares have been under accumulation over the past 50 days.
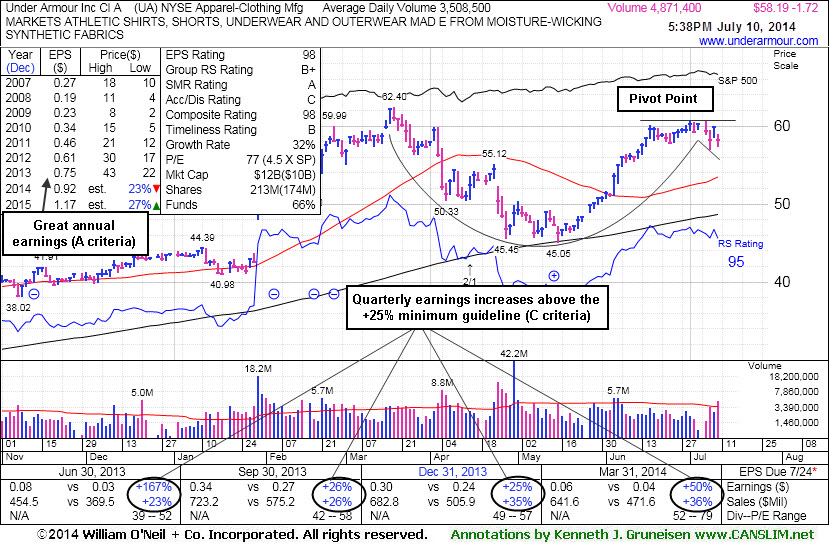
Forming Handle on Cup-With-Handle Base Pattern - Thursday, July 10, 2014
Under Armour Inc (UA -$1.72 or -2.87% to $58.19) encountered distributional pressure today while leadership contracted and the broader market averages retreated from their record highs. It was highlighted in yellow with pivot point based on its 7/01/14 high in the earlier mid-day report (read here). Subsequent volume-driven gains above the pivot point are needed to trigger a proper technical buy signal.
Perched near its 52-week high, it has been forming a handle on the right side of a 17-week cup-with-handle base. One concern is that the recent losses have been backed by near or above average volume, whereas the fact-based investment system's winning models typically saw volume dry up while the handle was formed. That is all the more reason that patience and discipline are paramount, as there is no advantage to be gained by getting in "early" before fresh proof of new and meaningful institutional buying demand drives the price to new highs.
The high-ranked Apparel - Clothing manufacturing firm's quarterly earnings comparisons have been above the +25% guideline (C criteria) through Mar '14 and its annual earnings (A criteria) history has also been strong. The stock found support at its 200-day moving average (DMA) line during its consolidation then rebounded since noted in the 3/20/14 mid-day report with caution - "Since a downturn in the Mar '13 quarter its recent quarterly comparisons have shown earnings increases above the +25% minimum guideline (C criteria) and it has a strong annual earnings (A criteria) history. Patient investors may watch for a new base or secondary buy point to develop and be noted in the weeks ahead."
The number of top-rated funds owning its shares rose from 637 in Dec '13 to 725 in Jun '14, a reassuring trend concerning the I criteria. Its current Up/Down Volume Ratio of 2.9 is an unbiased indication that its shares have been under accumulation over the past 50 days.
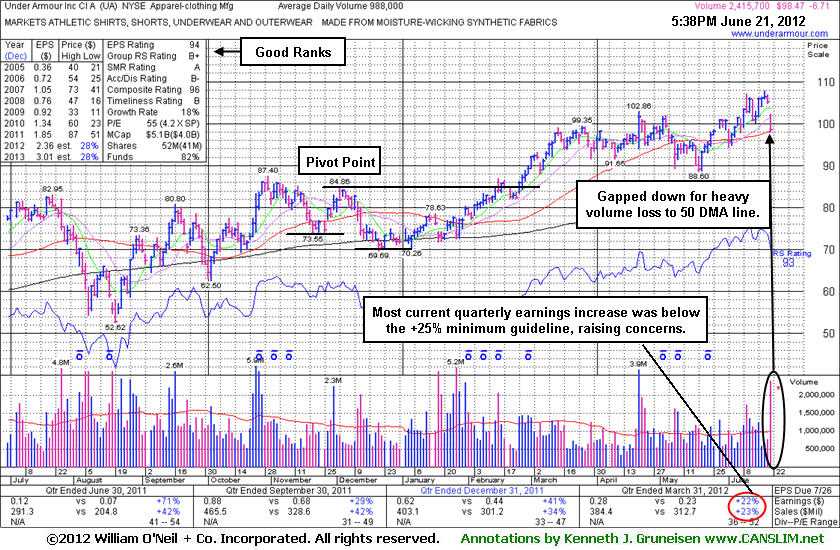
Heavy Volume on Loss After Analyst Downgrade - Thursday, June 21, 2012
Under Armour Inc (UA -$6.71 or -6.38% to $98.47) fell to its 50-day moving average (DMA) line today with a damaging loss on heavy volume after a gap down following an analyst downgrade. It recently wedged to new 52-week highs without especially great volume conviction behind its gains. Subsequent deterioration may result in it being noted and dropped from the Featured Stocks list, however it may likely find support above its prior "double bottom" base. Its previously cited pivot point is illustrated on the graph below.It was last shown in this FSU section on 5/29/12 with an annotated graph under the headline, "Apparel Firm Raised Fundamental Concerns With Sub Par Quarter ", as it posted a 6th consecutive gain. Afterward it found support near its 50 DMA line on a brief pullback and then it rose to new 52-week high territory. However, concerns were recently raised by weaker fundamentals in the Mar '12 period, its first quarterly earnings increase below the +25% minimum guideline in more than 2 years. Otherwise, a new pivot point might have been cited based on its recent resilience. The current quarter ends next Friday, and as it approaches its Jun '12 quarterly earnings release the price/volume action may give traders a hint at whether stronger or weaker earnings are coming.
The high-ranked Apparel - Clothing Manufacturing firm has seen the number of top-rated funds owning its shares rise from 367 in Jun '11 to 447 in Mar '12, a reassuring trend concerning the I criteria.
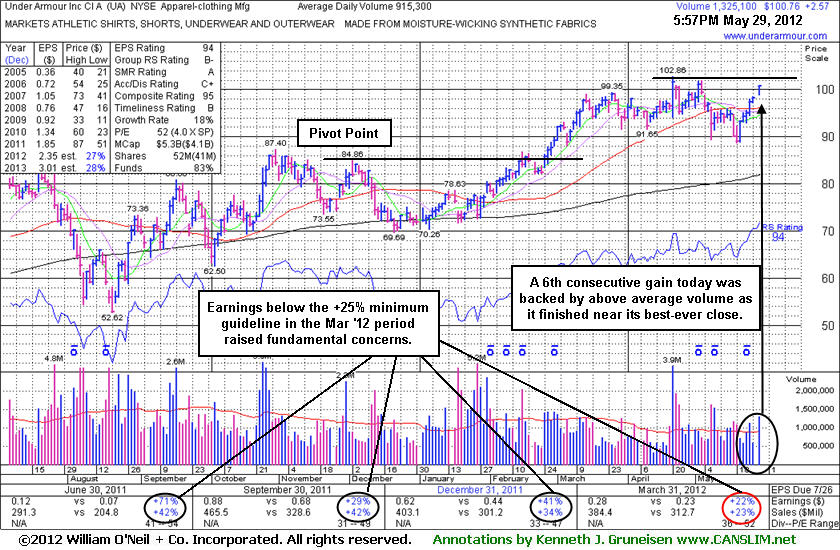
Apparel Firm Raised Fundamental Concerns With Sub Par Quarter - Tuesday, May 29, 2012
Under Armour Inc (UA +$2.57 or +2.62% to $100.76) posted a 6th consecutive gain today, and its gain was backed by above average volume as it finished near its best-ever close. Concerns were recently raised by weaker fundamentals in the Mar '12 period, its first quarterly earnings increase below the +25% minimum guideline in more than 2 years. Otherwise, a new pivot point might be cited based on its recent resilience and while now approaching its 52-week high.
It was last shown in this FSU section on 4/04/12 with an annotated graph under the headline, "Encountering Distributional Pressure While Building New Base". Subsequent volume-driven gains into new high territory would be a very reassuring sign of fresh institutional buying demand that could lead to another meaningful and sustained advance. However, its latest earnings comparison being sub par fundamentally makes it a less ideal candidate for disciplined investors to have on their watchlist, even though it is now perched only -2% off its all-time high. The high-ranked Apparel - Clothing Manufacturing firm has seen the number of top-rated funds owning its shares rise from 379 in Jun '11 to 454 in Mar '12, a reassuring trend concerning the I criteria.
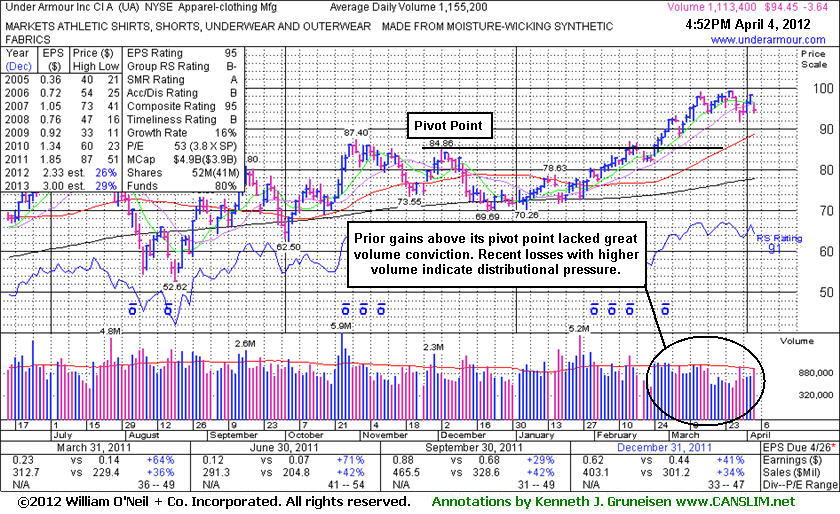
Encountering Distributional Pressure While Building New Base - Wednesday, April 04, 2012
Under Armour Inc's (UA -$3.64 or -3.71% to $94.45) prior gains above its pivot point did not have volume sufficient to trigger a proper technical buy signal, and recent losses on higher volume (near average, but above prior session totals) indicate distributional pressure while working on a possible new base-on-base pattern. It has been consolidating well above its 50-day moving average (DMA) line and well above prior highs. It was last shown in this FSU section on 2/22/12 with an annotated graph under the headline, "Negative Reversal Indicated Distributional Pressure Near Prior Highs". Its subsequent streak of gains above its pivot point was not backed by any +40% above average volume gains to trigger a proper technical buy signal. It simply "wedged" to new highs, and yet its Relative Strength (RS) rank has improved even further above the 80+ guideline expected for buy candidates under the fact-based system.
Subsequent volume-driven gains into new high territory would be a very reassuring sign of fresh institutional buying demand that could lead to another meaningful and sustained advance. However, its latest consolidation is still a bit too short to be recognized as a new "square box" base pattern, "flat base", or any other sound base pattern of minimum length. It remains an ideal candidate for disciplined investors to have on their watchlist as it is now perched only -4.9% off its all-time high.
In the mid-day report on 2/22/12 it was featured in yellow with a new pivot point cited based on its 12/02/11 high while working on a 16-week "double bottom" base pattern. Fundamentals remained strong through the Dec '11 quarterly comparison (good C criteria). The high-ranked Apparel - Clothing Manufacturing firm has seen the number of top-rated funds owning its shares rose from 338 in Dec '10 to 449 in Dec '11, a reassuring trend concerning the I criteria.
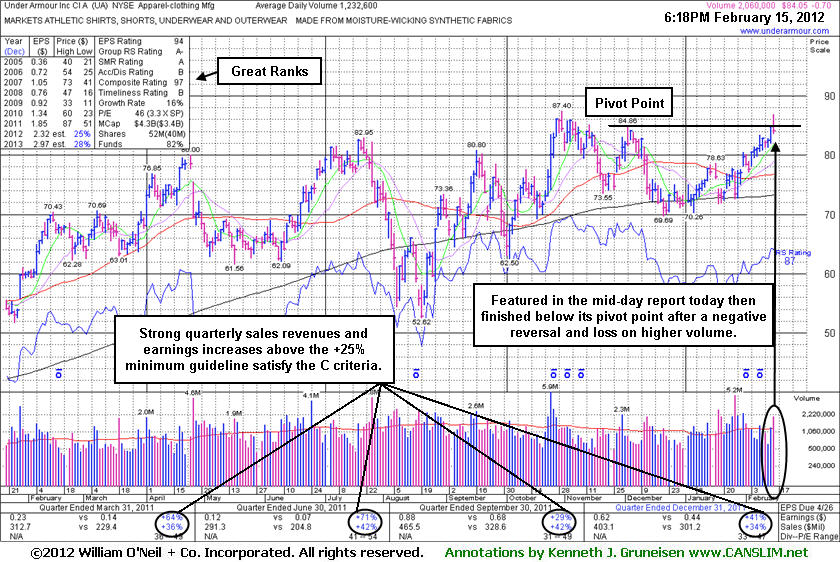
Negative Reversal Indicated Distributional Pressure Near Prior Highs - Wednesday, February 15, 2012
Often, when a leading stock is setting up to breakout of a solid base it is highlighted in CANSLIM.net's Mid-Day Breakouts Report. The most relevant factors are noted in the report which allows prudent CANSLIM oriented investors to place the issue in their watch list. After doing any necessary backup research, the investor is prepared to act if and when the stock triggers a technical buy signal (breaks above its pivot point on more than +50% average turnover). In the event the stock fails to trigger a technical buy signal and its price declines then it will simply be removed from the watch list. In other cases, stocks may be featured in CANSLIM.net's Mid-Day Breakouts Report.after recent action already triggered technical buy signal. Disciplined investors know to buy as near as possible to the pivot point and avoid chasing stocks after they have rallied more than +5% above their pivot point. It is crucial to always limit losses whenever any stock heads the wrong direction, and disciplined investors sell if a struggling stock ever falls more than -7% from their purchase price.
Under Armour Inc (UA -$0.70 or -0.83% to $84.05) finished the session with a loss on higher volume following a "negative reversal" while it was trading within close striking distance of its all-time high. That is a sign that today it encountered distributional pressure, whereas accumulation would have led to a stronger close. It found support near its 200 DMA line recently and rebounded near its 52-week high. In the mid-day report earlier today it was featured in yellow with a new pivot point cited based on its 12/02/11 high while working on a 16-week "double bottom" base pattern. Fundamentals remained strong through the Dec '11 quarterly comparison (good C criteria) and it has formed a sound base. It was last shown in this FSU section on 12/22/11 under the headline, "Dropping Off Featured Stocks List Again Due to Weak Action", as it was slumping further below a previous low ($73.55 on 11/21/11) and dipping just under important chart support at its 200-day moving average (DMA) line.
The high-ranked Apparel - Clothing Manufacturing firm has seen the number of top-rated funds owning its shares rose from 338 in Dec '10 to 443 in Dec '11, a reassuring trend concerning the I criteria. Its Relative Strength (RS) rank improved back above the 80+ guideline expected for buy candidates under the fact-based system, while regular readers may recall that the RS Rank's earlier slump had raised concerns. Subsequent gains above its pivot point backed by sufficient above average volume may trigger a technical buy signal. Meanwhile it is an ideal candidate for disciplined investors to have on their watchlist.
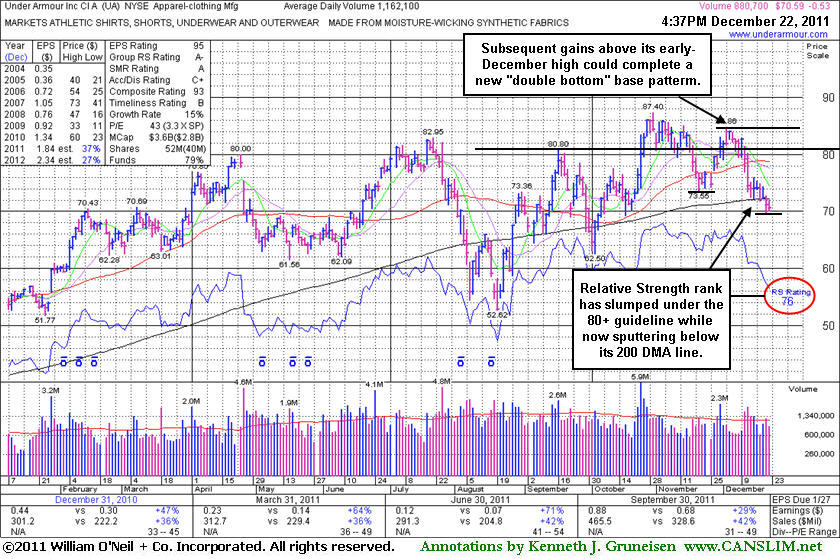
Dropping Off Featured Stocks List Again Due to Weak Action - Thursday, December 22, 2011
Under Armour Inc (UA -$0.53 or -0.75% to $70.59) was down again today on light volume, slumping further below the previously noted low ($73.55 on 11/21/11) and dipping just under important chart support at its 200-day moving average (DMA) line. Its Relative Strength rank (see red circle) has slumped to 76, under the 80+ guideline expected for buy candidates under the fact-based system, raising additional concerns. Since its last appearance in this FSU section on 11/29/11 with an annotated graph under the headline, "Little Resistance Due to Overhead Supply", damaging losses violated its 50-day moving average (DMA) line, hurting its technical stance. Gains above its 50 DMA line are now needed for its outlook to improve. Subsequent gains above its early December high could complete a new "double bottom" base pattern. If strength returns members may see it featured again in a future report.Meanwhile it has some work to do as it finished -19.2% off its 52-week high, and it will be dropped from the Featured Stocks list tonight.
The high-ranked Apparel - Clothing Manufacturing firm reported earnings +29% on +42% sales revenues for the quarter ended September 30, 2011 versus the year ago period. The number of top-rated funds owning its shares rose from 338 in Dec '10 to 425 in Sep '11, a reassuring trend concerning the I criteria. Earlier notes had acknowledged the downward turn in annual earnings (A criteria) in FY '08, a concern with respect to the fact-based investment system.
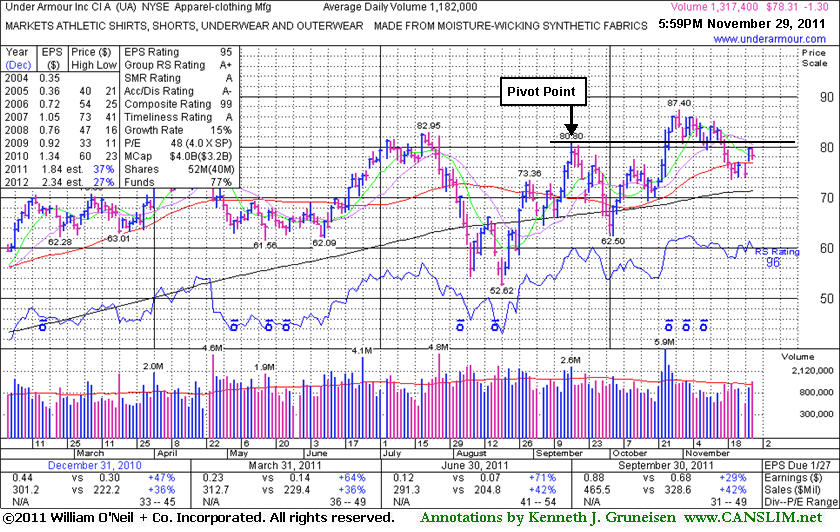
Little Resistance Due to Overhead Supply - Tuesday, November 29, 2011
Under Armour Inc (UA -$1.30 or -1.63% to $78.31) has rallied back above its 50-day moving average (DMA) line which helped its technical stance improve. Little resistance remains due to overhead supply following its recent consolidation. Its 200 DMA line defines the next important support level. Its last appearance in this FSU section was on 11/03/11 with an annotated graph under the headline, "Found Support Near Pivot Point After Volume-Driven Breakout", while perched near its all-time high.
The high-ranked Apparel - Clothing Manufacturing firm was highlighted in yellow in the 10/25/11 mid-day report (read here) with an annotated graph illustrating its volume-driven breakout from a "reverse-head-and-shoulders" base pattern. Proof of fresh buying demand may be a reassurance worth waiting on before accumulating. Volume-driven gains to new high ground could signal the beginning of a longer and more substantial advance. During its recent rebound there were bullish signs of heavy new institutional buying demand, a very reassuring characteristic when considering new buying efforts in any stock. UA reported earnings +29% on +42% sales revenues for the quarter ended September 30, 2011 versus the year ago period. The number of top-rated funds owning its shares rose from 339 in Dec '10 to 420 in Sep '11, a reassuring trend concerning the I criteria. Earlier notes had acknowledged the downward turn in annual earnings (A criteria) in FY '08, a concern with respect to the fact-based investment system.
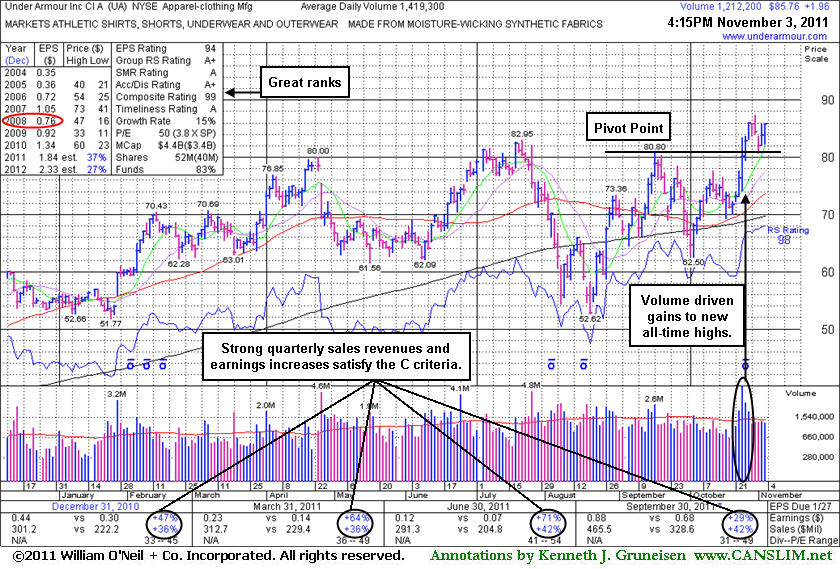
Found Support Near Pivot Point After Volume-Driven Breakout - Thursday, November 03, 2011
Under Armour Inc (UA +$1.96 or +2.34% to $85.76) finished near the session high today with a gain on lighter volume leaving it perched near its all-time high. No resistance remains due to overhead supply following its recent spurt of volume-driven gains. Prior highs near $80 define initial support to watch above its 50-day moving average (DMA) line. The high-ranked Apparel - Clothing Manufacturing firm was highlighted in yellow in the 10/25/11 mid-day report (read here) with an annotated graph illustrating its volume-driven breakout from a "reverse-head-and-shoulders" base pattern. After it got extended from the prior base its color code was change to green on 10/27/11. Then, its color code was changed to yellow again on 10/31/11 after an ordinary pullback on light volume, a healthy retreat which allowed disciplined investors to accumulate shares without chasing the stock above the pivot point by more than +5% or the "max buy" price referred to in CANSLIM.net reports. Today's strong close led to a finish above the "max buy" level, so its color code was changed to green after again getting extended from its prior base. Approximately 40% of successful breakouts pullback and test support near prior highs before going on to produce more substantial gains.
Earlier, UA did not confirm a proper technical buy signal after it had been featured in yellow in the 7/19/11 mid-day report, and its last appearance in this FSU section was on 7/26/11 with an annotated graph under the headline, "Confirming Gains Did Not Trigger Fresh Buy Signal." On August 2nd it was noted -"Down today on average volume, violating its 50 DMA line and raising concerns. UA did not confirm a proper technical buy signal since recently featured in yellow, and based on its damaging slump to a finish -16.6% off its 52-week high it will be dropped from the Featured Stocks list tonight." Additional losses on heavy volume followed, leading to a much deeper pullback below its 200 DMA line before support arrived and fresh buying demand soon lifted the shares back above its long-term and short-term moving averages, helping its outlook. Volume-driven gains during its rebound were bullish signs of heavy new institutional buying demand, a very reassuring characteristic when considering new buying efforts in any stock.
UA reported earnings +29% on +42% sales revenues for the quarter ended September 30, 2011 versus the year ago period. The number of top-rated funds owning its shares rose from 308 in Mar '10 to 442 in Sep '11, a reassuring trend concerning the I criteria. Earlier notes had acknowledged the downward turn in annual earnings (A criteria) in FY '08, a concern with respect to the fact-based investment system (see red oval).
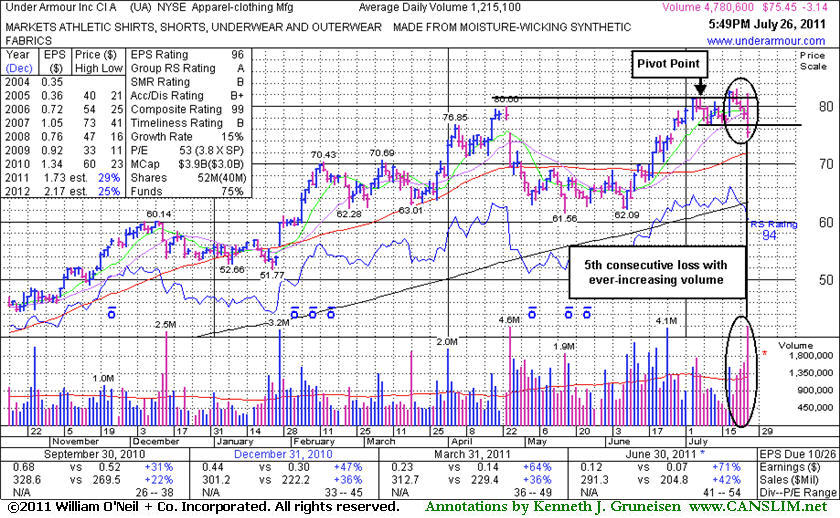
Confirming Gains Did Not Trigger Fresh Buy Signal - Tuesday, July 26, 2011
Under Armour Inc (UA -$3.14 or -4.00% to $75.45) reported earnings +71% on +42% sales revenues for the quarter ended June 30, 2011 versus the year ago period, showing impressive acceleration in sales and earnings increases, sequentially. However, today its color code was changed to green after enduring more distributional pressure and slumping more than -7% below its pivot point with a 5th consecutive loss on ever-increasing volume. It did not confirm a proper technical buy signal since featured in yellow in the 7/19/11 mid-day report. While above average demand drove it to a new high, the unconvincing volume total on 7/19/11 (below the minimum guideline of +40-50% above average volume) left disciplined investors to wonder where the enthusiastic buyers were hiding. Subsequent confirming gains never materialized. Volume and volatility often increase near earnings news, but the loss on even heavier volume and weak finish made it clear today that the institutional crowd was not accumulating this high-ranked leader from the Apparel - Clothing Mfg group's shares.
The number of top-rated funds owning its shares rose from 308 in Mar '10 to 403 in June '11, a reassuring sign concerning the I criteria. Earlier notes had acknowledged the downward turn in annual earnings (A criteria) in FY '08, a concern with respect to the fact-based investment system. UA found support near earlier lows in the $62 area after it was dropped from the Featured Stocks list on 5/03/11. Its last appearance in this FSU section was on 4/29/11 with an annotated graph under the headline, "Overhead Supply Can Be the Source of Resistance", as damaging losses with above average volume led to a close below its 50-day moving average (DMA) line and under prior chart highs, raising concerns and triggering a technical sell signal. Volume-driven gains and gaps up during its subsequent rebound were bullish signs.
Rather than bargain hunting, disciplined investors might sooner consider any fresh breakouts that might emerge. Keep in mind that UA may still dig its heels in and trade higher, but disciplined investors will wait for signs of heavy new institutional buying demand before considering new buying efforts.
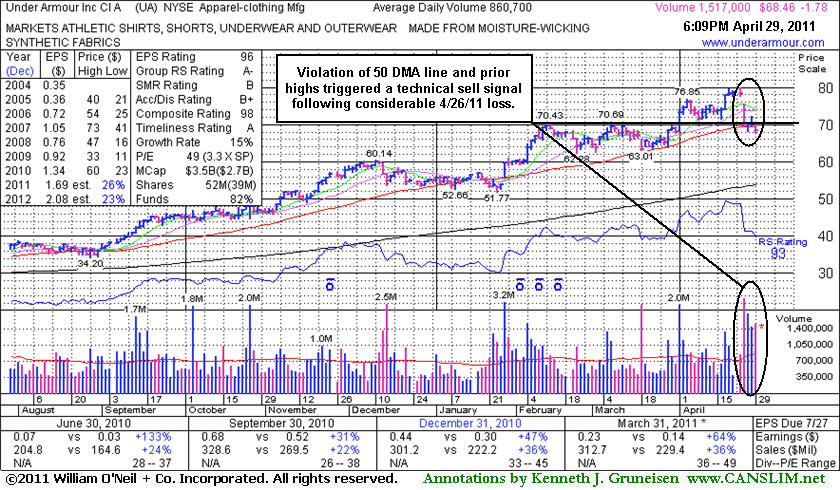
Overhead Supply Can Be the Source of Resistance - Friday, April 29, 2011
Under Armour Inc (UA -$1.78 or -2.53% to $68.46) suffered another damaging loss today with above average volume that led to a close below its 50-day moving average (DMA) line and under prior chart highs. The deterioration raised concerns and triggered a technical sell signal. Following its last appearance in this FSU section on 4/01/11 with an annotated graph under the headline, "Under Accumulation", it soon traded above its 2007 all-time high ($73.40) and rallied even further with above average volume. However, it was down considerably with heavy volume on 4/26/11 after reporting earnings +64% on +36% sales revenues for the quarter ended March 31, 2011 versus the year ago period.
A prompt rebound above that short-term average would help its outlook. That is where institutional owners often accumulate more shares and add to current holdings when they view a company's outlook as still favorable. Whenever a stock slices below the 50 DMA line and volume swells behind damaging losses, concerns increase because it is clear some institutional holders are headed for the exits, rather than accumulating near that important short-term average. While above average demand recently drove it to new highs, one must wonder where the enthusiastic buyers are hiding as it suddenly gives back the hard fought gains and falls on even heavier volume. The number of top-rated funds owning its shares rose from 308 in Mar '10 to 415 in Mar '11, so it had been showing very reassuring signs concerning the I criteria.
Rather than bargain hunting, disciplined investors might sooner consider any fresh breakouts that might emerge. Keep in mind that UA now faces resistance due to overhead supply created while it traded at higher levels for the past month. Earlier notes had acknowledged the downward turn in annual earnings (A criteria) in FY '08, a concern with respect to the fact-based investment system.
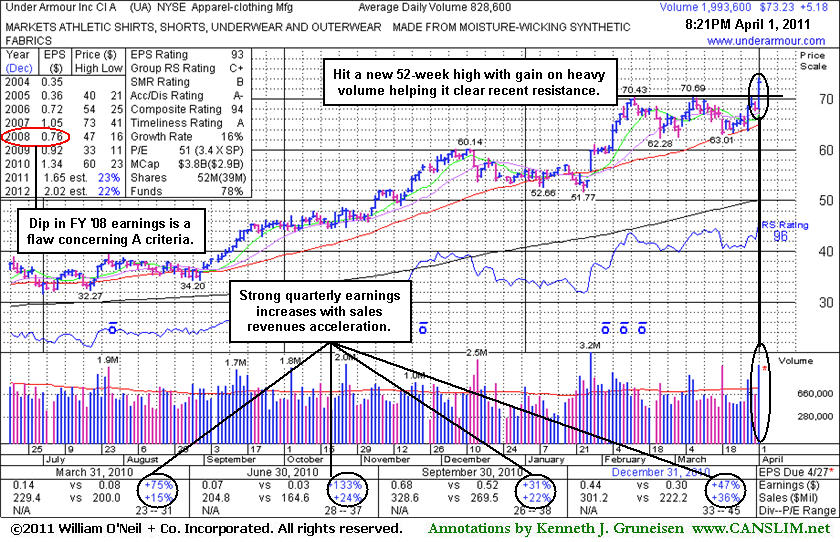
Under Accumulation - Friday, April 01, 2011
Prior quarters have shown strong earnings increases and strong sales revenues increases with acceleration which is very encouraging. Earnings were up +47% on +36% better sales revenues for the quarter ended December 31, 2010 versus the year ago period. Fundamentally, that improvement was a big help with respect to the C criteria. Earlier notes had acknowledged the downward turn in annual earnings (A criteria) in FY '08, a concern with respect to the fact-based investment system. The number of top-rated funds owning its shares rose from 308 in Mar '10 to 392 in Dec '10, a very reassuring sign concerning the I criteria.
Under Armour Inc (UA +$5.18 or +7.61% to $73.23) was previously noted, "Volume-driven gains for a strong close above its pivot point may trigger a new (or add-on) technical buy signal" as its color code was changed to yellow and a new pivot point was cited on 3/31/11. Its considerable gain today with more than 2 times average volume helped it rise from a base-on-base type pattern for a new 52-week high. It is clear of all resistance due to overhead supply. During the session it also traded above its 2007 all-time high ($73.40), and its ability to reach new all-time high territory could help it build even more upward momentum.
Following its last appearance in this FSU section on 3/07/11 with an annotated graph under the headline, "High-Ranked Apparel Firm Bucking Broader Weakness", it found support above its 50-day moving average (DMA) line. That is where institutional owners often accumulate more shares and add to current holdings when they view a company's outlook as still favorable. Whenever a stock slices below the 50 DMA line and volume swells behind damaging losses, concerns increase because it is clear some institutional holders are headed for the exits, rather than accumulating near that important short-term average.
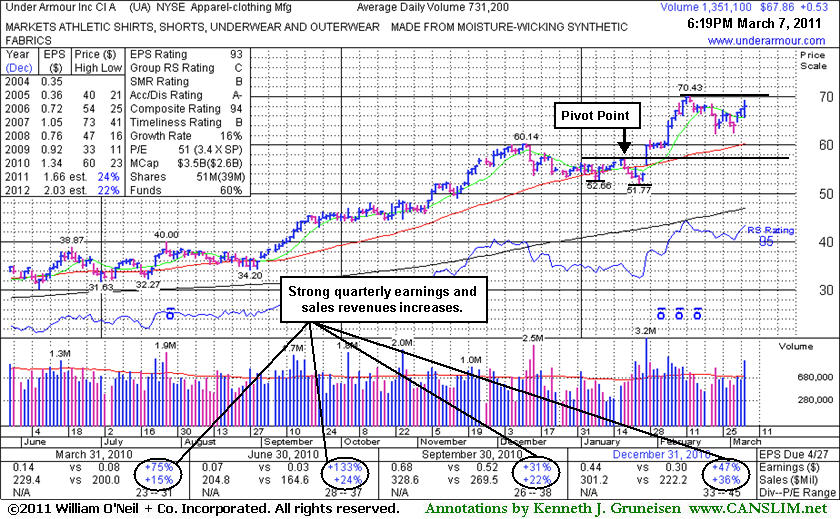
High-Ranked Apparel Firm Bucking Broader Weakness - Monday, March 07, 2011
Under Armour Inc (UA +$0.53 or +0.79% to $67.86) posted a solid gain with above average volume today, bucking the broader market's weakness. Prior resistance and its 50-day moving average (DMA) line in the $60 area define important chart support to watch. Its brief consolidation has been healthy, but it needs more time to potentially form a sound base-on-base type pattern. Since its last appearance in this FSU section on 2/01/11 with an annotated graph under the headline, "Perched Near 52-Week High Following "Double Bottom" Breakout", it blasted higher with more volume-driven gains, however it has yet to challenge its 2007 all-time high ($73.40).
Prior reports observed that its technical strength was backed up by strong earnings and sales revenues increases reported for the quarter ended Dec 31, 2011 with positive guidance. Earnings were up +47% on +36% better sales revenues for the quarter ended December 31, 2010 versus the year ago period. Fundamentally, that improvement was a big help with respect to the C criteria. (Editor's Note: Its earnings increase in the September '10 comparison appears to have been upwardly revised since its prior FSU appearances.) Earlier notes had acknowledged the downward turn in annual earnings (A criteria) in FY '08, another fundamental concern with respect to the fact-based investment system.
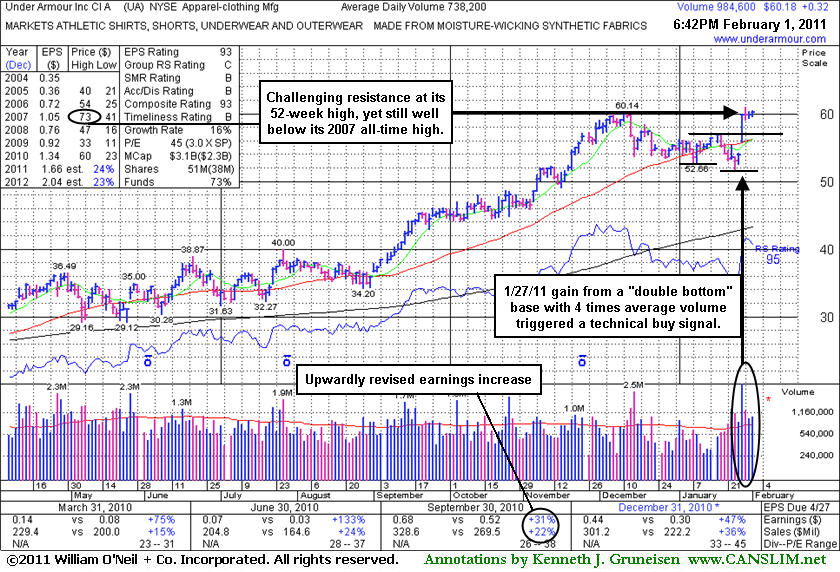
Perched Near 52-Week High Following "Double Bottom" Breakout - Tuesday, February 01, 2011
Under Armour Inc (UA +$0.32 or +0.53% to $60.18) posted a small gain today with above average volume. It closed the session above its "max buy" level, and its color code was changed to green. As previously noted - "It may encounter resistance at its 52-week high, and it remains well off its 2007 all-time high ($73.40)."
In its last FSU appearance on 12/23/10 under the headline "Fundamental And Technical Deterioration Raise Concerns" an annotated graph showed it violating an upward trendline with a considerable loss on above average volume while slumping toward a recent low. Mild distributional pressure subsequently led to violations of the recent chart low ($53.60) and its 50-day moving average (DMA) line, raising concerns. However, on 1/27/11 a considerable gap up gain above its 50 DMA line with more than 4 times average volume helped it break out from a near-minimum-length 8-week "double bottom" type base identified in the mid-day report. Its color code was changed to yellow with new pivot point cited based on its 1/19/11 high, and its close above it triggered a new technical buy signal. The strength was noted as an immediate reaction to strong earnings and sales revenues increases reported for the quarter ended Dec 31, 2011 with positive guidance. Earnings were up +47% on +36% better sales revenues for the quarter ended December 31, 2010 versus the year ago period. Fundamentally, that improvement was a big help with respect to the C criteria. (Editor's Note: Its earnings increase in the September '10 comparison appears to have been upwardly revised since its prior FSU appearance that we have linked to in the headline above.) Earlier notes had acknowledged the downward turn in annual earnings (A criteria) in FY '08, another fundamental concern with respect to the fact-based investment system.
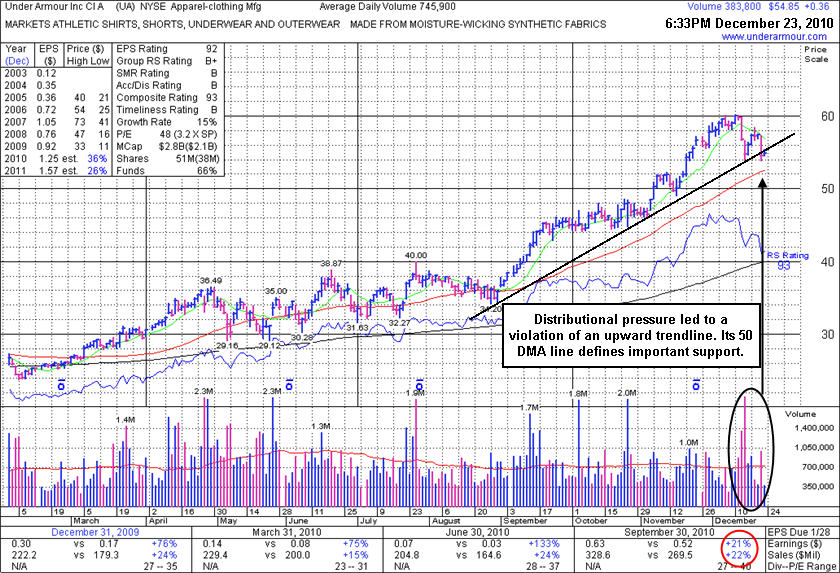
Fundamental And Technical Deterioration Raise Concerns - Thursday, December 23, 2010
Under Armour, Inc. (UA +$0.36 or +0.66% to $54.85) posted a small gain on light volume today. It was down on the prior session, violating an upward trendline with a considerable loss with above average volume while slumping toward last week's low. It has not formed any recent new base, and the latest action is indicative of distributional pressure. The recent chart low ($53.60) and its 50-day moving average (DMA) line ($52.54 now) define important support levels to watch.
Since its last appearance in this FSU section with an annotated graph on 11/04/10 under the headline "Technically Strong Although Earnings Growth Missed Guidelines" it went on to rally up to $60, amounting to an impressive +50% sprint above its old resistance at the $40.00 level. Further technical deterioration, coupled with the fact that its quarterly and annual earnings track record have some previously noted fundamental flaws with respect to the fact-based investment system, may be viewed as warning signs prompting investors to lock in profits. The weaker earnings increase (under the +25% guideline) in the latest quarter ended September 30, 2010 raised concerns, fundamentally, with respect to the C criteria. Earlier notes acknowledged the downward turn in annual earnings (A criteria) in FY '08, another fundamental concern with respect to the fact-based investment system.
Keep in mind that UA was long ago dropped from the CANSLIM.net Featured Stocks list on 5/04/07 and it subsequently fell from $44.50 to as low as $11.94 before rebounding impressively. It may not be due for such a deep consolidation now, and perhaps its 50 DMA line will act as near-term support, but the recent action suggests that it may spend more time digesting this year's great gains. It would also be reassuring if it show stronger earnings increases in upcoming quarterly comparisons, but only time will tell.
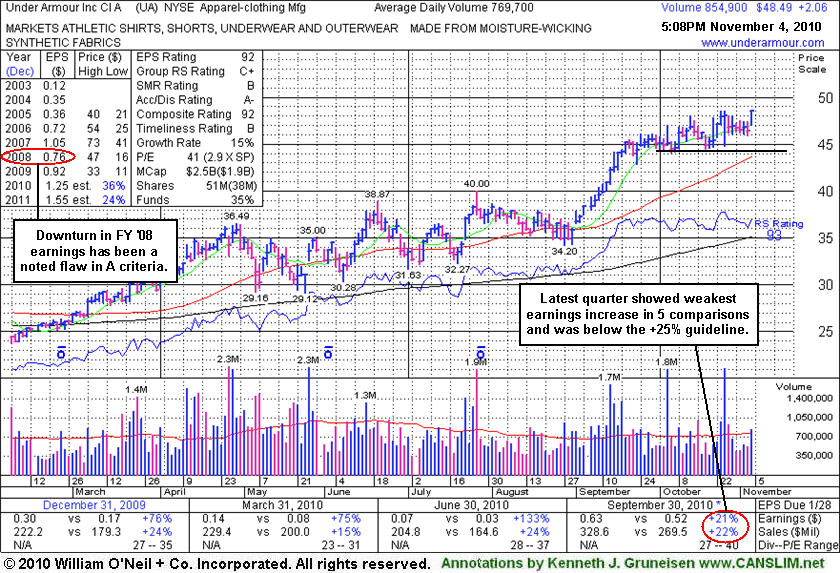
Technically Strong Although Earnings Growth Missed Guideline - Thursday, November 04, 2010
Under Armour, Inc. (UA +$2.06 or +4.44% to $48.49) posted a gain on average volume today for a new high close. Since its last appearance in this FSU section with an annotated graph on 9/09/10 under the headline "Finished Below Pivot Point Near Middle Of Intra-day Range" it produced a streak of many consecutive gains, then worked its way higher in recent weeks without forming a sound new base. While technically strong, it deserves the benefit of the doubt, especially with a favorable backdrop from the M criteria currently favoring 3 out of 4 growth stocks. Its quarterly and annual earnings track record has some fundamental flaws with respect to the fact-based investment system. The weaker earnings increase (under the +25% guideline) in the latest quarter ended September 30, 2010 raised concerns, fundamentally, with respect to the C criteria. Earlier notes acknowledged the downward turn in annual earnings (A criteria) in FY '08, another fundamental concern with respect to the fact-based investment system. Keep in mind that UA was long ago dropped from the CANSLIM.net Featured Stocks list on 5/04/07 and it subsequently fell from $44.50 to as low as $11.94 before rebounding impressively.
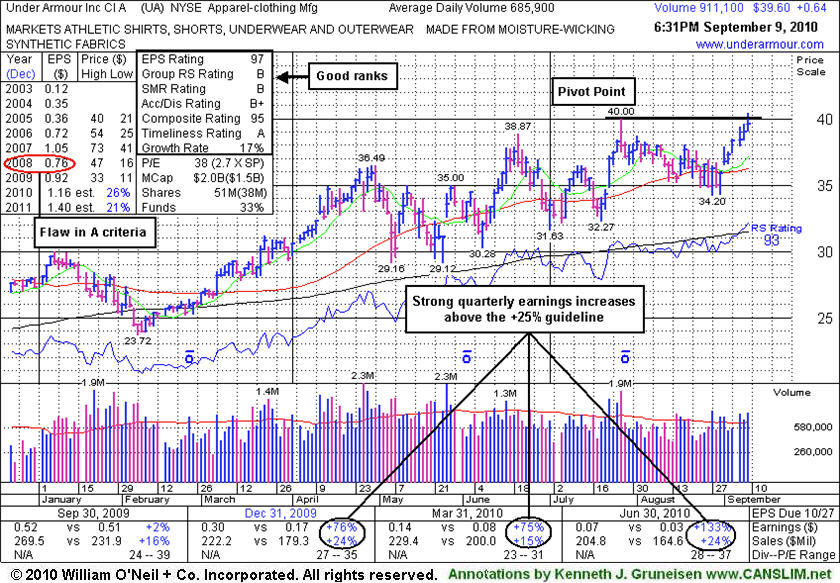
Finished Below Pivot Point Near Middle Of Intra-day Range - Thursday, September 09, 2010
Under Armour, Inc. (UA +$0.64 or +1.64% to $39.60) topped its 7/27/10 high earlier today and finished at a new high close for the year with its 7th consecutive gain since finding recent support near its 50-day moving average (DMA) line. A gain with substantial volume could confirm a technical buy signal, but today gain lacked the volume and it did not close above its pivot point cited. Recent quarters show improving sales revenues growth and big earnings increases following weaker comparisons. The downward turn in annual earnings (A criteria) in FY '08 remains a noted fundamental concern (see red circle) with respect to the fact-based investment system. It was noted in the mid-day report on 9/07/10 and on 7/27/10 that UA was long ago dropped from the CANSLIM.net Featured Stocks list on 5/04/07 and it subsequently fell from $44.50 to as low as $11.94 before rebounding impressively.
What's Under the Hood? - Tuesday, May 01, 2007
It is very important to isolate the noise and pay attention to price and volume as we make our way through yet another earnings season. There are a slew of analysts that come out and set "targets" and who constantly engage in publishing upgrades or downgrades on various securities. An important element in profitably navigating through a busy earnings season is to see how your individual holdings react to their latest earnings news and guidance. While it is a common occurrence to see stocks sell off after a new earnings report, it is healthy to see investors promptly bid the stocks higher after a company reports their quarterly results. Investors that objectively analyze price and volume will likely do better than blindly following a plethora of analysts' upgrades and downgrades.
Under Armour, Inc. (UA -$4.44 or -8.79% to $46.06) reacted to a weaker than expected earnings report and gapped down, opening the session below its 50-day moving average (DMA) line for a considerable loss on very heavy volume. It closed in the middle of its range after briefly violating its 200 DMA line on an intra-day basis. This stock was first featured on Tuesday, December 05, 2006 in the CANSLIM.net Mid Day Breakouts Report (read here) with a $48.63 pivot point as it was gapping up and breaking out to a new all-time high close. In the weeks that followed, however, it failed to make significant price progress. Instead, it built a large base-on-base pattern. This stock's 50 DMA line carves though the middle of the 7-month base that has formed since its October 10, 2006 breakout. UA received its most recent detailed coverage in the Monday, March 19, 2007 CANSLIM.net After Market report (read here) when it was rallying above its 50 DMA line with gains on above average volume. Since then, the stock rallied to a new all-time high close $53.05 on April 10, 2007. However, volume, a critical component, dried up as the stock edged higher, revealing a lack of buying conviction coming from the institutional crowd. Then it pulled back towards its 50 DMA line again, yet it bounced encouragingly on above average volume at that important support level yesterday.
The company increased its earnings per share by a tepid +11% in the first quarter, lower than the +25% guideline for the "C" criteria. Its sales revenues rose +42%, but sequentially the dollar amount was lower than the prior two quarters. Normally, one would like to see a company increase its sales and earnings versus the year earlier by at least +25% in each quarterly comparison. The price/volume action today exemplifies how quickly fundamental news can impact share prices. Such volatility is common after earnings announcements. The company announced a softer than expected first quarter, and the stock gapped down, flashing a sell signal. Technically, it now is testing support at its longer-term 200 DMA line and also prior chart lows that form the lower boundary of its latest 7-month long base. The lower boundary of its longer term multi-month upward trendline (best seen on a weekly or monthly chart) is also coming into play as a key support level at this critical juncture. Investors may consider further weakness a more decisive sell signal, as many months of healthy action would be negated. Also, the overhead supply that was created while the stock traded higher can be likely to hinder its upward progress. Conversely, if the bulls manage to step up and promptly defend support, then higher prices are more likely to follow.
C A N S L I M | StockTalk | News | Chart | ![]() DGO | SEC | Zacks Reports
DGO | SEC | Zacks Reports

View all notes | Alert me of new notes | CANSLIM.net Company Profile
Leader Goes From Green Back to Yellow - Tuesday, April 03, 2007
Often, when a leading stock is setting up to breakout of a solid base it is highlighted in CANSLIM.net's Mid-Day Breakouts Report. The most relevant factors are noted in the report which allows prudent CANSLIM oriented investors to place the issue in their watch list. After doing any necessary backup research, the investor is prepared to act if and when the stock triggers a technical buy signal (breaks above its pivot point on more than +50% average turnover). In the event the stock fails to trigger a technical buy signal and its price declines then it will simply be removed from the watch list.
Under Armour, Inc. (UA +$1.11 or +2.08% to $52.28) enjoyed its second best close ever on Tuesday! This stock was first featured on Tuesday, December 5, 2006 in the CANSLIM.net Mid Day Breakouts Report (read here) with a $48.63 pivot point and a $51.06 maximum buy point as it was gapping up and breaking out to a new all-time high close. In the weeks that followed, however, this stock failed to make significant price progress and instead built a large two month base. Then on February 1, 2007 this stock gapped below its 50 DMA line (which was a very negative distribution day) for a considerable loss on high volume. It fell back towards its prior chart highs after reporting quarterly financial results. The stock traded -8% below its pivot point, likely prompting disciplined investors to sell, and it ultimately found support above its important prior chart highs ($43.50). After finding support above its prior chart highs, UA steadily rallied and quickly jumped back above its 50 DMA line. That action was highlighted in the March 19, 2007 CANSLIM.net After Market Report under the headline reading "Sports Apparel Maker Jumps Above 50 DMA" (read here). Since that recovery, the stock has steadily marched higher. It has risen above a 4-month downward sloping trendline, and it closed today -3.2% below its all-time chart high ($54.00 hit intra-day on December 18, 2006).
As a result of its recent technical improvement, CANSLIM.net has changed the stock's color coded status from Green back to Yellow. Its Earnings Per Share (EPS) rating is a near-best 98 and its Relative Strength (RS) rating is a respectable 82. If UA manages to rally for gains and trade above its new pivot point of $52.40 on at least +50% above average volume, a proper new technical buy signal would be triggered again. As always, it is of the utmost importance to have a smart defensive strategy in place, and the system's guidelines specify that it is crucial to sell a stock if it drops 7-8% below your purchase price.
C A N S L I M | StockTalk | News | Chart | ![]() DGO | SEC | Zacks Reports
DGO | SEC | Zacks Reports

View all notes | Alert me of new notes | CANSLIM.net Company Profile
Sports Apparel Maker Jumps Above 50 DMA - Monday, March 19, 2007
A very important technical tool that savvy investors have learned to incorporate in their technical analysis is the 50-day moving average (DMA) line. The 50 DMA line plays a pivotal role relative to a stock's price. If the price of a stock is above its 50 DMA then odds are that its 50 DMA will act as formidable support. Conversely, if the price is below its 50 DMA then the moving average acts as resistance. Healthy stocks sometimes trade under their 50 DMA lines briefly, but usually a strong candidate will promptly bounce and repair a 50 DMA violation. When a stock has violated its 50 DMA line and then lingers beneath it, the stock's outlook gets worse and worse as it spends a greater period of time trading under that important short-term average line. Once the 50 DMA line starts sloping downward it should also be acknowledged that the stock has been struggling for a while, and it might be time to reduce exposure and look for places to put that money to work in stronger buy candidates.
Under Armour, Inc. (UA +1.87 or 3.70% to $48.70) jumped above its 50 DMA line on above average volume after recently finding support near prior chart highs ($43.50). This stock was first featured on Tuesday, December 5, 2006 in the CANSLIM.net Mid Day Breakouts Report (read here) with a $48.63 pivot point as it was gapping up and breaking out to a new all-time high close. In the weeks that followed, however, this stock failed to make significant price progress and instead built a large two month base. As UA sliced through its 50 DMA line (which was negative) and was pulling back towards its prior chart highs after reporting their quarterly results, the action was highlighted in the February 5, 2007 CANSLIM.net After Market Report (read here). One month later, on March 5, 2007, UA retested those lows and promptly fought back to close at $43.70, which is above important prior chart highs of $43.50. Now that the stock has rallied back above its 50 DMA line it is important that it remain there. Any reversal back under the 50 DMA woud not bode well. Ideally, additional gains on heavier volume would be even more encouraging action to watch for as it attempts to work up through resistance due to overhead supply. Its Relative Strength (RS) rank has fallen under the 80+ guideline, however the stock is just under 10% from its 52-week high. UA is a decent candidate to have on your watch list, and if the market gets a solid follow-through day soon, look closely for a new technical buy signal.
C A N S L I M | StockTalk | News | Chart | ![]() DGO | SEC | Zacks Reports
DGO | SEC | Zacks Reports

View all notes | Alert me of new notes | CANSLIM.net Company Profile
Leader Pulling Back Toward Prior Chart Highs - Monday, February 05, 2007
Another important factor is the relationship between an uptrend and a stock's pivot point. Typically, stocks begin forming an uptrend after rising above their pivot point. In the event the upward trend is violated, the stock will generally be expected to continue falling until it can retest support. Initial support is often the 50 DMA, or its pivot point, whichever is higher.
Under Armour, Inc. (UA -0.53 or -1.16% to $45.27) has continued moving lower since releasing its Q4 financial results last week. This stock was first featured on Tuesday, December 5, 2006 in the CANSLIM.net Mid Day Breakouts Report (read here) with a $48.63 pivot point as it was gapping up and breaking out to a new all-time high close. In the weeks that followed, however, this stock failed to make significant price progress and instead built a large two month base.
Last Thursday, February 1, 2007, the company released its latest quarterly results, failing to exceed analysts' lofty estimates. As a result, the stock gapped down below its 50-day moving average (DMA) line and also exceeded its January lows, triggering some technical sell signals. In the process, the stock has traced out may also be considered as a technically bearish "island reversal" pattern, and it now faces formidable overhead supply up to the $52 range which can be expected to be a source of resistance in the weeks ahead. The stock was unable to promptly repair the damage of its 50 DMA violation, and it is also worrisome that its Relative Strength rank has quickly plunged to a 69, substantially lower than where it has resided for the past few months. Only investors with a very low cost basis might be able to justify staying with it as it continues to struggle. Now its next level of support is its prior chart highs in the $43.50 area (last summer) and its 200 DMA line (near $42). For the purposes of capital preservation, it is always of the utmost importance to unload your position if it has fallen 7-8% below your purchase price. If the stock shows better action later, it can always be re-purchased when bullish action is compelling enough to justify new buying efforts.
C A N S L I M | StockTalk | News | Chart | ![]() DGO | SEC | Zacks Reports
DGO | SEC | Zacks Reports

View all notes | Alert me of new notes | CANSLIM.net Company Profile
Leading Stock Violates 50 Line Support - Monday, January 22, 2007
A very important technical tool that savvy investors have learned to incorporate in their technical analysis is the 50-day moving average (DMA) line. The 50 DMA line plays a pivotal role relative to a stock's price. If the price of a stock is above its 50 DMA then odds are that its 50 DMA will act as formidable support. Conversely, if the price is below its 50 DMA then the moving average acts as resistance. Healthy stocks sometimes trade under their 50 DMA lines briefly, but usually a strong candidate will promptly bounce and repair a 50 DMA violation. When a stock has violated its 50 DMA line and then lingers beneath it, the stock's outlook gets worse and worse as it spends a greater period of time trading under that important short-term average line. Once the 50 DMA line starts sloping downward it should also be acknowledged that the stock has been struggling for a while, and it might be time to reduce exposure and look for places to put that money to work in stronger buy candidates.
Under Armour, Inc. (UA -$3.99 or -7.81% to $47.08) gapped down after Barron's released an article questioning the stock's valuation, and it sliced under its 50 DMA line with a considerable loss on nearly three times average volume. This stock was first featured on Tuesday, December 5, 2006 in the CANSLIM.net Mid Day Breakouts Report (read here) with a $48.63 pivot point. Since then, the stock spent several weeks consolidating near the $50 area and it stayed above its 50 day moving average (DMA) line.
A few weeks ago, UA breached the lower boundary of its upward trendline, but the stock found support promptly at its 50 DMA line. The note in CANSLIM.net's Featured Stocks Page today reads as follows- "G - Down almost -8% on almost 3 times average volume. Looks to be closing below where support was recently found at the 50 DMA triggering what is now a second recent sell signal. The first came on 01/03 as the stocks price broke its upward trendline (seen on a daily chart ) and was noted here. For investor's who decide to stick with this issue, some support now remains near $45 yet that is also near the 8% final stop loss area." Further details were posted in the CANSLIM.net Bulletin of 12/5/06 available here). Regardless of the stock's action, it is of the utmost importance to always protect your capital by selling a stock if drops 7-8% below your purchase price.
In cases where shares were bought at lower prices, and additional shares were bought at higher levels, the higher priced shares should be sold if the price has fallen more than 7-8% from the price paid. Shares owned at a lower cost basis may be held, however additional down days on heavier than average volume would raise additional concerns. A prompt repair of the 50 DMA violation could improve the outlook, but any more technical deterioration may prompt investors to sell to protect their interest.
C A N S L I M | StockTalk | News | Chart | ![]() DGO | SEC | Zacks Reports
DGO | SEC | Zacks Reports

View all notes | Alert me of new notes | CANSLIM.net Company Profile