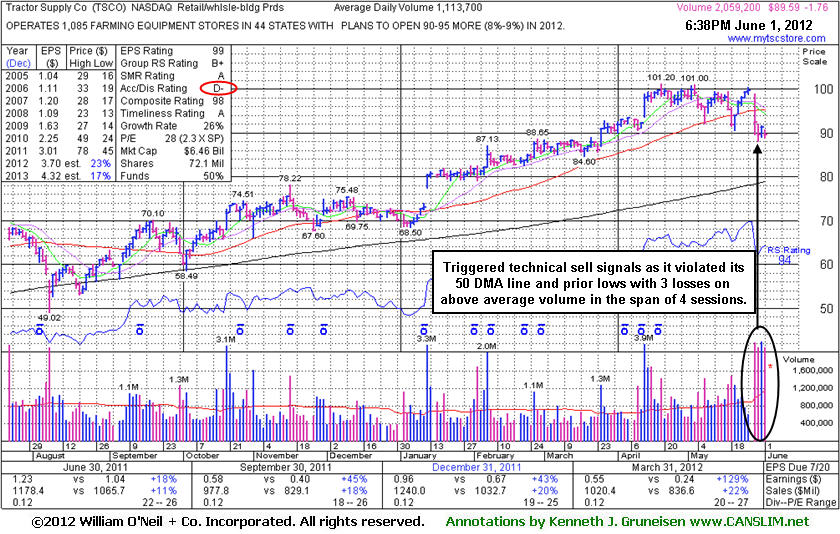
Distributional Action Brought Technical Damage This Week - Friday, June 01, 2012
Tractor Supply Co (TSCO -$1.76 or -1.93% to $89.59) was down again today for a 3rd loss with above average volume in the span of 4 sessions. It violated its 50-day moving average (DMA) line and prior lows triggering technical sell signals. It had not triggered a new (or add-on) technical buy signal in recent weeks while it encountered resistance in the $101 area. Its Accumulation/Distribution Rating is now a D- (see red circle), down from an A- when making its last appearance in this FSU section on 4/17/12 with an annotated graph under the headline "Extended From Base Posting 5th Straight Weekly Gain". It had encountered a handful of distribution days (losses with higher volume than the prior session) prior to this week's breakdown. Based on the weak action it will be dropped from the Featured Stocks list tonight.
Disciplined investors might not be wise to give even a long-time leader much opportunity to recover when the market is in an ugly correction. Odds are not favorable when 3 out of 4 stocks tend to move in the direction of the major averages, and regular readers of the market commentary surely have no question what direction the market (M criteria) has been heading lately.
TSCO had traded up more than +25% after it was highlighted in yellow in the 1/12/12 mid-day report (read here) with pivot point cited based on its 12/09/11 high plus 10 cents. Its "breakaway gap" was noted as one exception to the rule of buying stocks only trading within 5% of their prior chart highs, however, investors were reminded that risk increases the further one chases any stock from a sound base pattern. In 3 of the past 4 quarterly comparisons it showed better than +25% earnings increases satisfying C criteria. A slight downturn in FY '08 earnings is a minor flaw concerning the A criteria, but that has been followed by very strong growth, and its 3-5 year "Growth Rate" of +26% is solid. As indicated on the weekly graph below, the number of top-rated funds owning its shares has risen from 525 in Jun '11 to 654 in Mar '12, a reassuring trend concerning the I criteria.
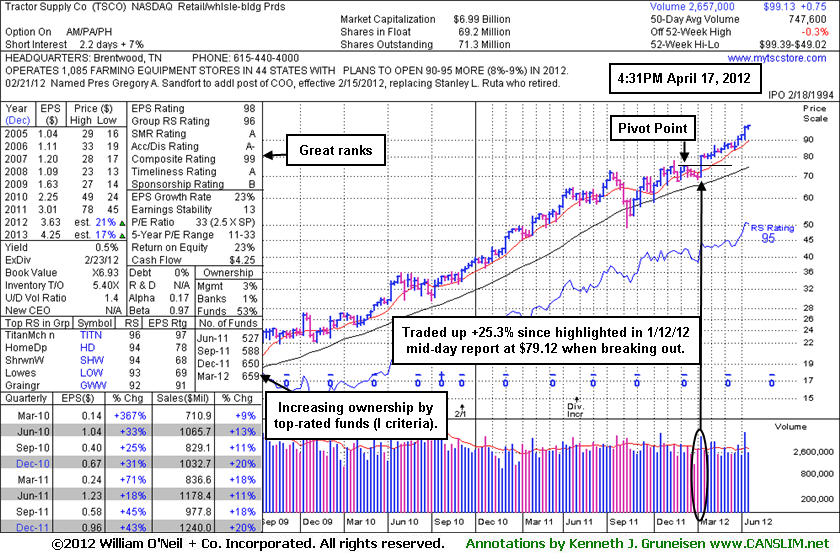
Extended From Base Posting 5th Straight Weekly Gain - Tuesday, April 17, 2012
Tractor Supply Co (TSCO +$1.12 or +1.14% to $99.13) is hovering at its all-time high today, stubbornly holding its ground following considerable gains with heavy volume after the company raised its guidance last week. It is on track for its 5th consecutive weekly gain and it is very extended from its prior base. Disciplined investors might watch for secondary buy points to possibly develop and be noted. Investors might also watch out for future sell signals and stand ready to protect profits, however it is well above its 50-day moving average (DMA) line that defines important support to watch on pullbacks. Its last appearance in this FSU section with an annotated daily graph was on 2/27/12 under the headline, "More Extended From Prior Base After Volume-Driven Gain", while posting a gain with +58% above average volume for a new all-time high (N criteria).TSCO is up +25.3% since it was highlighted in yellow in the 1/12/12 mid-day report (read here) with pivot point cited based on its 12/09/11 high plus 10 cents. A "breakaway gap" was again noted as the one exception to the rule of buying stocks only trading within 5% of their prior chart highs, however, investors were reminded that risk increases the further one chases any stock from a sound base pattern. Buying an extended stock can more often lead to an ordinary pullback prompting disciplined investors into selling to limit their loss at -7% per the investment system's strict sell rule.
In 3 of the past 4 quarterly comparisons it showed better than +25% earnings increases satisfying C criteria. A slight downturn in FY '08 earnings is a minor flaw concerning the A criteria, but that has been followed by very strong growth, and its 3-5 year "Growth Rate" of +23% is solid. As indicated on the weekly graph below, the number of top-rated funds owning its shares has risen from 527 in Jun '11 to 659 in Mar '12, a reassuring trend concerning the I criteria.
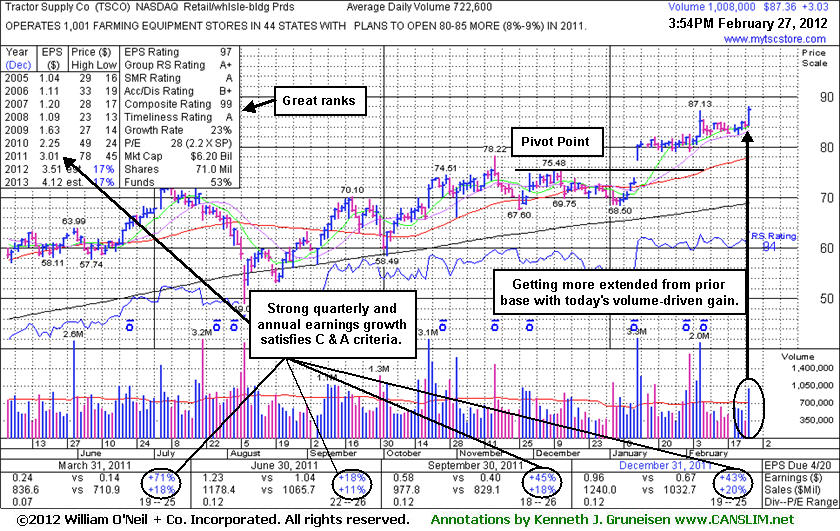
More Extended From Prior Base After Volume-Driven Gain - Monday, February 27, 2012
Tractor Supply Co (TSCO +$3.09 or +3.66% to $87.42) was up today with +58% above average volume for a new all-time high, getting more extended from its prior base pattern. Its 50-day moving average (DMA) line defines support to watch on pullbacks. Its last appearance in this FSU section with an annotated graph was on 1/12/12 under the headline, "Following "Breakaway Gap" No Resistance Remains", as it hit new 52-week and all-time highs (N criteria). It was highlighted in yellow in the 1/12/12 mid-day report (read here) with pivot point cited based on its 12/09/11 high plus 10 cents. A breakaway gap has been noted as the one exception to the rule of buying stocks only trading within 5% of their prior chart highs, however risk increases the further one chases any stock that an ordinary pullback may prompt disciplined investors into limiting their loss at -7% per the investment system's strict sell rule. At this point, disciplined investors might watch for secondary buy points to possibly develop and be noted.
In 3 of the past 4 quarterly comparisons it showed better than +25% earnings increases satisfying C criteria. A slight downturn in FY '08 earnings is a minor flaw concerning the A criteria, but that has been followed by very strong growth, and its 3-5 year "Growth Rate" of +23% is solid. The number of top-rated funds owning its shares has risen from 490 in Mar '11 to 629 in Dec '11, a reassuring trend concerning the I criteria.
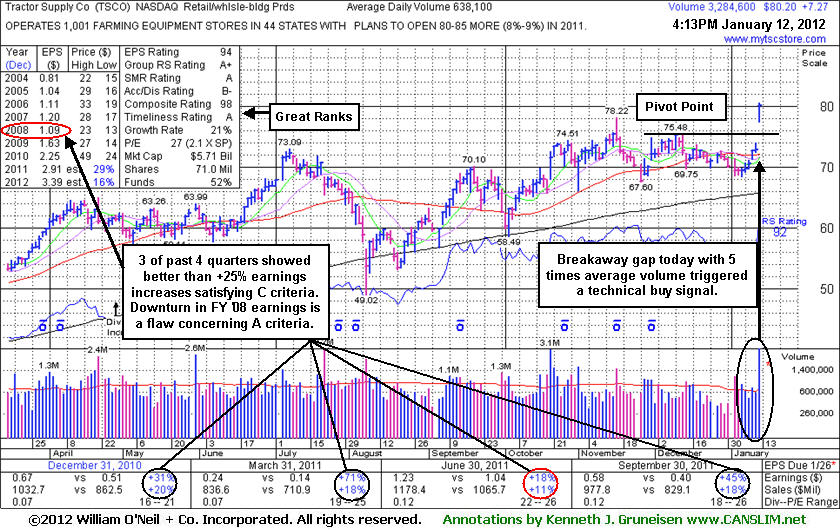
Following "Breakaway Gap" No Resistance Remains - Thursday, January 12, 2012
Tractor Supply Co (TSCO +$7.33 or +10.05% to $80.26) hit new 52-week and all-time highs (N criteria) after a considerable "breakaway gap" today, rallying for its 6th consecutive gain. It was highlighted in yellow in the mid-day report (read here) with pivot point cited based on its 12/09/11 high plus 10 cents. A breakaway gap is the one noted exception to the rule of buying stocks only trading within 5% of their prior chart highs, however risk increases the further one chases any stock that an ordinary pullback may prompt disciplined investors into limiting their loss at -7% per the investment system's strict sell rule.
In 3 of the past 4 quarterly comparisons it showed better than +25% earnings increases satisfying C criteria. A slight downturn in FY '08 earnings is a minor flaw concerning the A criteria, but that has been followed by very strong growth, and its 3-5 year "Growth Rate" of +21% is solid. The number of top-rated funds owning its shares has risen from 490 in Mar '11 to 598 in Dec '11, a reassuring trend concerning the I criteria.
TSCO had consolidated under its 50-day moving average (DMA) line from its prior high. That old high was hit when last noted in the 11/16/11 mid-day report. -"Reported earnings +45% on +18% sales revenues for the quarter ended September 30, 2011 versus the year ago period. Reported earnings +18% on +11% sales revenues for the quarter ended June 30, 2011 versus the year ago period, below the investment system's guidelines, however its quarterly and annual earnings history (C and A criteria) has otherwise been strong enough to be considered a worthy candidate under the fact-based investment system. TSCO was long ago featured in the June '03 CANSLIM.net News."