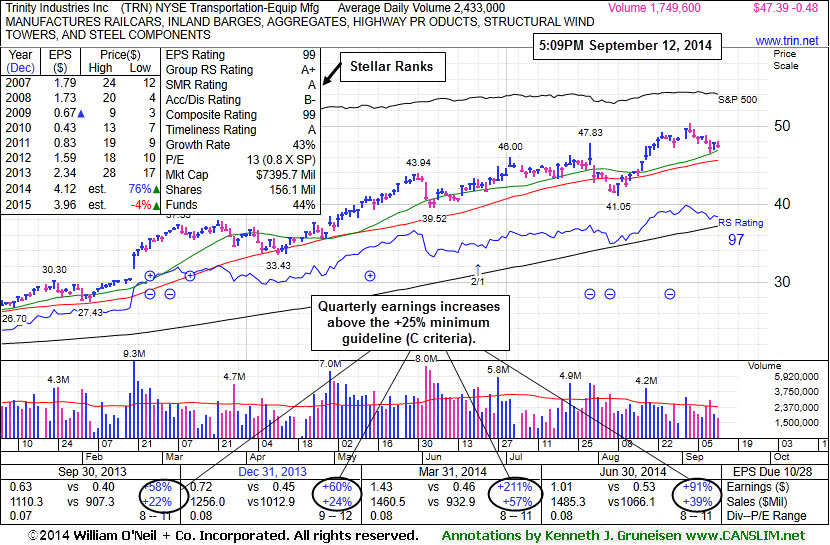
Fundamentals remain strong after it reported earnings +91% on +39% sales revenues for the Jun '14 quarter, continuing its streak of strong quarterly earnings increases above the +25% minimum earnings guideline (C criteria). Annual earnings (A criteria) have improved following a downturn in FY '08-10.
TRN traded up as much as +34.35% since first highlighted in yellow in the 4/30/14 mid-day report report (read here). Disciplined investors avoid chasing stocks extended more than +5% above prior highs and they always limit losses by selling any stock that falls more than -7% from their purchase price.
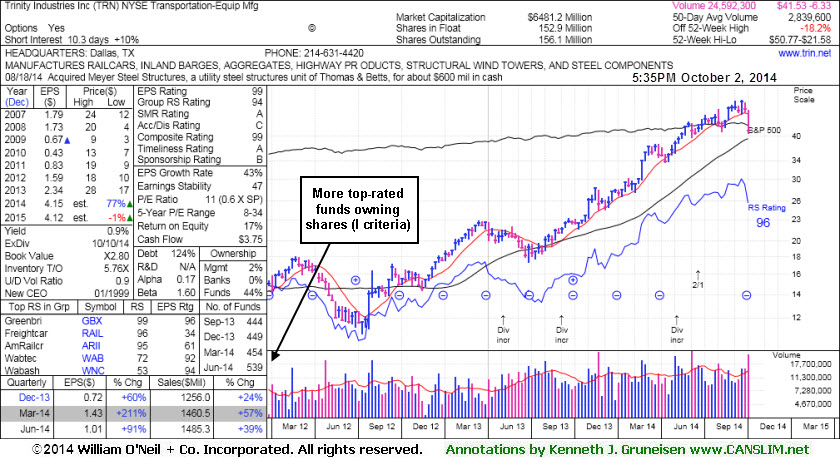
The number of top-rated funds owning its shares rose from 455 in Sep '13 to 539 in Jun '14, a reassuring sign concerning the I criteria. Its supply of shares outstanding (S criteria) was doubled as a 2:1 split was effective as of 6/20/14.
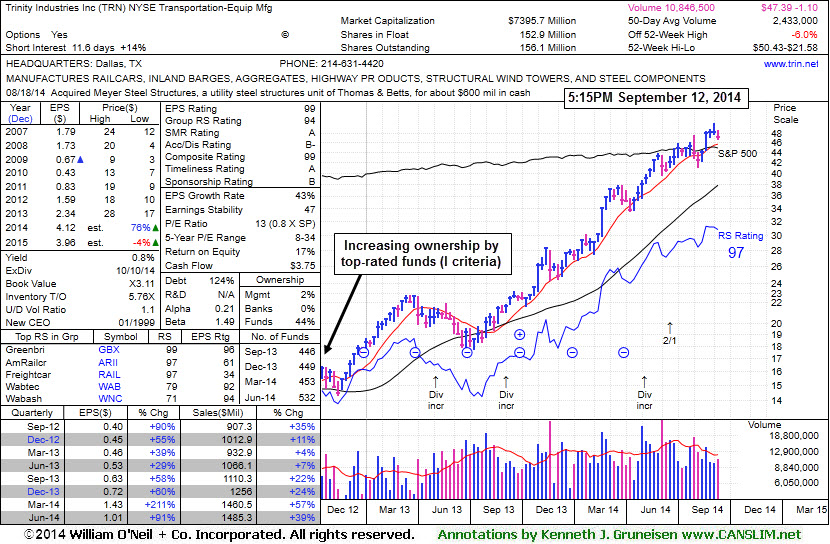
TRN traded up as much as +33.4% since first highlighted in yellow in the 4/30/14 mid-day report report (read here). Disciplined investors avoid chasing stocks extended more than +5% above prior highs and they always limit losses by selling any stock that falls more than -7% from their purchase price.
The number of top-rated funds owning its shares rose from 455 in Sep '13 to 532 in Jun '14, a reassuring sign concerning the I criteria. Its supply of shares outstanding (S criteria) was doubled as a 2:1 split was effective as of 6/20/14.
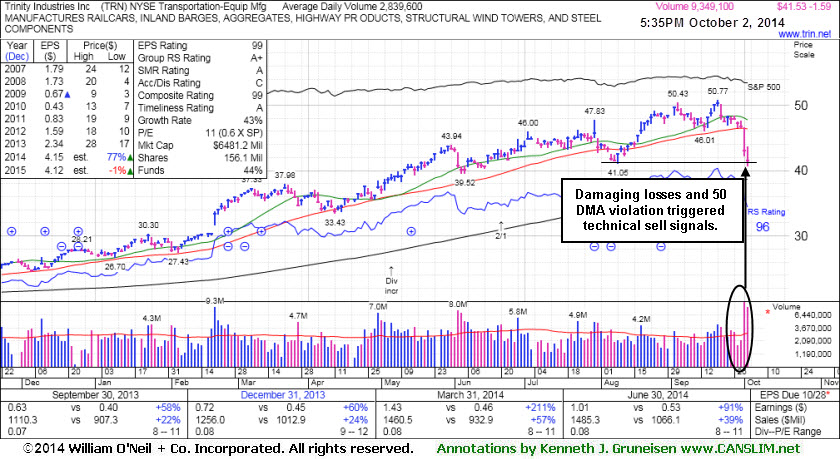
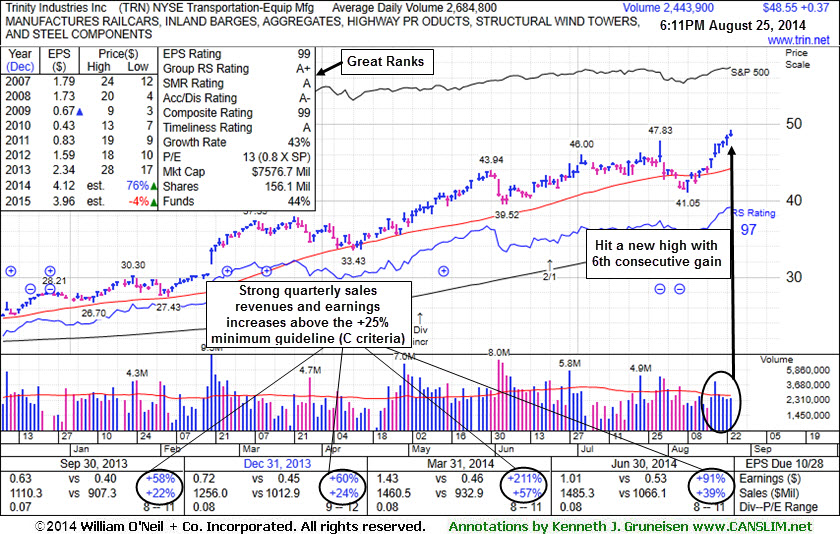
Trinity Industries Inc (TRN +$0.37 or +0.77% to $48.55) hit another new 52-week high with today's 6th consecutive gain. It has not formed a sound base. The high-ranked Transportation - Equipment Manufacturing firm was last shown in this FSU section on 7/28/14 with annotated graphs under the headline, "Earnings News Due Following Tuesday's Close". It reported earnings +91% on +39% sales revenues for the Jun '14 quarter, continuing its streak of strong quarterly earnings increases above the +25% minimum earnings guideline (C criteria). Annual earnings (A criteria) have improved following a downturn in FY '08-10.
TRN traded up as much as +30.1% since first highlighted in yellow in the 4/30/14 mid-day report report (read here). Disciplined investors avoid chasing stocks extended more than +5% above prior highs and they always limit losses by selling any stock that falls more than -7% from their purchase price.
Its 50-day moving average (DMA) line ($44.16) defines near-term support to watch. Subsequent deterioration below that important short-term average would raise concerns and trigger technical sell signals.
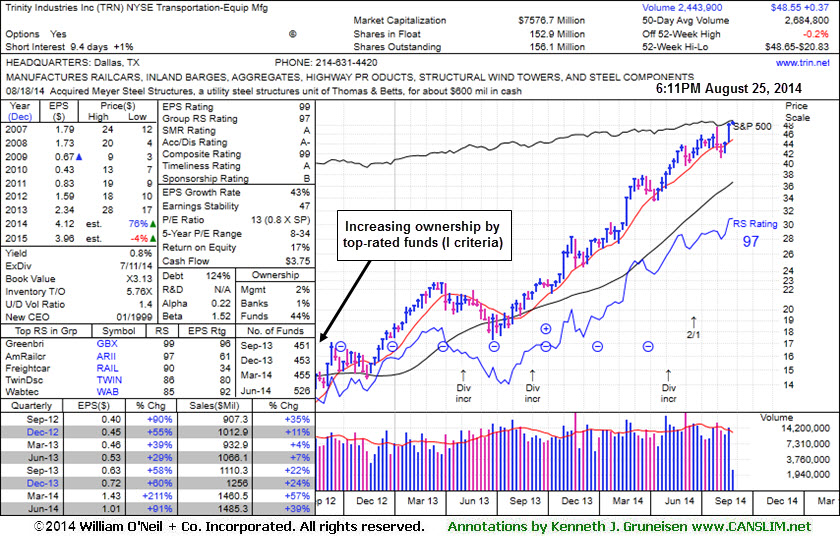
The number of top-rated funds owning its shares rose from 455 in Sep '13 to 526 in Jun '14, a reassuring sign concerning the I criteria. Its supply of shares outstanding (S criteria) was doubled as a 2:1 split was effective as of 6/20/14.
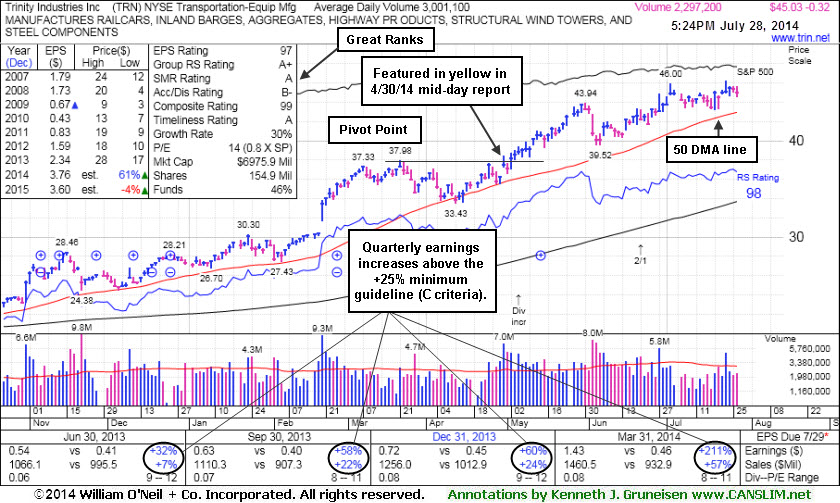
Trinity Industries Inc (TRN -$0.32 or -0.71% to $45.03) is perched within close striking distance of a new 52-week high. It is extended from its prior base, and its 50-day moving average (DMA) line ($42.95) defines near-term support to watch. Subsequent deterioration below that important short-term average would raise concerns and trigger technical sell signals.
Keep in mind that volume and volatility often increase near earnings news and it is due to report Jun '14 quarterly results after the close on Tuesday. It has earned high ranks and reported earnings +213% on +57% sales revenues for the Mar '14 quarter. Prior quarterly comparisons were above the +25% minimum earnings guideline (C criteria). Annual earnings (A criteria) have improved following a downturn in FY '08-10.
The high-ranked Transportation - Equipment Manufacturing firm was last shown in this FSU section on 7/08/14 with annotated graphs under the headline, "Bullish Up/Down Volume and Increasing Institutional Ownership". TRN traded up as much as +22.59% since first highlighted in yellow in the 4/30/14 mid-day report report (read here). Disciplined investors avoid chasing stocks extended more than +5% above prior highs and they always limit losses by selling any stock that falls more than -7% from their purchase price.
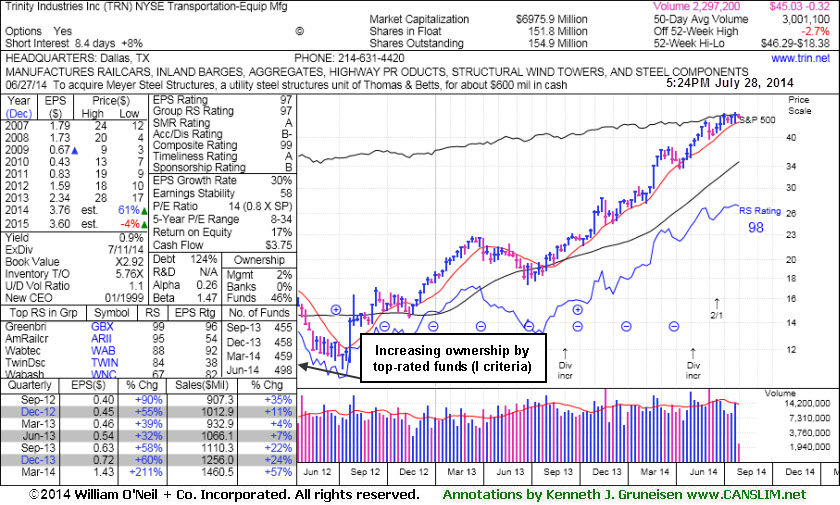
The number of top-rated funds owning its shares rose from 455 in Sep '13 to 498 in Jun '14, a reassuring sign concerning the I criteria. Its supply of shares outstanding (S criteria) was doubled as a 2:1 split was effective as of 6/20/14.
TRN traded up as much as +20.9% since first highlighted in yellow in the 4/30/14 mid-day report report (read here). Disciplined investors avoid chasing stocks extended more than +5% above prior highs and they always limit losses by selling any stock that falls more than -7% from their purchase price.
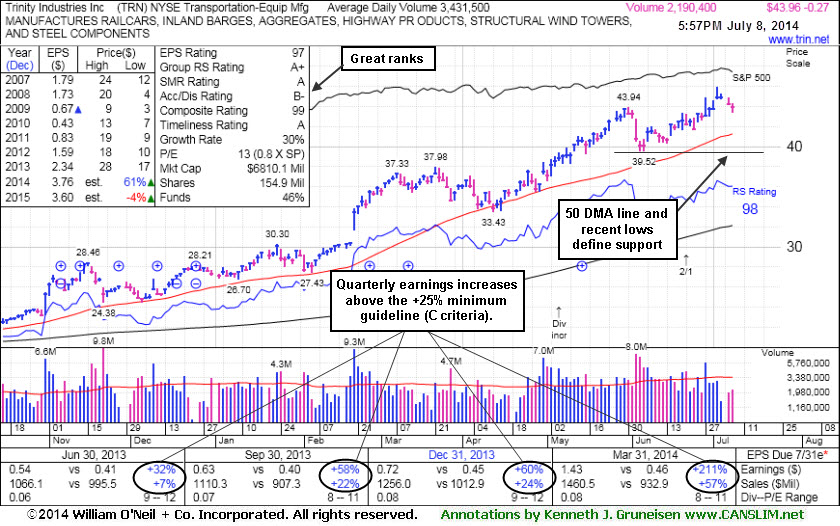
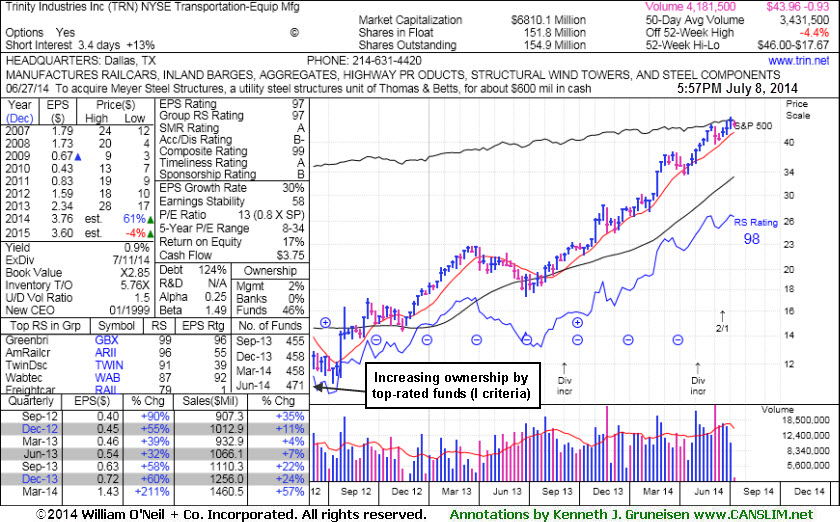
It has earned high ranks and reported earnings +213% on +57% sales revenues for the Mar '14 quarter. Prior quarterly comparisons were above the +25% minimum earnings guideline (C criteria). Annual earnings (A criteria) have improved following a downturn in FY '08-10. The number of top-rated funds owning its shares rose from 455 in Sep '13 to 471 in Jun '14, a reassuring sign concerning the I criteria. Its current Up/Down Volume Ratio of 1.5 is an unbiased indication that its shares have been under accumulation over the past 50 days. Its supply of shares outstanding (S criteria) was doubled as a 2:1 split was effective as of 6/20/14.
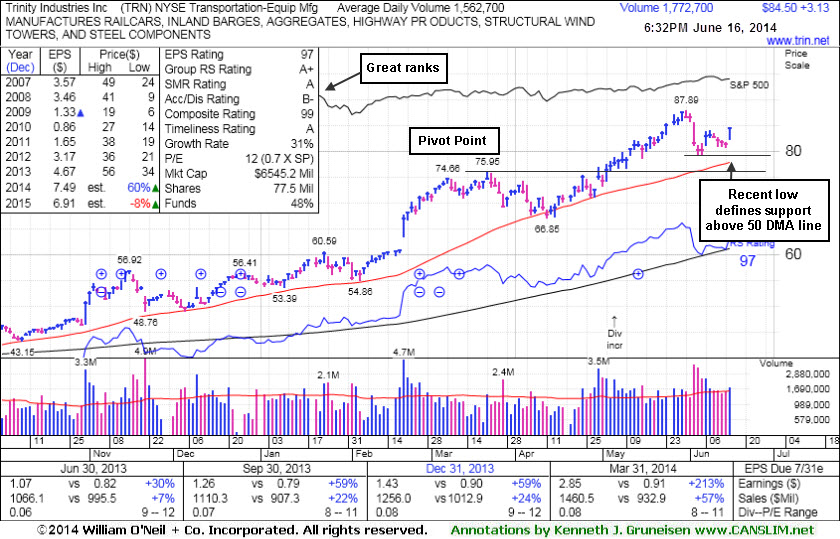
Trinity Industries Inc (TRN +$3.13 or +3.85% to $84.50) gapped up today for a solid gain and finished near the session high, ending a streak of 4 consecutive losses. Recent lows define near-term support that comes into play above its 50-day moving average (DMA) line ($77.79). Subsequent deterioration below those levels would raise concerns and trigger technical sell signals.
TRN traded up as much as +15.57% since first highlighted in yellow in the 4/30/14 mid-day report report (read here). Disciplined investors avoid chasing stocks extended more than +5% above prior highs and they always limit losses by selling any stock that falls more than -7% from their purchase price. The high-ranked Transportation - Equipment Manufacturing firm was last shown in this FSU section on 6/02/14 with annotated graphs under the headline, "Extended From Prior Base After +15% Rally in One Month".
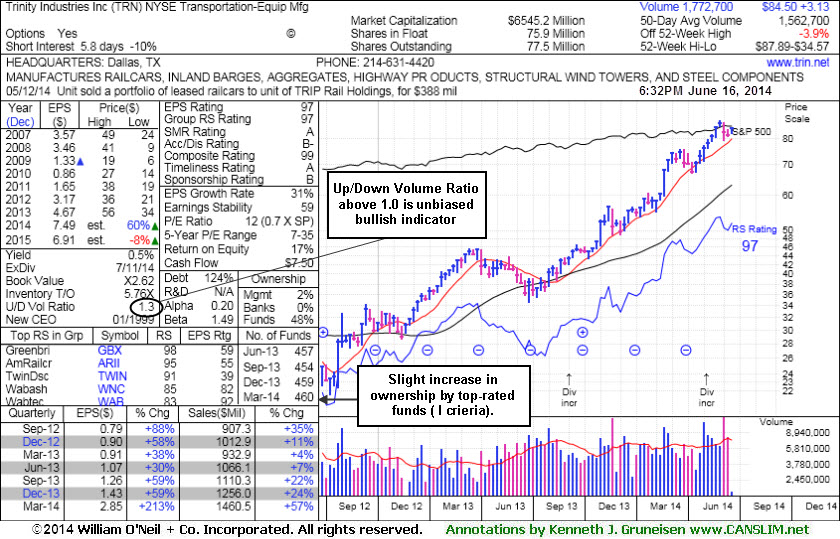
It has earned high ranks and reported earnings +213% on +57% sales revenues for the Mar '14 quarter. Prior quarterly comparisons were above the +25% minimum earnings guideline (C criteria). Annual earnings (A criteria) have improved following a downturn in FY '08-10. Its current Up/Down Volume Ratio of 1.3 is an unbiased indication that its shares have been under accumulation over the past 50 days. Its fairly small supply of 77.5 million shares outstanding (S criteria) can contribute to greater price volatility in the event of institutional buying or selling.
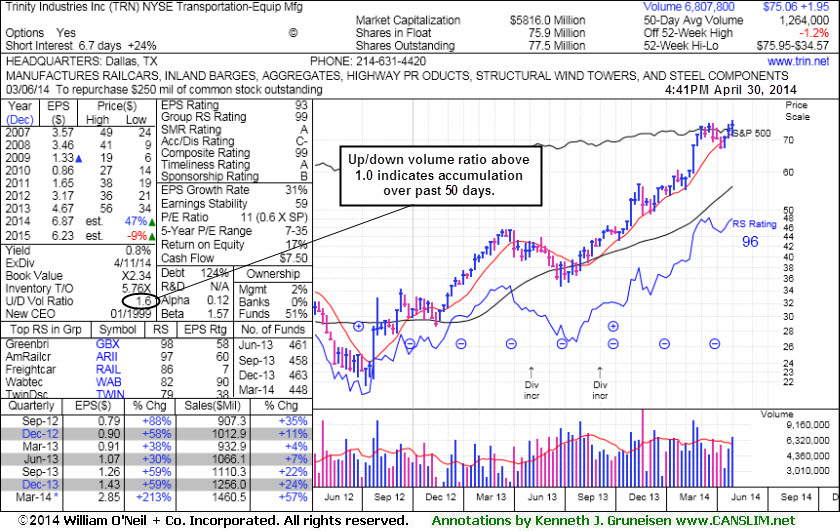
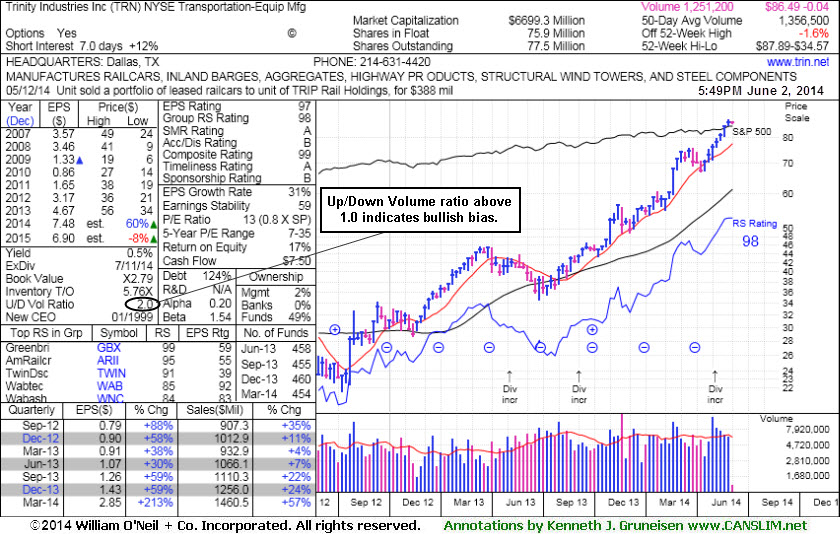
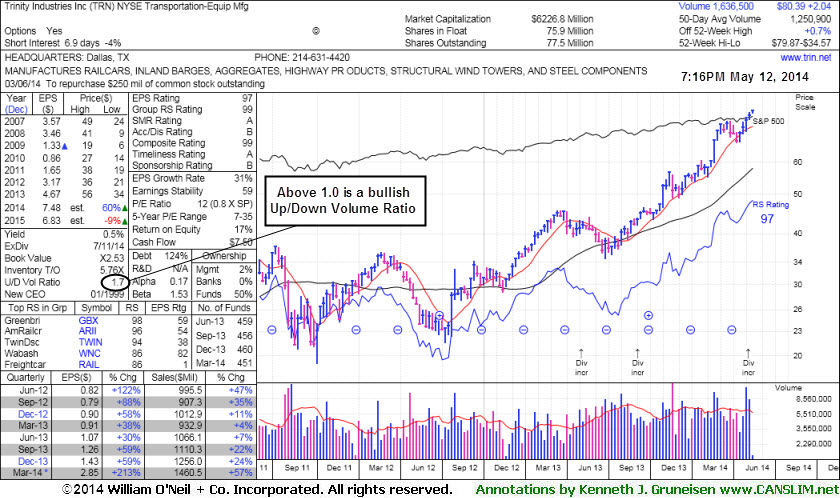
TRN was last shown in this FSU section on 5/12/14 with annotated graphs under the headline, "Rose Beyond "Max Buy" Level With 7th Consecutive Gain". The Transportation - Equipment Manufacturing firm reported earnings +213% on +57% sales revenues for the Mar '14 quarter, and prior quarterly comparisons were above the +25% minimum earnings guideline (C criteria). Annual earnings (A criteria) have improved following a downturn in FY '08-10. Its current Up/Down Volume Ratio of 2.0 is an unbiased indication that its shares have been under accumulation over the past 50 days.
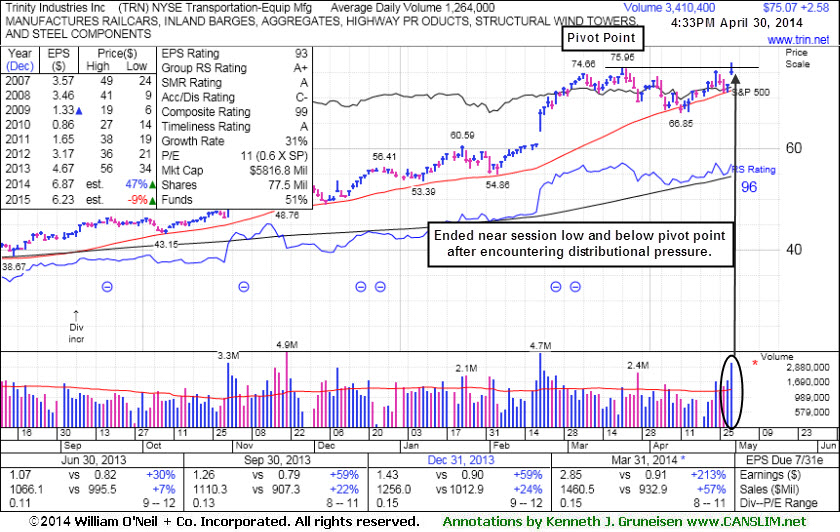
TRN was last shown in this FSU section on 4/30/14 with annotated graphs under the headline, "Finished Near Session Lows After Encountering Distributional Pressure", after highlighted in yellow with pivot point cited based on its 3/21/14 high plus 10 cents in the earlier mid-day report (read here).Prior highs in the $75-76 area define near-term support to watch on pullbacks. Disciplined investors avoid chasing stocks extended more than +5% above prior highs and they always limit losses by selling any stock that falls more than -7% from their purchase price.
The Transportation - Equipment Manufacturing firm reported earnings +213% on +57% sales revenues for the Mar '14 quarter, and prior quarterly comparisons were above the +25% minimum earnings guideline (C criteria). Annual earnings (A criteria) have improved following a downturn in FY '08-10. It found support at its 50-day moving average (DMA) line recently while making gradual progress. Its current Up/Down Volume Ratio of 1.7 is an unbiased indication that its shares have been under accumulation over the past 50 days.
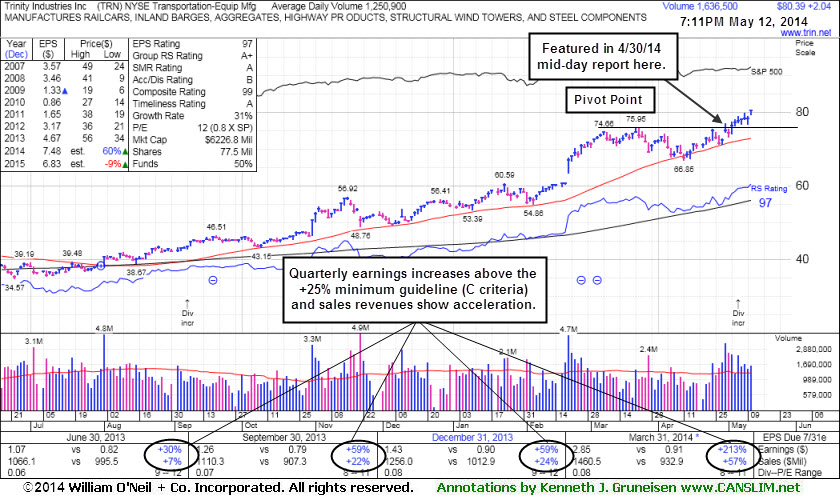
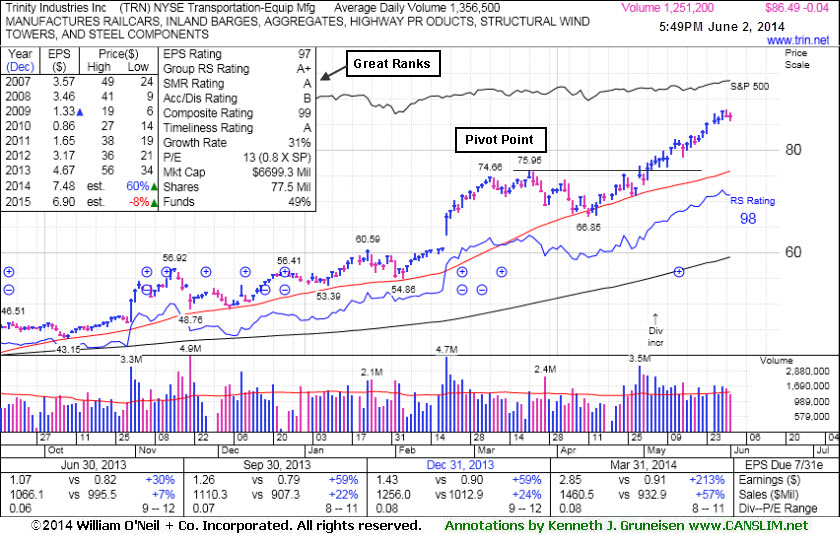
Trinity Industries Inc (TRN +$3.08 or +4.24% to $75.57) was highlighted in yellow with pivot point cited based on its 3/21/14 high plus 10 cents in the earlier mid-day report (read here). It gapped up today hitting a new 52-week high but finished near the session low after encountering distributional pressure. A strong close above the pivot point could have clinched a technical buy signal.
The Transportation - Equipment Manufacturing firm reported earnings +213% on +57% sales revenues for the Mar '14 quarter, and prior quarterly comparisons were above the +25% minimum earnings guideline (C criteria). Annual earnings (A criteria) have improved following a downturn in FY '08-10. It found support at its 50-day moving average (DMA) line recently while making gradual progress. Its current Up/Down Volume Ratio of 1.6 is an unbiased indication that its shares have been under accumulation over the past 50 days.