Often, when a leading stock is setting up to breakout of a solid base it is highlighted in CANSLIM.net's Mid-Day Breakouts Report. The most relevant factors are noted in the report which alerts prudent CANSLIM oriented investors to place the issue in their watch list. After doing any necessary backup research, the investor is prepared to act after the stock triggers a technical buy signal (breaks above its pivot point on more than +50% average turnover) but before it gets too extended from a sound base. In the event the stock fails to trigger a technical buy signal and its price declines then it will simply be removed from the watch list. Disciplined investors know to buy as near as possible to the pivot point and avoid chasing stocks after they have rallied more than +5% above their pivot point. It is crucial to always limit losses whenever any stock heads the wrong direction, and disciplined investors sell if a struggling stock ever falls more than -7% from their purchase price.
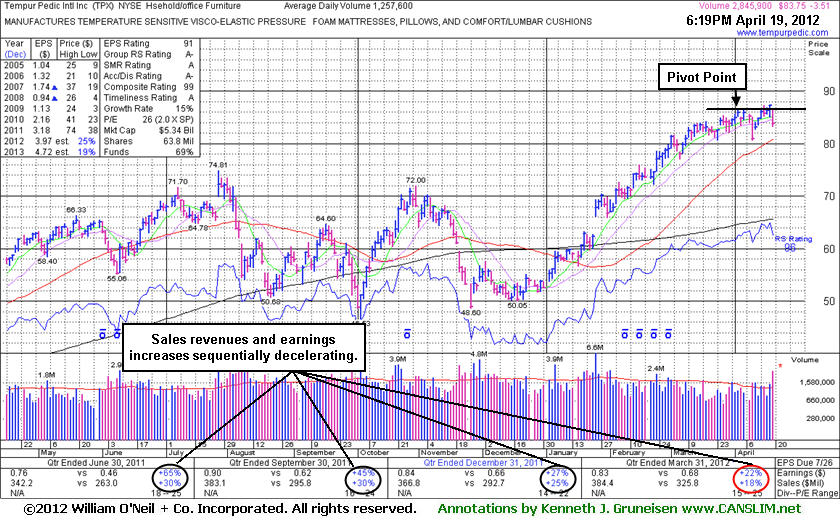
Tempur Pedic International Inc. (TPX -$3.51 or -4.02% to $83.75) fell today ahead of its earnings report. Disciplined investors know that no advantage comes to jumping in "early" without a reassuring burst of fresh institutional buying demand confirming a proper technical buy signal. After the close it reported earnings +22% on +18% sales revenues for the quarter ended March 31, 2012 versus the year ago period. That marked its weakest increases in years. It also emphasized the deceleration in its growth rate illustrated on its graph below which shows sequentially smaller increases. The company also issued disappointing guidance with its earnings release, and it traded down substantially in the after-hours. Had it produced better earnings, stronger technical action may have led to a meaningful advance.
Its prior gain lacked great volume conviction as it wedged to a new high. TPX was then featured in yellow in today's mid-day report (read here) while pulling back. Its prominent appearance came with the following important note - "Due to report earnings after the close today. It has shown strong sales revenues and earnings increases in quarterly comparisons through Dec '11 and its annual earnings growth has been strong since a downturn in FY '08. Perched near 52-week and all-time highs hit on the prior session, no overhead supply remains to act as resistance. Since February it has been gradually wedging into new high territory without great volume conviction behind its gains. Tight closes on its weekly chart may be considered an advanced "3 weeks tight". Color code is changed to yellow with pivot point cited based on its 4/03/12 high plus 10 cents, and a volume-driven gain above its pivot point is still necessary to trigger a buy signal."
Tempur Pedic International Inc. (TPX -$0.71 or -3.20% to $21.51) violated its 50-day moving average on Friday as sellers showed up and forcefully overpowered the bulls, sending it below its 50-day moving average line on above average volume. This was its third loss on above average volume in the past ten trading sessions (see circled area on the DailyGraph ® below), and meanwhile there hasn't been a gain on above average volume since June 13th. TPX broke out of a 5-month base on May 24th, 2005, however volume was below average at that time. On May 25th and 26th there was sufficient volume behind its gains, and in the following few weeks it went on to advance +14.2% to $25.00. It spent a few sessions consolidating the gains, then pulled back and retested its pivot point. On June 24th, exactly one month after TPX broke out, it pulled back and tested its 50-day moving average line. Buyers quickly showed up and sent TPX higher, allowing it to close that session in the upper half of its range. It spent a few sessions moving sideways, then sellers showed up again and sent prices back down into a range just above its prior base. It had nearly negated its most recent breakout, yet it still fought to stay above its 50 DMA line. However, notice that in recent weeks when the bulls showed up, light volume on its gains revealed less convincing demand from institutional investors.
A stock that pulls back on light volume toward its 50 DMA average line is considered healthy as long as it is able to find support and ultimately rally back toward its old highs. A stock that pulls back on above average volume toward its 50 DMA and is unable to rally is not desirable. Furthermore, concern increases greatly when a stock exhibits these characteristics and then ultimately pierces its 50 DMA line on above average volume as TPX did on Friday. Whenever losses exceed 7-8% all cautious and disciplined investors should not fight the tape, but move to the sidelines until the stock reasserts its bullish posture. The only small comfort to those who may still be holding TPX is that it managed to improve from the session low to close Friday's session 5 cents above its high close of $21.46 on January 10th, 2005, an old chart high of some technical significance. A close under that mark would clearly negate its May-June gains and have the stock falling back into its prior base.

C A N S L I M | StockTalk | News | Chart | SEC | Zacks Reports