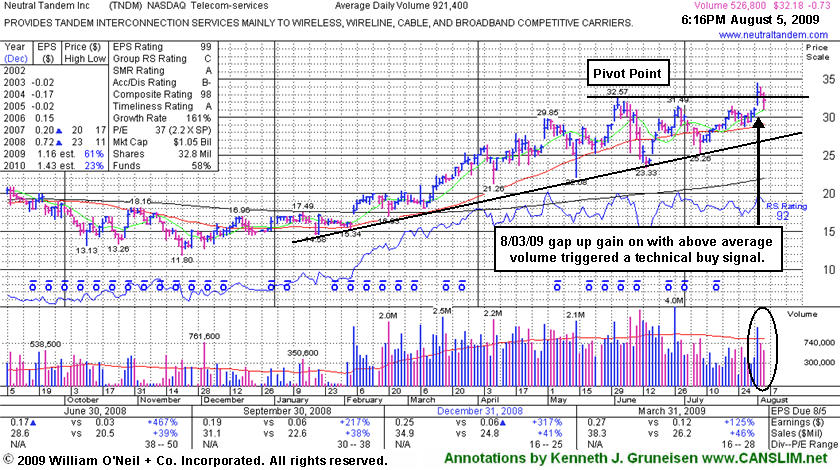
Neutral Tandem Inc (TNDM -$0.73 or -2.22% to $32.18) is consolidating on lighter volume toward prior chart highs. It gapped up on 8/03/09 for a considerable gain on more than +50% above average volume and a new all-time high, triggering a technical buy signal. It is due to report earnings before Thursday's opening bell. A recent newspaper article suggested its June 29th high ($31.49) was "an adequate buy point." It rallied above that prior peak from a 5-week flat base, but more significantly, it also cleared its resistance level at its June 2nd high of $32.57. Its color code was changed to yellow with new pivot point cited based upon its 52-week high plus ten cents.
Subsequent deterioration into its prior base would raise concerns and negate its latest breakout. After prior chart highs in the $31-32 area, its 50-day moving average line and then its multi-month upward trendline are the next important support levels where violations would trigger additional sell signals. Disciplined investors always limit losses by selling any stock if it falls more than -7% from their buy price. TNDM has traded up as much as +82.95% since first featured at $18.89 in the 3/02/09 Mid-Day BreakOuts Report (read here).
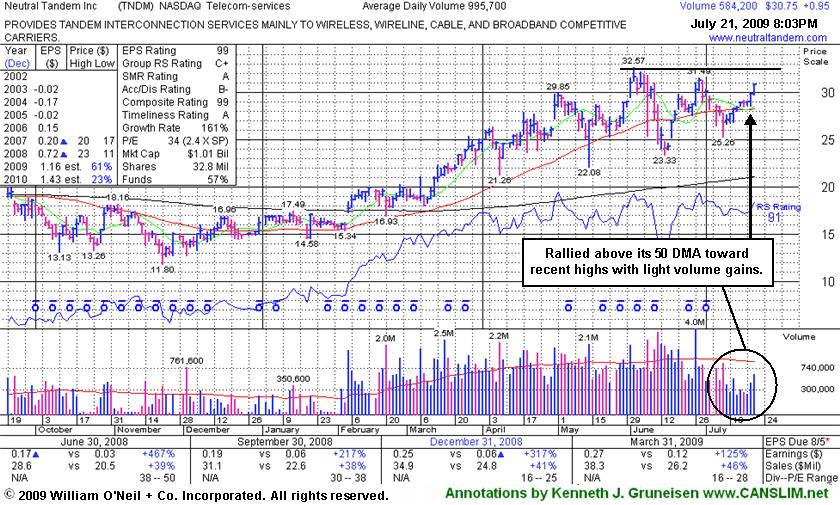
Neutral Tandem Inc (TNDM +$0.95 or +3.19% to $30.75) has recently rallied above its 50-day moving average (DMA) line, rising toward recent highs with light volume gains. Its prior rebound above the 50 DMA line ran out of steam short of its prior chart highs. TNDM had traded up as much as +72.42% since first featured at $18.89 in the 3/02/09 Mid-Day BreakOuts Report (read here).
Technical sell signals and heavy distribution completely negated its latest breakout above the previously cited pivot point of $29.85 based upon the stock's May 1st high. Its choppy consolidation over the past 6-weeks since it reached an all-time high of $32.57 is not a very sound looking base. This high-ranked leader should remain on an active watch list until a sound new base has formed. Technically, a gain above its most recent chart high ($31.49 on 6/29/09) with volume conviction would help improve its near-term outlook. Meanwhile, any subsequent deterioration below its 50 DMA line would raise more serious concerns.
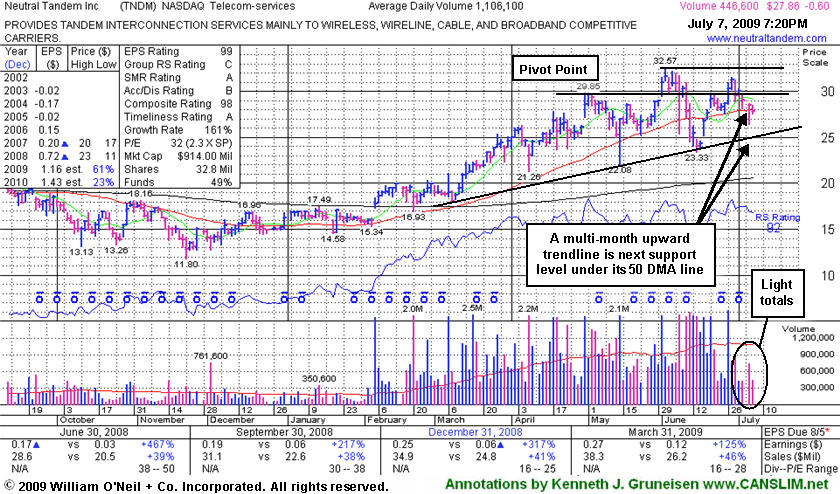
Neutral Tandem Inc (TNDM -$0.60 or -2.11% to $27.86) quietly consolidated to a close today just under its 50-day moving average (DMA) line again. Its recent rebound ran out of steam short of its prior chart highs. Technical sell signals and heavy distribution completely negated its latest breakout above the pivot point of $29.85 based upon the stock's May 1st high, and it is slumping back into its prior base and below that important short-term average once again. TNDM traded up as much as +72.42% since first featured at $18.89 in the 3/02/09 Mid-Day BreakOuts Report (read here).
Its choppy consolidation over the past 5-weeks since it reached an all-time high of $32.57 still offers no ideal entry point within the investment system's guidelines. This high-ranked leader should remain on an active watch list until a sound new base has formed. Meanwhile, a multi-month upward trendline identifies the next important support level to watch.
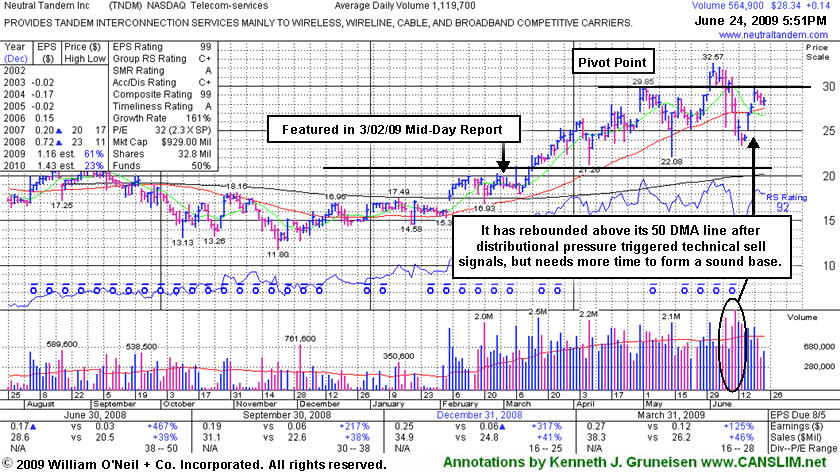
Neutral Tandem Inc (TNDM +$0.14 or +0.50% to $28.34) is quietly consolidating after rebounding above its 50-day moving average (DMA) line. Disciplined investors know that a sound base needs to form before new buying efforts might be justified under the investment system's guidelines. It recently triggered technical sell signals as heavy distribution completely negated its latest technical breakout and led to a 50 DMA violation. Its latest pivot point of $29.85 was based upon the stock's May 1st high. TNDM traded up as much as +72.42% since first featured at $18.89 in the 3/02/09 Mid-Day BreakOuts Report (read here).
Concerns had been raised under the headline "Second Distribution Day This Week For Telecom Services Leader" in TNDM's last appearance in this Featured Stock Update section on June 10, 2009 (read here). In that detailed summary the following was noted - "For investors who miss a proper buy point whenever any high-ranked stock breaks out from a first stage base, a stock's first pullback to its 50 DMA line (or its 10-week average when viewing a weekly chart) may offer an ideal secondary buy point. Odds of success taper off upon each subsequent test of support at that important short-term average line." Although the stock has already repaired its latest 50 DMA violation, its choppy chart now offers no ideal entry point within the investment system's guidelines. This high-ranked leader should remain on an active watch list until a sound new base has formed.
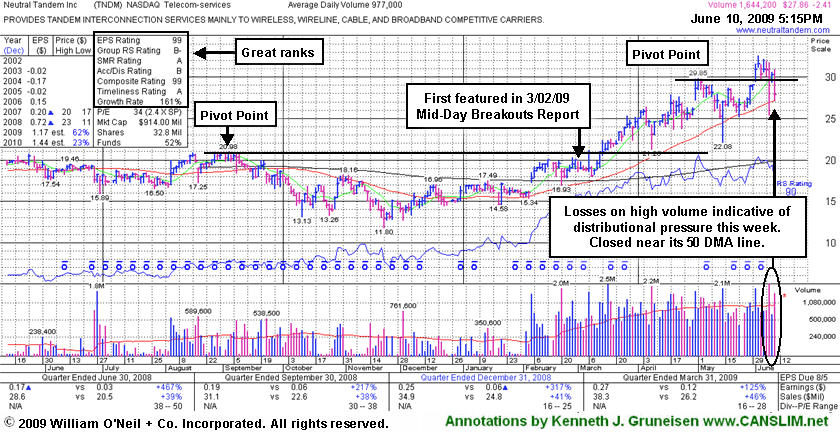
Neutral Tandem Inc (TNDM -$2.41 or -7.99% to $27.86) suffered another considerable loss on above average volume and closed near its session low today, finishing just above its 50-day moving average (DMA) line. This week's second dose of heavy distribution has completely negated its latest technical breakout as the stock closed below its prior high close ($29.64 on 5/01/09). Its color code was changed to green based on the worrisome technical deterioration into its prior base. Meanwhile, any subsequent loss leading to a close below its 50 DMA line would raise more serious concerns and trigger a technical sell signal. Wild whipsaw action intra-day on 6/08/09 likely triggered many open "sell stop" orders. It impressive "positive reversal" on 5/14/09 was noted as a sign of prompt institutional support arriving. It had gapped up on 4/30/09 for a new all-time high after reporting solid quarterly sales and earnings increases.
TNDM traded up as much as +72.42% since first featured at $18.89 in the 3/02/09 Mid-Day BreakOuts Report (read here). Its latest pivot point of $29.85 was based upon the stock's May 1st high. For investors who miss a proper buy point whenever any high-ranked stock breaks out from a first stage base, a stock's first pullback to its 50 DMA line (or its 10-week average when viewing a weekly chart) may offer an ideal secondary buy point. Odds of success taper off upon each subsequent test of support at that important short-term average line. Disciplined investors know that a sound base needs to form before new buying efforts might be justified under the investment system's guidelines. As always, investors should sell to limit losses if ever any stock falls more than -7% from their buy price.
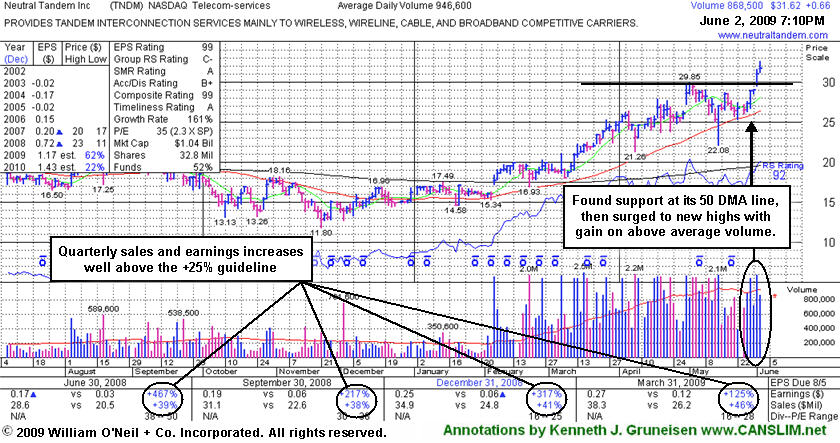
Neutral Tandem Inc (TNDM +$0.66 or +2.13% to $31.62) gapped up again today for a gain on lighter volume to another new all-time high. Its color code has been changed to green after its close above its "max buy" level. It recently found prompt support near its 50-day moving average (DMA) line, and its impressive "positive reversal" on 5/14/09 was noted as a sign of institutional support. It gapped up on 4/30/09 for a new all-time high after reporting solid quarterly sales and earnings increases. It has traded up as much as +72.42% since first featured at $18.89 with a $21.08 pivot point in the 3/02/09 Mid-Day BreakOuts Report (read here).
TNDM's latest pivot point of $29.85 was based upon the stock's May 1st high. For investors who miss a proper buy point whenever any high-ranked stock breaks out from a first stage base, the stock's first pullback to the its 50 DMA line (or its 10-week average when viewing a weekly chart) may offer a them an ideal secondary buy point. Odds of success taper off upon each subsequent test of support at that important short-term average line. The discipline of the investment system that applies still requires for investors to avoid "chasing" and buying any stock more than +5% above its prior chart high or pivot point. As always, investors should sell to limit losses if ever any stock falls more than -7% from their buy price.
C A N S L I M | StockTalk | News | Chart | SEC | Zacks Reports | ![]()
![]()
![]()
View all notes | Alert me of new notes | CANSLIM.net Company Profile
Neutral Tandem Inc (TNDM -$1.19 or -4.18% to $27.27) is quietly consolidating after finding prompt support near its 50-day moving average (DMA) line and making an impressive "positive reversal" on 5/14/09. Note that it went through a deeper than -20% consolidation since its last appearance in this Featured Stock Update section on 5/07/09 under the headline "Ascending Base Pattern May Offer Second Stage Entry Point" (read here). In fact, that positive reversal was the best sign of bullish support and institutional buying demand since it gapped up on 4/30/09 for a new all-time high.
This high-ranked Telecom-Services firm had been forming a possible "ascending base" pattern, which is an advanced type of chart pattern marked by 3 pullbacks of 10-20%. The latest pivot point of $29.85 was based upon the stock's May 1st high. However, its choppier action of late raises concerns with respect to the stock's latest "second stage" set-up, as its recent shakeout is an indication of uncertainty that suggests it may be due to spend a longer time consolidating. Technically, gains backed by at least +50% above average volume are needed to trigger a new buy signal. The usual discipline of the investment system applies, which means not chasing and buying any stock more than +5% above its pivot point, and always selling to limit losses if ever a stock falls more than -7% from your buy price.
TNDM has traded up as much as +58.02% since it was first featured at $18.89 on Monday, March 2, 2009 with a $21.08 pivot point in the CANSLIM.net Mid Day Breakouts Report (read here). In the 4/21/09 CANSLIM.net After Market Update TNDM was discussed in the "Ken's Mail Bag" section, where we share an occasional Q&A session with all active members (read here).
C A N S L I M | StockTalk | News | Chart | SEC | Zacks Reports | ![]()
![]()
![]()

View all notes | Alert me of new notes | CANSLIM.net Company Profile
Neutral Tandem Inc (TNDM -$0.56 or -1.95% to $28.15) has been consolidating in a tight range since gapping up on 4/30/09 for a new all-time high after reporting solid quarterly sales (+46%) and earnings per share (+125%) increases for the period ending March 31, 2009. This high-ranked Telecom-Services firm may be forming an "ascending base" pattern, which is an advanced type of chart pattern. Typically, an ascending base is a second- or later-stage base pattern marked by 3 pullbacks of 10-20%. During TNDM's ascent since breaking out in March it had two pullbacks within that range, while staying well above important support at its 50-day moving average line. Its color code is changed to yellow and a new pivot point of $29.85 is noted based upon the stock's May 1st high. Technically, gains backed by at least +50% above average volume are needed to trigger a new buy signal. The usual discipline of the investment system applies, which means not chasing and buying any stock more than +5% above its pivot point, and always selling to limit losses if ever a stock falls more than -7% from your buy price.
TNDM has traded up as much as +58.02% since it was first featured at $18.89 on Monday, March 2, 2009 with a $21.08 pivot point in the CANSLIM.net Mid Day Breakouts Report (read here). In the 4/21/09 CANSLIM.net After Market Update TNDM was discussed in the "Ken's Mail Bag" section, where we share an occasional Q&A session with all active members (read here). If you have questions concerning any of the stocks appearing in prior reports, use the inquiry form to ask, and your Q&A might appear in a future report (we keep your private info private).
C A N S L I M | StockTalk | News | Chart | SEC | Zacks Reports | ![]()
![]()
![]()

View all notes | Alert me of new notes | CANSLIM.net Company Profile
Neutral Tandem Inc (TNDM -$0.88 or -3.31% to $25.72) was down today with above average volume on another wider than usual intra-day trading session. The price/volume action in this high-ranked leader this week has been indicative of distributional pressure and uncertainty, which generally are not good signs. The company is due to report Q1 earnings prior to next Thursday's open. Volume and volatility are often greater than usual in response to fresh earnings news and guidance, so extra caution and watchfulness is advised during earnings season. Its last appearance in this Featured Stock Update section on 4/09/09 illustrated its pullback to its 10-week moving average line under the headline "High-Ranked Telecom Firm Tests Support, Then Rallies" (read here).
More recently, TNDM was discussed in the "Ken's Mail Bag" section, where we share an occasional Q&A session with all active members, in the 4/21/09 CANSLIM.net After Market Update (read here). If you missed it, please take time to go back and review what was covered concerning TNDM and prior analysis that was published! If you have questions concerning any of the stocks appearing in prior reports, use the inquiry form to ask, and your Q&A might appear in a future report (we keep your private info private).
CANSLIM.net reports have recently noted on TNDM that, "it is too extended from a sound base for disciplined investors acting by the investment system's guidelines, well above support near its 50 DMA line and prior chart highs - which it briefly retested." The stock has traded up as much as +47.43% since it was first featured at $18.89 on Monday, March 2, 2009 with a $21.08 pivot point in the CANSLIM.net Mid Day Breakouts Report (read here).
C A N S L I M | StockTalk | News | Chart | SEC | Zacks Reports | ![]()
![]()
![]()

View all notes | Alert me of new notes | CANSLIM.net Company Profile
Neutral Tandem Inc (TNDM +$1.46 or +6.33% to $24.54) pulled back this week and found support above its prior chart highs and near its 10-week moving average line before bouncing and closing in the upper half of its weekly range. As long as this area holds, odds favor higher prices will follow. Currently, the stock is extended more than +5% above its pivot point after having traded up as much as +34% since first featured in yellow at $18.89 in the 3/02/09 CANSLIM.net Mid-Day BreakOuts Report (read here). Its 3/17/09 gain with over four times its average volume helped it technically break out above its pivot point. In recent weeks it has made steady progress above its 50-day moving average (DMA) line with multiple gains backed by above average volume while not encountering much distributional pressure. Disciplined investors always sell if any stock falls more than 7-8% from their buy price, and they do not chase extended stocks (more than 5% above their pivot point).
This high-ranked Telecom-Services firm has shown big percentage increases in sales revenues and earnings. Other positive factors include its small supply of only 32.6 million outstanding shares (the S criteria) and heavy ownership by management, with increasing ownership by institutional investors (the I criteria), as the number of top-rated funds owning its shares increased from 40 in March '08, to 78 in December '08.
C A N S L I M | StockTalk | News | Chart | SEC | Zacks Reports | ![]()
![]()
![]()

View all notes | Alert me of new notes | CANSLIM.net Company Profile
Neutral Tandem Inc (TNDM +$0.76 or +3.19% to $24.61) is extended more than +5% above its pivot point after having traded up as much as +34% since first featured in yellow at $18.89 in the 3/02/09 CANSLIM.net Mid-Day BreakOuts Report (read here). Its 3/17/09 gain with over four times its average volume helped it technically break out above its pivot point. In recent weeks it has made steady progress above its 50-day moving average (DMA) line with multiple gains backed by above average volume while not encountering much distributional pressure. Disciplined investors always sell if any stock falls more than 7-8% from their buy price, and they do not chase extended stocks (more than 5% above their pivot point).
This high-ranked Telecom-Services firm has shown big percentage increases in sales revenues and earnings. Other positive factors include its small supply of only 32.6 million outstanding shares (the S criteria) and heavy ownership by management, with increasing ownership by institutional investors (the I criteria), as the number of top-rated funds owning its shares increased from 40 in March '08, to 78 in December '08.
C A N S L I M | StockTalk | News | Chart | SEC | Zacks Reports | ![]()
![]()
![]()

View all notes | Alert me of new notes | CANSLIM.net Company Profile

Neutral Tandem Inc (TNDM +$0.05 or +0.23% to $21.95) has been stubbornly holding its ground after its 3/17/09 gain with over four times its average volume helped it technically break out above its pivot point. In recent weeks it has made steady progress above its 50-day moving average (DMA) line with multiple gains backed by above average volume while not encountering much distributional pressure. It is near its "max buy" level, while limited overhead supply may still act as resistance up through the $23 area (all-time highs from February 2008 not shown). Disciplined investors always sell if any stock falls more than 7-8% from their buy price, and they do not chase extended stocks (more than 5% above their pivot point).
This high-ranked Telecom-Services firm has shown big percentage increases in sales revenues and earnings. Other positive factors include its small supply of only 32.6 million outstanding shares (the S criteria) and heavy ownership by management, with increasing ownership by institutional investors (the I criteria), as the number of top-rated funds owning its shares increased from 40 in March '08, to 79 in December '08. TNDM was first featured in yellow at $18.89 in the 3/02/09 CANSLIM.net Mid-Day BreakOuts Report (read here).
C A N S L I M | StockTalk | News | Chart | SEC | Zacks Reports | ![]()
![]()
![]()

View all notes | Alert me of new notes | CANSLIM.net Company Profile
--Neutral Tandem Inc (TNDM +$0.65 or +3.60% to $18.69) opened the session with a small gap up today, ending the day higher with near average volume. It faces stubborn resistance in the $20-21 area, and it has been consolidating above important support at its 50-day & 200-day moving average (DMA) lines. On news it will soon be added to the S&P Small Cap 600 Index, it challenged its 52-week high on 3/06/09 then quickly erased most of its early gains. To trigger a proper technical buy signal, gains and a strong close above its pivot point backed by heavy volume are required. Volume behind a buyable breakout should be a minimum of +50% above its average daily trading total. Studies of the most successful breakouts that continued on to produce substantial gains shows that big winners typically had very heavy volume behind their breakouts, many times their average volume totals.
This high-ranked Telecom-Services firm has shown big percentage increases in sales revenues and earnings. Other positive factors include its small supply of outstanding shares (the S criteria) and heavy ownership by management, with increasing ownership by institutional investors (the I criteria). TNDM was first featured on Monday, March 02, 2009 in the CANSLIM.net Mid Day Breakouts Report (read here).
C A N S L I M | StockTalk | News | Chart | SEC | Zacks Reports | ![]()
![]()
![]()

View all notes | Alert me of new notes | CANSLIM.net Company Profile
Neutral Tandem Inc (TNDM -$0.99 or -5.51% to $18.96) still has some work to do while completing its current base, and it makes an ideal candidate for investors' watch lists while it forms the right side of a large cup-shaped pattern. A light volume pullback in the days and weeks ahead might allow it to form a good handle, making it a cup-with-handle, where the pivot would actually be the high on the right side of the cup. We have used its September chart high as its pivot point, however there is a bit of additional overhead supply for it to contend with. Any subsequent breakout with heavy volume (more than +50% above average) above those important prior chart highs could be considered a solid technical buy signal which could mark the beginning of a sustained and substantial upward advance. The company's high ranks and strong sales and earnings increases show the Telecom-Services firm has very strong fundamentals. The number of top rated funds owning shares in the company expanded from 40 in March '08 to 80 as of December '08, offering a great reassurance as to the I criteria of the investment system. Its small supply of shares and heavy ownership by management also are considered as good characteristics.
Market conditions (the M criteria) argue against all new buying efforts until a confirmed rally with a follow-through-day and an expansion of leadership (longer list of stocks hitting new highs) occurs. This stock was first featured on Monday, March 02, 2009 in the CANSLIM.net Mid Day Breakouts Report (read here). As always, after making a disciplined buy, investors following this investment system know to limit losses by selling any and all shares of a stock if it falls more than 7-8% from their buy point.
C A N S L I M | StockTalk | News | Chart | SEC | Zacks Reports | ![]()
![]()
![]()

View all notes | Alert me of new notes | CANSLIM.net Company Profile