Followed Negative Reversal With More Volume-Driven Gains - Thursday, April 05, 2012
Consolidating Above 50-Day Average and Upward Trendline - Wednesday, May 18, 2011
Volume-Driven Gains Lift Software Firm From New Base - Thursday, April 14, 2011
Bullish Base-On-Base Formed After Prior Breakout - Friday, March 18, 2011
Leader Getting More Extended From Latest Base - Thursday, February 10, 2011
Patience Allowed New Base To Form - Wednesday, February 02, 2011
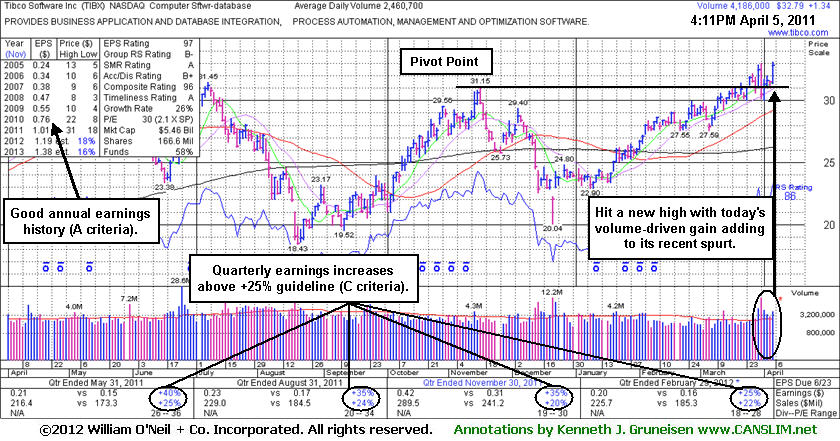
Followed Negative Reversal With More Volume-Driven Gains - Thursday, April 05, 2012
Tibco Software Inc (TIBX +$1.38 or +4.39% to $32.83) rose while volume was above average behind today's 3rd gain in the span of 4 sessions. It finished above its "max buy" level after hitting another new 52-week high. Its color code was changed to green after getting extended from its prior base. Its recent low ($30.03 on 4/02/12) defines a near-term support level to watch above its 50-day moving average (DMA) line on pullbacks.
In the mid-day report on 3/30/12 it was highlighted in yellow with pivot point cited based on its 11/16/11 high plus 10 cents as it was noted -"Technically, its volume-driven gain on the prior session triggered a buy signal." It touched a new 52-week high on 3/30/12 and then reversed into the red, however, the worrisome "negative reversal" which occurred has been followed up by more volume-driven gains and a new high. Its current Up/Down Volume Ratio of 1.3 indicates that shares have recently been under accumulation.
This high-ranked Computer Software - Database firm based in Palo Alto, CA has maintained a steady annual earnings (A criteria) history and earnings increases have been impressive in the 8 most recent quarterly comparisons, above the +25% guideline (C criteria). It reported earnings +25% on +22% sales revenues for the quarter ended February 29, 2012 versus they year ago period.
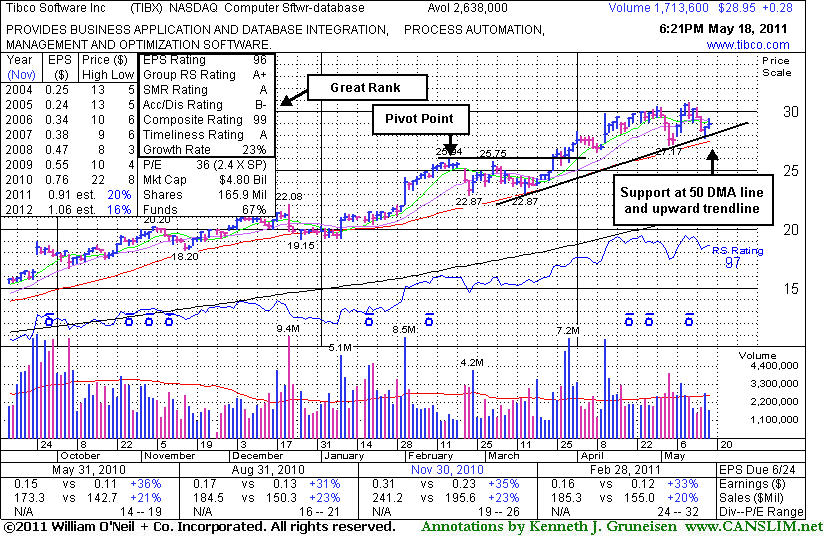
Consolidating Above 50-Day Average and Upward Trendline - Wednesday, May 18, 2011
Tibco Software Inc (TIBX +$0.28 or +0.77% to $28.95) volume totals have been cooling while recently consolidating above its 50-day moving average (DMA) line and upward trendline. It is extended from a sound base pattern. Technically, its short-term average and recent low ($27.17) mark important chart support levels to watch where violations may trigger sell signals. Following its last appearance in the FSU section on 4/14/11 with an annotated graph under the headline, "Volume-Driven Gains Lift Software Firm From New Base", it made steady progress and stayed above its 50 DMA line on pullbacks. It found support well above prior highs in the $25-26 area during the recent consolidation, and never seriously threatened to negate its latest breakout.
This high-ranked Computer Software - Database firm based in Palo Alto, CA has maintained a steady annual earnings (A criteria) history and earnings increases have been impressive in the 5 most recent quarterly comparisons, above the +25% guideline (C criteria). The number of top-rated funds owning its shares rose from 591 in Mar '10 to to 710 in Mar '11, a reassuring sign concerning the I criteria. It has traded as much as session +28.2% from $23.98 when it was included in the February 2011 issue of CANSLIM.net News (read here).
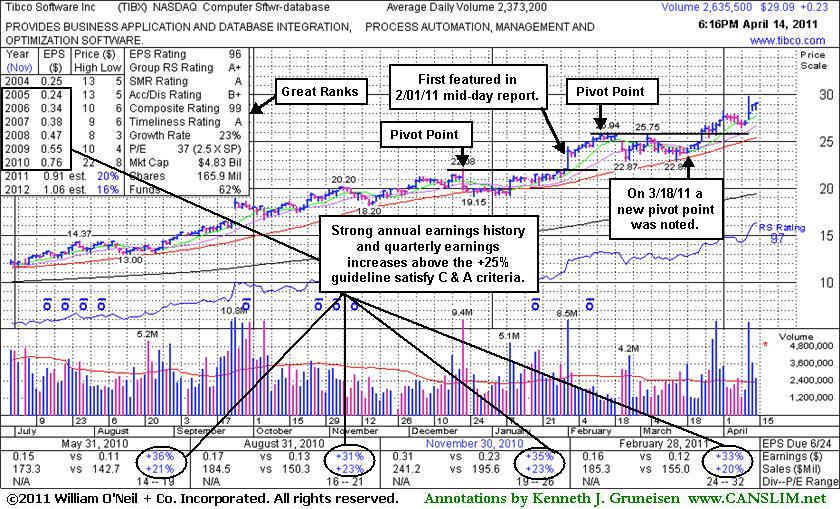
Volume-Driven Gains Lift Software Firm From New Base - Thursday, April 14, 2011
Tibco Software Inc (TIBX +$0.23 or +0.80% to $29.09) finished near the session high today for a best-ever close. It is extended from a sound base following a 4/12/11 gap up gain with heavy volume for a new 52-week high and additional gains. A new pivot point was cited when it made its last appearance in the FSU section on 3/18/11 with an annotated graph under the headline, "Bullish Base-On-Base Formed After Prior Breakout". It subsequently churned into new high territory and got extended from its latest base. Then it briefly consolidated back under its "max buy" level before continuing higher with more volume-driven gains this week. It found support well above prior highs in the $25-26 area during the recent consolidation, and never seriously threatened to negate its latest breakout.
This high-ranked Computer Software - Database firm based in Palo Alto, CA has maintained a steady annual earnings (A criteria) history and earnings increases have been impressive in the 5 most recent quarterly comparisons, above the +25% guideline (C criteria). The number of top-rated funds owning its shares rose from 591 in Mar '10 to to 701 in Mar '11, a reassuring sign concerning the I criteria. It closed today's session +21.3% from $23.98 when it was included in the February 2011 issue of CANSLIM.net News (read here).
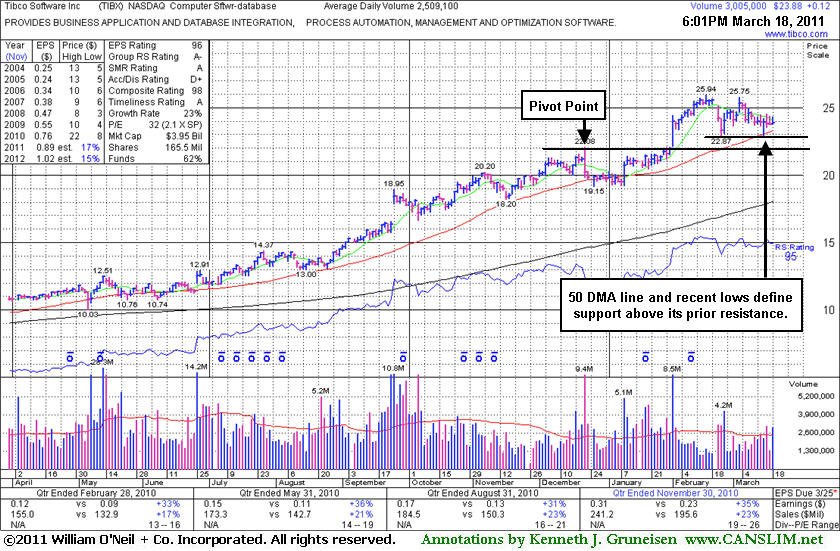
Bullish Base-On-Base Formed After Prior Breakout - Friday, March 18, 2011
Tibco Software Inc (TIBX +$0.12 or +0.51% to $23.88) is consolidating above its 50-day moving average (DMA) line and recent chart lows defining support above its old $22.00 resistance area. More damaging losses would raise concerns and trigger technical sell signals. Since its last appearance in the FSU section on 2/10/11 with an annotated graph under the headline, "Leader Getting More Extended From Latest Base", it endured distributional pressure without breaking down badly. It has formed a bullish base-on-base type pattern and a new pivot point is cited based on its 52-week high plus 10 cents after its new flat base pattern of near minimum length. A subsequent breakout with heavy volume may trigger a new (or add-on) buy signal, however the market (M criteria) also needs to confirm a new rally with a follow-through day before disciplined investors following this fact-based investment system might take action on any buy candidates meeting all key criteria. This a high-ranked Computer Software - Database firm based in Palo Alto, CA has maintained a steady annual earnings (A criteria) history and earnings increases have been impressive in the 4 most recent quarterly comparisons, above the +25% guideline (C criteria). The number of top-rated funds owning its shares rose from 591 in Mar '10 to to 690 in Dec '10, a reassuring sign concerning the I criteria.
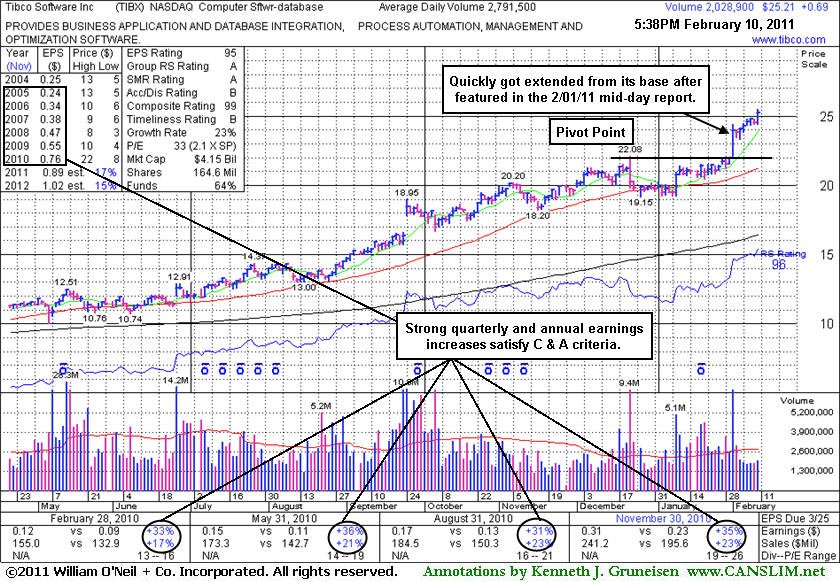
Leader Getting More Extended From Latest Base - Thursday, February 10, 2011
This a high-ranked Computer Software - Database firm based in Palo Alto, CA has maintained a steady annual earnings (A criteria) history and earnings increases have been impressive in the 4 most recent quarterly comparisons, above the +25% guideline (C criteria). The number of top-rated funds owning its shares rose from 591 in Mar '10 to to 687 in Dec '10, a reassuring sign concerning the I criteria.
Tibco Software Inc (TIBX +$0.69 or +2.81% to $25.21) hit another new 52-week high today with a gain on light volume. It is extended from a sound base, and prior chart highs in the $22 area define important support to watch now. Its big gain on 2/01/11 prompted its appearance in yellow in the mid-day report (read here) as we observed - "There is no overhead supply to act as resistance, so it could then easily rise unhindered for more climactic gains. however, risk obviously increases the further one buys from a proper pivot point." It quickly got extended from its "late-stage" or riskier base. It was covered in greater detail with an annotated graph on the February 2011 issue of CANSLIM.net News under the headline "Patience Allowed New Base To Form" and yet it has stubbornly held its ground and refused to pull back. Approximately 40% of successful winners pull back and test support at their prior highs and pivot point before continuing higher. Disciplined investors might watch for other more compelling buy candidates while waiting for a secondary buy point to develop. Your odds are best when you avoid chasing leaders that are too extended from a proper base pattern.
Patience Allowed New Base To Form - Wednesday, February 02, 2011
| Tibco Software Inc. |
CLICK HERE to see the Profile Page for this stock with current details and historic information |
|
Ticker Symbol: TIBX (NASDAQ) |
Industry Group: Computer Software - Database |
Shares Outstanding: 348,000,000 |
|
Price: $23.98 2/01/2011 |
Day's Volume: 8,505,800 2/01/2011 |
Shares in Float: 212,900,000 |
|
52 Week High: $22.08 12/22/2010 |
50-Day Average Volume: 2,704,000 |
Up/Down Volume Ratio: 1.2 |
|
Pivot Point: $22.18 12/22/2010 high plus 10 cents |
Pivot Point +5% = Max Buy Price: $23.29 |
Web Address: http://www.tibco.com/
|
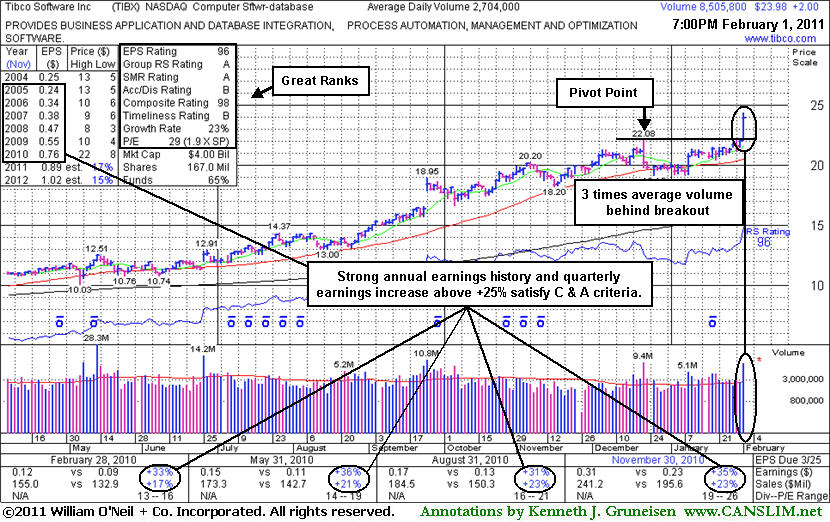
CANSLIM.net Profile: Tibco Software Inc. is a high-ranked Computer Software - Database firm based in Palo Alto, CA. It has maintained a steady annual earnings (A criteria) history and earnings increases have been impressive in the 4 most recent quarterly comparisons, above the +25% guideline (C criteria). Return On Equity is reported at 16%, a hair shy of the 17% minimum guideline. The number of top-rated funds owning its shares rose from 591 in Mar '10 to to 680 in Dec '10, a reassuring sign concerning the I criteria.
What to Look For and What to Look Out For: Its gain confirmed a proper technical buy signal but it quickly got extended more than +5% above its pivot point. That gives investors a good reason to watch for subsequent light volume pullbacks as an opportunity to accumulate shares without chasing it too far above prior highs. A cooperative backdrop in the major averages (M criteria) in the near-term may continue to work in its favor, but any change in the market environment should be expected to impact 3 out of 4 stocks. Disciplined investors always limit losses if ever any stock falls more than -7% from their purchase price.
Technical Analysis: TIBX's gain on 2/01/11 prompted its appearance in yellow in the mid-day report (read here). There is no overhead supply to act as resistance, so it could then easily rise unhindered for more climactic gains. however, risk obviously increases the further one buys from a proper pivot point. Its supply of shares is not extremely huge, but usually the market's biggest winners had only 30 million shares (S criteria) outstanding or less. It had last been noted, "Patient investors may watch for a sound base to form and offer ideal secondary buy points", in the 12/22/10 mid-day report (read here). In recent weeks it had consolidated above its 50-day moving average line in a very tight trading range.