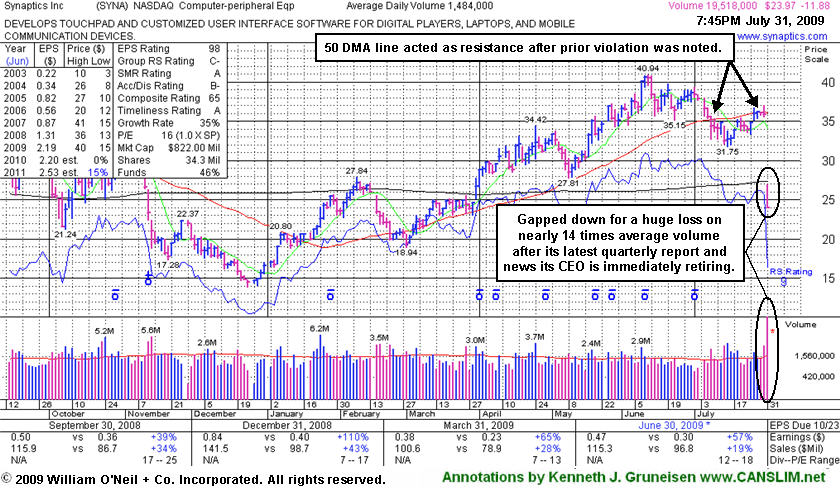
Poor Action Follows Earnings and News Of CEO's Retirement - Friday, July 31, 2009
Synaptics Inc. (SYNA -$11.88 or -33.14% to $23.97) gapped down for a huge loss on 13 times average volume after its latest quarterly report and news its CEO is immediately retiring. Its 50-day moving average (DMA) line acted as resistance after the prior violation was noted. Prior reviews in this Featured Stock Update section included cautionary remarks under telling headlines such as "Relative Strength Has Slumped While Trading Under 50 Day Average" (7/22/2009) and "50 Day Average and Upward Trendline Violations This Week Raised Concerns" (7/10/2009). It was stated, "For its outlook to improve, technically, it still needs to repair the 50 DMA violation and show signs of institutional demand. It found support near prior chart highs after 7 session losing streak and a worrisome gap down on 7/14/09. Deterioration under its $31.75 low on July 15th would raise raise more serious concerns and trigger additional technical sell signals. For now it should remain on an active watch list in the event it shows strength and completes a new sound base."
SYNA is being dropped from the Featured Stocks list tonight based upon its poor action. It was first featured in yellow in the May 18, 2009 Mid-Day BreakOuts Report (read here).
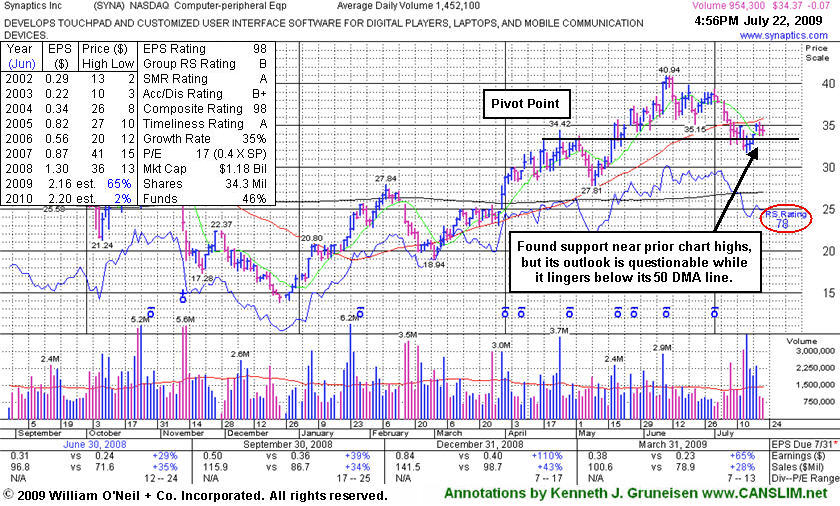
Relative Strength Has Slumped While Trading Under 50 Day Average - Wednesday, July 22, 2009
Synaptics Inc. (SYNA -$0.07 or -0.20% to $34.37) remains trading under its 50-day moving average (DMA) line after finding support near prior chart highs. Several recent gains on above average volume helped it rally back above its prior pivot point, but leave its rebound still short of its important short-term average which may now act as a stubborn resistance level. Its Relative Strength rank has slumped to 78 (see red circle), down from 88 on July 10th when it made its last appearance in this Featured Stock Update section under the headline, "50 Day Average and Upward Trendline Violations This Week Raised Concerns" (read here). For its outlook to improve, technically, it still needs to repair the 50 DMA violation and show signs of institutional demand. It found support near prior chart highs after 7 session losing streak and a worrisome gap down on 7/14/09. Deterioration under its $31.75 low on July 15th would raise raise more serious concerns and trigger additional technical sell signals. For now it should remain on an active watch list in the event it shows strength and completes a new sound base.
SYNA was first featured in yellow in the May 18, 2009 Mid-Day BreakOuts Report (read here). The number of top-rated funds owning its shares rose from 123 in June '08 to 201 in March '09, which is good news concerning the I criteria. Strong earnings and sales revenues growth in the 4 latest quarterly comparisons satisfies the C criteria. Its annual earnings (the A criteria) history showed a downturn in 2006, leaving concerns, but it followed that up with strong growth the next 2 years.
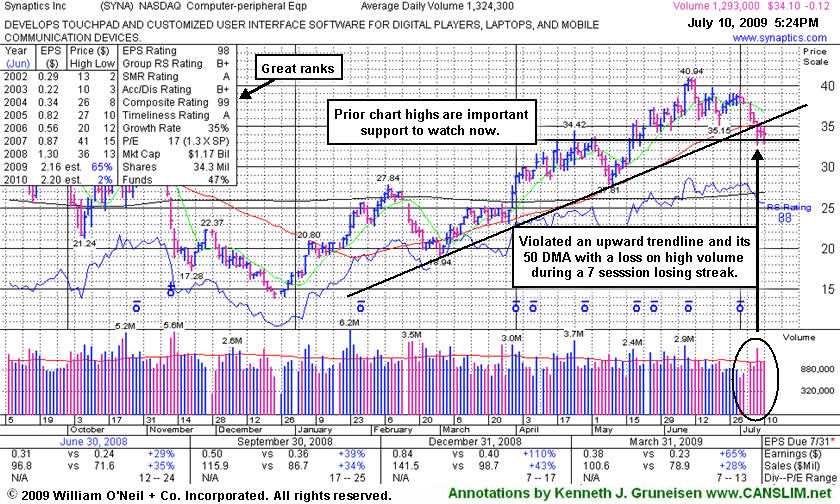
50 Day Average and Upward Trendline Violations This Week Raised Concerns - Friday, July 10, 2009
Synaptics Inc. (SYNA -$0.12 or -0.35% to $34.10) fell of Friday for its 7th consecutive loss. During that streak, a 50-day moving average (DMA) line and upward trendline violation on 7/08/09 triggered technical sell signals. Prior chart highs define an important support level it is consolidating above now. Any deterioration leading to a close under its May 1st close of $33.33 would raise more serious concerns and fully negate its latest breakout by erasing all bullish action since May. For its outlook to improve, technically, it needs to repair the recent violation of its short-term average and show signs of institutional support. It was first featured in yellow in the May 18, 2009 Mid-Day BreakOuts Report (read here). The number of top-rated funds owning its shares rose from 123 in June '08 to 199 in March '09, which is good news concerning the I criteria. Strong earnings and sales revenues growth in the 4 latest quarterly comparisons satisfies the C criteria. Its annual earnings (the A criteria) history showed a downturn in 2006, leaving concerns, but it followed that up with strong growth the next 2 years.
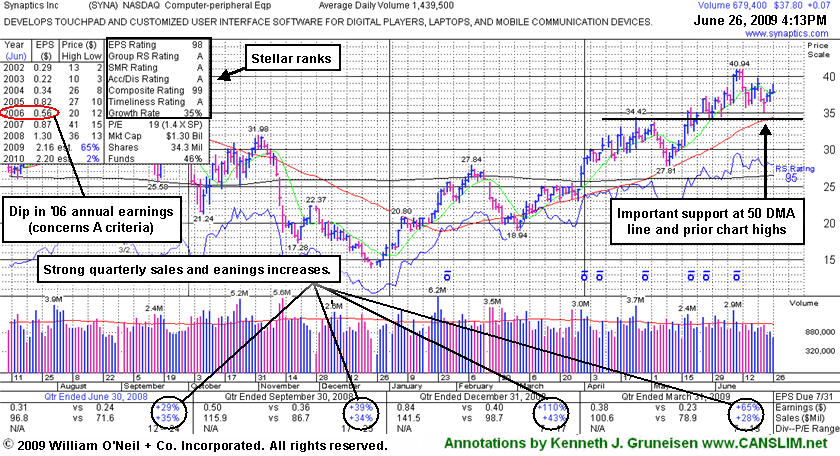
Quiet Consolidation Above Support at 50-Day Average and Prior Highs - Friday, June 26, 2009
Synaptics Inc. (SYNA +$0.37 or +0.98% to $38.10) is quietly consolidating above its August 2008 chart highs ($36), its 50-day moving average DMA line, and recent chart highs which all closely coincide -defining an important support level. At its recent highs it was challenging its 2007 high near $41 and, technically, any subsequent breakout to new all-time highs would be undeniably bullish. It was first featured in yellow in the May 18, 2009 mid-day report (read here). The number of top-rated funds owning its shares rose from 123 in June '08 to 196 in March '09, which is good news concerning the I criteria. Strong earnings and sales revenues growth in the 4 latest quarterly comparisons satisfies the C criteria. Its annual earnings (the A criteria) history showed a downturn in 2006, leaving concerns, but it followed that up with strong growth the next 2 years.
Leading Stock Retests Support - Monday, June 15, 2009
Synaptics Inc. (SYNA -$0.81 or -2.11% to $37.65) pulled back and found support after retesting its prior chart highs near $36. It was encouraging to see this stock close in the upper half of its range today after successfully retesting support. Synaptics closed above its "max buy" level, so it is still too extended to be considered buyable under the proper guidelines at this point. It was first featured in yellow in the May 18, 2009 mid-day report (read here). The number of top-rated funds owning its shares rose from 123 in June '08 to 188 in March '09, which is good news concerning the I criteria. Strong earnings and sales revenues growth in the 4 latest quarterly comparisons satisfies the C criteria. Its annual earnings (the A criteria) history showed a downturn in 2006, leaving concerns, but it followed that up with strong growth the next 2 years.
C A N S L I M | StockTalk | News | Chart | SEC | Zacks Reports | ![]()
![]()
![]()
View all notes | Alert me of new notes | CANSLIM.net Company Profile
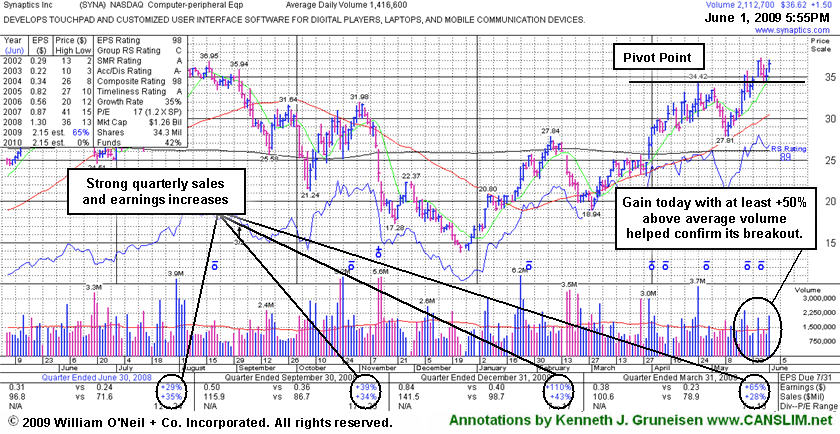
Additional Gain Above Pivot Point With Above Average Volume - Monday, June 01, 2009
Synaptics Inc. (SYNA +$1.50 or +4.27% to $36.62) gapped up today and posted a gain with just better than the minimum +50% above average volume guideline. This confirmed its recent bullish breakout above its pivot point, and it closed just above its "max buy" level, so no resistance remains from overhead supply. It was first featured in yellow in the May 18, 2009 mid-day report (read here). The number of top-rated funds owning its shares rose from 123 in June '08 to 184 in March '09, which is good news concerning the I criteria. Strong earnings and sales revenues growth in the 4 latest quarterly comparisons satisfies the C criteria. Its annual earnings (the A criteria) history showed a downturn in 2006, leaving concerns, but it followed that up with strong growth the next 2 years stock was first featured on Monday, May 18, 2009 in the CANSLIM.net Mid Day Breakouts Report (read here).
C A N S L I M | StockTalk | News | Chart | SEC | Zacks Reports | ![]()
![]()
![]()
View all notes | Alert me of new notes | CANSLIM.net Company Profile
Strong Earnings Growth After Dip in 2006 - Monday, May 18, 2009
Synaptics Inc (SYNA +$2.89 or +9.52% to $33.24) ended the session with a solid gain on slightly above average volume that left it only -10.00% off its 52-week high -and not much further from all-time highs! Technically, gains above a stock's pivot point should be backed by a minimum of +50% above average volume to trigger a technical buy signal.
The best winners in stock market history typically had a strong and steady earnings growth history in the 3-5 year period prior to launching into a new major uptrend. A close look into its earnings history reveals a flaw, which is a reason for some concern. Fundamentally, its annual earnings (the A criteria) history showed a downturn in 2006, however it followed that up with strong growth the next 2 years. Strong earnings and sales revenues growth in the 4 latest quarterly comparisons, well above the +25% minimum guideline - easily satisfying the C criteria. It was first featured on Monday, May 18, 2009 in the CANSLIM.net Mid Day Breakouts Report (read here).
C A N S L I M | StockTalk | News | Chart | SEC | Zacks Reports | ![]()
![]()
![]()

View all notes | Alert me of new notes | CANSLIM.net Company Profile