Stanley Inc (SXE +$0.12 or +0.41% to $29.63) has recently been struggling near previous chart lows in the $28 area, a key chart support level. Its outlook grows increasingly questionable the longer it remains below its 50-day & 200-day moving average (DMA) lines, which it violated with a considerable loss on high volume on January 30, 2009, triggering technical sell signals. It would need to rally back above its 50 & 200 DMA lines for its outlook to improve. Quarterly sales revenues and earnings increases have remained strong and above the +25% guideline. It has not made any headway since it was featured again in yellow in the 1/12/2009 CANSLIM.net Mid-Day Breakouts Report (read here). It proved resilient after it was dropped (based on weakness) from the Featured Stocks list on 10/27/2008. SXE was first featured on Friday, November 02, 2007 in the CANSLIM.net Mid Day Breakouts Report (read here).
C A N S L I M | StockTalk | News | Chart | SEC | Zacks Reports | ![]()
![]()
![]()
View all notes | Alert me of new notes | CANSLIM.net Company Profile
It is very important to isolate the noise and pay attention to price and volume as we make our way through yet another earnings season. There are a slew of analysts that come out and set "targets" and who constantly engage in publishing upgrades or downgrades on various securities. An important element in profitably navigating through a busy earnings season is to see how your individual holdings react to their latest earnings news and guidance. While it is a common occurrence to see stocks sell off after a new earnings report, it is healthy to see investors promptly bid the stocks higher after a company reports their quarterly results. Investors that objectively analyze price and volume will likely do better than blindly following a plethora of analysts' upgrades and downgrades.
Stanley Inc (SXE -$1.92 or -6.77% to $30.26) fell on heavy volume, slicing below its 50-day & 200-day moving average (DMA) line. The company just reported solid sales and earnings increases for the quarter ended Dec 31, 2008. It would need to rally back above its 50 & 200 DMA lines for its outlook to improve, meanwhile prior lows in the $28 area are now a critical chart support level. Its code was changed to green based on technical deterioration in the weeks that followed its appearance in yellow in the 1/12/2009 CANSLIM.net Mid-Day Breakouts Report (read here). Quarterly sales revenues and earnings increases have remained strong and above the +25% guideline. It proved resilient since dropped (based on weakness) from the Featured Stocks list on 10/27/2008. It was first featured on Friday, November 02, 2007 in the CANSLIM.net Mid Day Breakouts Report (read here).
C A N S L I M | StockTalk | News | Chart | SEC | Zacks Reports | ![]()
![]()
![]()
View all notes | Alert me of new notes | CANSLIM.net Company Profile
Often, when a leading stock is setting up to breakout of a solid base it is highlighted in CANSLIM.net's Mid-Day Breakouts Report. The most relevant factors are noted in the report which allows prudent investors to place the issue in their watch list. After doing any necessary backup research, the investor is prepared to act if and when the stock triggers a technical buy signal (breaks above its pivot point on more than +50% average turnover). In the event the stock fails to trigger a technical buy signal and its price declines then it will simply be removed from the watch list.
Stanley Inc (SXE -$0.69 or -2.05% to $34.41) appeared again in yellow today in the Monday, January 12, 2009 CANSLIM.net Midday Report (read here). It is consolidating above its 50-day and 200-day moving average (DMA) lines within close striking distance of its new pivot point, however disciplined investors will watch for a proper technical buy signal - which requires a gain above its pivot point backed by a minimum of +50% above average volume. The new pivot point cited is based upon the December 31, 2008 chart high of $36.26 plus ten cents. Beyond the pivot, little overhead supply remains to act as resistance up through the $38 area. Quarterly sales revenues and earnings increases have remained strong and above the +25% guideline.
This high-ranked leader has proven resilient since it was dropped (based on weakness) from the Featured Stocks list on 10/27/2008 "Overhead Supply - A Source of Resistance" in the Monday, October 27, 2008 CANSLIM.net After Market Report (read here). SXE was first featured on Friday, November 02, 2007 in the CANSLIM.net Mid Day Breakouts Report (read here).
C A N S L I M | StockTalk | News | Chart | SEC | Zacks Reports | ![]()
![]()
![]()
View all notes | Alert me of new notes | CANSLIM.net Company Profile
Stanley Inc. (SXE $-1.82 or -6.20% to $27.54) traded up +21% after it was first featured on Friday, November 02, 2007 in the CANSLIM.net Mid Day Breakouts Report (read here). After getting extended well above its max buy level, CANSLIM.net's ongoing notes identified technical sell signals when it sank under a steep upward trendline, and when it gapped down on 12/13/07 for a loss on above average volume. As it continued falling, it violated its 50-day moving average (DMA) line and triggered another technical sell signal, and based on the weak technical action it was dropped from the Featured Stocks list on 12/24/2007. The stock was featured in yellow again in the CANSLIM.net Mid Day Breakouts Report on Monday, August 11, 2008 (read here), and a detailed analysis was provided with an annotated graph in that evening's report under the headline "High-Ranked Commercial Services Firm Showing Leadership".
In the months that have followed, SXE has struggled while the broader market sank into a very steep correction. It may eventually come back around again in future screenings, but it is being dropped from the Featured Stocks list tonight based upon recent losses with above average volume and technical deterioration including a 10/24/08 gap down under its 200 DMA line. SXE made two other appearances recently in the Featured Stock Update section of CANSLIM.net's After Market Update - Friday, October 03, 2008 under the headline, "Upward Trendline and 50 DMA - Support Levels To Watch", and Tuesday, October 14, 2008 under the headline, "Resistance Remains a Concern While Under 50 DMA and Prior Chart Highs". Its most recent rally effort has faltered, and the stock now faces resistance due to overhead supply up through the $38 level, making it unlikely for an upward sprint. Overhead supply is the term used to describe all of the investors that accumulated shares at higher prices in prior months - who are anxious and likely to be sellers in the near term.
C A N S L I M | StockTalk | News | Chart | SEC | Zacks Reports | ![]()
![]()
![]()
View all notes | Alert me of new notes | CANSLIM.net Company Profile
A very important technical tool that savvy investors have learned to incorporate in their technical analysis is the 50-day moving average (DMA) line. The 50 DMA line plays a pivotal role relative to a stock's price. If the price of a stock is above its 50 DMA then odds are that its 50 DMA will act as formidable support. Conversely, if the price is below its 50 DMA then the moving average acts as resistance. Healthy stocks sometimes trade under their 50 DMA lines briefly, but usually a strong candidate will promptly bounce and repair a 50 DMA violation. When a stock has violated its 50 DMA line and then lingers beneath it, the stock's outlook gets worse and worse as it spends a greater period of time trading under that important short-term average line. Once the 50 DMA line starts sloping downward it should also be acknowledged that the stock has been struggling for a while, and it might be time to reduce exposure and look for places to put that money to work in stronger buy candidates.
Stanley Inc. (SXE +$0.87 or +2.60% to $34.37) traded up for a third consecutive session, however volume has been lighter behind each subsequent gain since its 10/10/08 positive reversal. It has found prompt support after recently violating its 200 DMA line and prior chart lows in the $31 area. It faces resistance at its 50 DMA line and has overhead supply up to the $38 area which may hinder its upward progress. Future gains above those resistance levels would help its outlook improve immensely. Its last appearance in the Featured Stock Update section was on Friday, October 3, 2008 under the headline, "Upward Trendline and 50 DMA - Support Levels To Watch", and it subsequently triggered technical sell signals by violating its 50 DMA line and an upward trendline connecting its May-September lows. The 10/03/08 analysis also noted, "Prior chart lows and its 200 DMA line in the $31 area are additional support levels to watch on pullbacks."
SXE was first featured on Friday, November 2, 2007 in the CANSLIM.net Mid Day Breakouts Report (read here). Initially it made good progress, then its 12/17/07 violation of its 50 DMA line triggered a technical sell signal near the beginning of a longer and deeper correction. It was many months before the stock worked its way back into good shape, and it was featured again in yellow in the 8/11/08 CANSLIM.net Mid-Day Breakouts Report (read here). Its fundamentals remain strong, but since that time it encountered stubborn resistance near its prior chart highs in the $38 area.
C A N S L I M | StockTalk | News | Chart | SEC | Zacks Reports | ![]()
![]()
![]()
View all notes | Alert me of new notes | CANSLIM.net Company Profile
An upward trendline, by definition, develops as a stock steadily appreciates over an extended period of time. During that period the stock vacillates between the lower and upper boundaries of trendlines which can be drawn connecting a series of recent highs or lows. In order to ensure the overall health of the stock, the lower boundary should not be violated. Technically, if the lower boundary is violated, this signals that the trend is deteriorating and bears are gaining control, making the odds start to favor the possibility of further downside testing.
Stanley Inc (SXE -$0.87 or -2.51% to $35.48) is consolidating above its 50 DMA line and an upward trendline connecting its May-September lows, still perched within close striking distance of its all-time highs. New pivot point and max buy prices were recently noted and its color code was changed to yellow based on healthier action. Prior chart lows and its 200 DMA line in the $31 area are additional support levels to watch on pullbacks. The stock previously appeared in the Featured Stock Update section of the 8/11/08 CANSLIM.net After Market Update with an annotated graph under the headline - "High-Ranked Commercial Services Firm Showing Leadership" (read here). First featured in the 11/02/07 CANSLIM.net Mid-Day Breakouts Report (read here) after it gapped up and charged to new all-time highs.
C A N S L I M | StockTalk | News | Chart | SEC | Zacks Reports | ![]()
![]()
![]()
View all notes | Alert me of new notes | CANSLIM.net Company Profile
Once again, the "L" criteria tells investors to choose leading companies in leading industry groups, and when we have identified a high-ranked leader with the proper characteristics we should wait and watch for gains on at least +50% above average volume as a confirmation that a breakout is attracting meaningful institutional sponsorship. A classic example of the success enjoyed by many CANSLIM.net readers usually starts when an investor reads a CANSLIM.net report and buys a featured stock before it has risen above the pivot point by greater than 5%. After a stock triggers a technical buy signal and is purchased, it is always important to employ the 7-8% loss cutting rule in the event of a downturn.
Stanley Inc. (SXE +$1.00 or +2.77% to $37.06) rallied to a fresh 52-week high with a solid gain on above average volume and was featured in today's CANSLIM.net Mid Day Breakouts Report (read here) with a $35.60 pivot point, $37.38 maximum buy price and the following note: "Y- Recent gains with above average volume have it trading near its 52-week and all-time highs with little overhead supply remaining. Technically it is trading near its max buy level after an earlier breakout above near-term resistance on 8/04/08 with a considerable gain on heavy volume helping it rise above its pivot point. Weak technical action prompted it to be dropped from the Featured Stocks list on 12/24/2007. First featured in the 11/02/07 CANSLIM.net Mid-Day Breakouts Report (read here) after it gapped up and charged to new all-time highs."
SXE sports strong ranks; an Earnings Per Share (EPS) rating of 90, and a Relative Strength (RS) rating of 97. The stock resides in the Comml Svcs-Miscellaneous group which is presently ranked 17th out of the 197 groups listed in the paper, easily satisfying the L criteria. Remember that the proper guidelines say that a stock could be accumulated below its maximum buy price (in this case $37.38), not above it. In addition, always limit losses per the 7-8% sell rule, and never hold a stock if it falls more than that from your purchase price.
C A N S L I M | StockTalk | News | Chart | SEC | Zacks Reports | ![]()
![]()
![]()
View all notes | Alert me of new notes | CANSLIM.net Company Profile
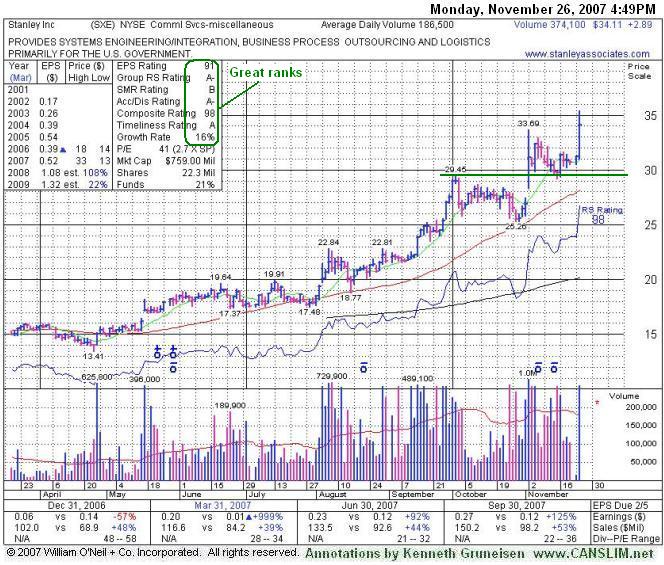
Statistically, about 40% of winning stocks will pull back after breaking out. In other words, it is not uncommon for stocks to pullback and retest support near their pivot point after breaking out. It is important to see the bulls show up and offer support at or above the pivot point. This may offer investors a chance to increase their exposure before the stock continues advancing. However, an important caveat is that volume should contract as the stock pulls back towards its pivot point. Heavy volume behind losses can be cause for concern, especially if the stock does not find support at its pivot point. Whenever a recent breakout is completely negated by a loss that leads to a close back in the prior base, this is construed as a technical sell signal and a sign that the bears are regaining control.
Stanley, Inc. (SXE +$2.89 or +9.26% to $34.11) surged to a new all-time high close on Monday after a considerable gain on more than twice its average volume. The stock found support above its pivot point in the past couple of weeks since it was first featured on Friday, November 02, 2007 in the CANSLIM.net Mid Day Breakouts Report (read here) with a $29.55 pivot point and a $31.03 maximum buy price. This high-ranked leader triggered a technical buy signal with it's 11/02/07 breakout as it gapped above its pivot point and surged into new high territory. This stock is one of the countless examples of winning stocks that pull back after breaking out to retest their pivot points. When the market is in a confirmed rally, unlike the present situation, these pullbacks can offer investors another chance to accumulate shares within the proper guidelines. However, since the market is currently in a correction, the investment system's M criteria argues that new buys are discouraged for now. This is because 3 out of 4 stocks go down during market corrections, which is not a conducive environment for investors to profit by owning stocks. Instead, Stanley Inc. is a good example of a strong stock that should be kept on an active watch list until a new follow-through day emerges.
C A N S L I M | StockTalk | News | Chart | SEC | Zacks Reports | ![]()
![]()
![]()
View all notes | Alert me of new notes | CANSLIM.net Company Profile