Skyworks Solutions Inc (SWKS +$0.09 or +0.09% to $105.63) found prompt support at its 50-day moving average (DMA) line ($99.62) after briefly undercutting prior highs in the $102 area. The recent low ($98.07 on 6/09/15) and its 50 DMA line define important near-term support where damaging violations may trigger technical sell signals. The weekly chart below shows its considerable rally over the past 2 years. After building a riskier "late-stage" base pattern, it wedged higher.
SWKS was last shown in this FSU section on 5/19/15 with annotated graphs under the headline, "Gains for New Highs Lacked Substantial Volume Conviction". Without heavy volume behind a breakout, investors are missing the necessary proof of serious institutional buying demand capable of contributing to a considerable and sustained advance in price. Members were previously reminded - "Gains backed by at least +40% above average volume while rallying above the pivot point may trigger a technical buy signal." SWKS failed to trigger a proper technical buy signal since highlighted in yellow with pivot point cited based on its 3/23/15 high plus 10 cents in the 5/01/15 mid-day report (read here).
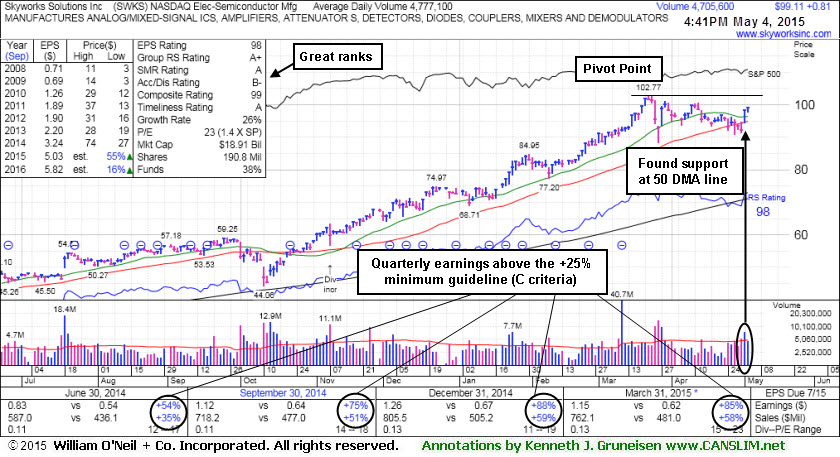
It showed sales revenues increases of +35%, 51%, +59%, and +58% during the Jun, Sep, Dec '14, and Mar '15 quarterly comparisons, respectively. That is a reassuring sign of great demand for new products or services (N criteria). Meanwhile, earnings increases were +54%, +75%, +88%, and +85% during that same period. Quarterly comparisons have shown earnings well above the +25% minimum guideline (C criteria). Annual earnings (A criteria) history has been strong.


Skyworks Solutions Inc (SWKS +$0.96 or +0.93% to $103.99) hit another new 52-week high with today's gain backed by +19% above average volume. On the prior session its gain was backed by +27% above average volume. It recently found support near its 50-day moving average (DMA) line while building on a riskier "late-stage" base pattern. Without heavy volume behind a breakout, investors are missing the necessary proof of serious institutional buying demand capable of contributing to a considerable and sustained advance in price. Members were previously reminded - "Gains backed by at least +40% above average volume while rallying above the pivot point may trigger a technical buy signal."
SWKS was last shown in this FSU section on 5/04/15 with annotated graphs under the headline, "Found Prompt Support at 50-Day Moving Average Line". It was highlighted in yellow with pivot point cited based on its 3/23/15 high plus 10 cents in the 5/01/15 mid-day report (read here). Subsequent volume-driven gains above the pivot point are still needed to trigger a technical buy signal.
It showed sales revenues increases of +35%, 51%, +59%, and +58% during the Jun, Sep, Dec '14, and Mar '15 quarterly comparisons, respectively. That is a reassuring sign of great demand for new products or services (N criteria). Meanwhile, earnings increases were +54%, +75%, +88%, and +85% during that same period. Quarterly comparisons have shown earnings well above the +25% minimum guideline (C criteria). Annual earnings (A criteria) history has been strong.
There are 187.3 million shares (S criteria) in the public float. Its Up/Down Volume ratio of 1.2 is an unbiased indication its shares have been under accumulation over the past 50 days. The number of top-rated funds rose from 714 in Jun '14 to 1029 in Mar '15, a reassuring sign concerning the I criteria. The Electronics - Semiconductor Manufacturing group has a Group Relative Strength Rating of 89, a reassuring sign concerning the L criteria.

Skyworks Solutions Inc (SWKS +$0.82 or +0.83% to $99.11) found prompt support at its 50-day moving average (DMA) line, building on a riskier "late-stage" base pattern. It was highlighted in yellow with pivot point cited based on its 3/23/15 high plus 10 cents in the 5/01/15 mid-day report (read here). Subsequent volume-driven gains above the pivot point are needed to trigger a technical buy signal.
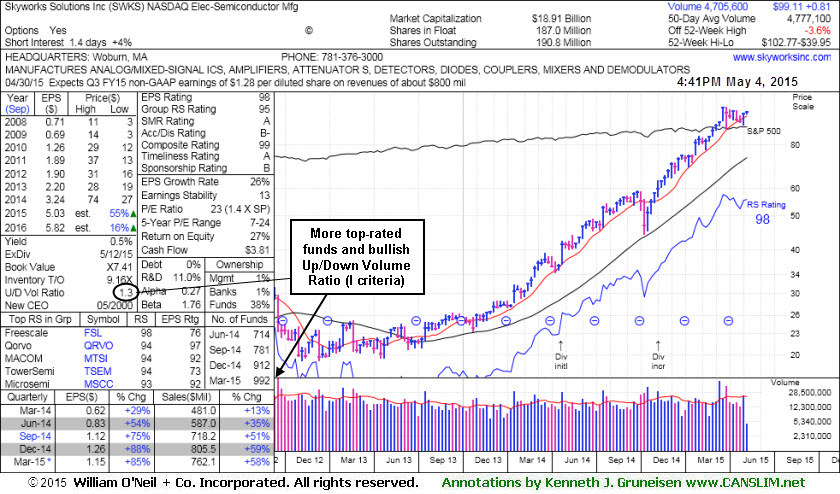
It reported earnings +85% on +58% sales revenues for the Mar '15 quarter, continuing its streak of quarterly comparisons with earnings well above the +25% minimum guideline (C criteria). Annual earnings (A criteria) history has been strong. Its Up/Down Volume ratio of 1.3 is an unbiased indication its shares have been under accumulation over the past 50 days. The number of top-rated funds rose from 714 in Jun '14 to 992 in Mar '15, a reassuring sign concerning the I criteria. The Electronics - Semiconductor Manufacturing group has a Group Relative Strength Rating of 95, a reassuring sign concerning the L criteria.