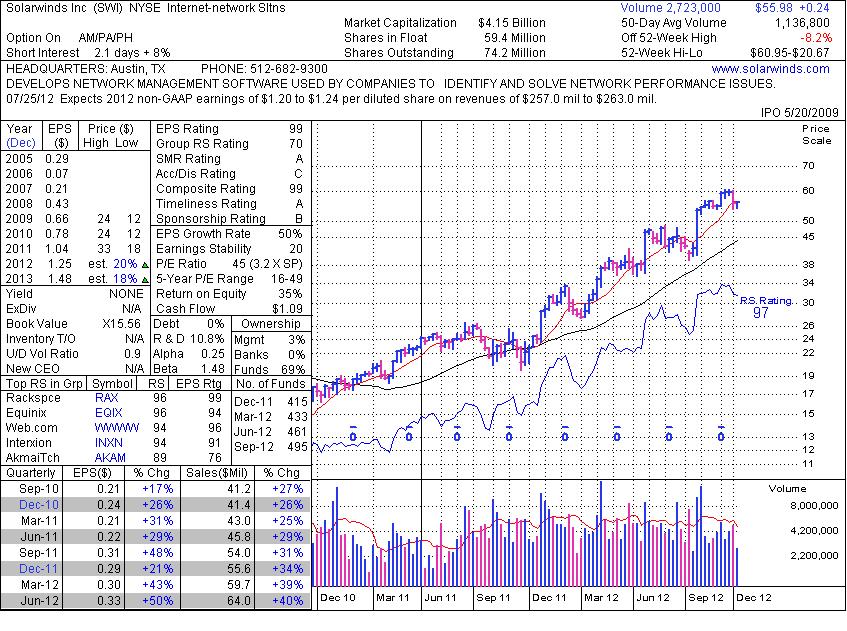
Secondary Buy Point After Testing 10-Week Moving Average - Wednesday, October 03, 2012
Solarwinds Inc (SWI +$0.41 or +0.74% to $55.98) has been sputtering near its 50-day moving average (DMA) line with light volume behind its latest gains. A subsequent violation of the 9/26/12 low ($53.78) would raise more serious concerns and trigger technical sell signals. However, in the Certification they teach that a valid secondary buy point exists from a stock's first successful test of its 10-week moving average (WMA) line up to +5% above the latest highs following an earlier technical breakout. Since it has not formed a new base there is no new pivot point being cited, however its color code was changed to yellow again. Note that the 10 WMA and 50 DMA typically vary only slightly, and the annotated weekly graph below shows how this is the first test of that line in the 2 months since its powerful breakout from the previously noted "double bottom" base pattern. Based on this tactical approach, in this example that secondary buy point may be anywhere up to +5% above its 9/14/12 high or $64.00 ($60.95 times 1.05). Keep in mind that the higher one chases a stock from it prior highs the greater the risk that an ordinary pullback may trigger the loss-limiting sell rules which tell disciplined investors to always sell if a stock falls more than -7% from your purchase price.Its last appearance in this FSU section was on 8/29/12 with an annotated graph under the headline, "No Overhead Supply as Resistance, But No New Base Yet", while holding its ground stubbornly in a tight range near its all-time high as we then observed - "Disciplined investors do not chase extended stocks, they know to wait for a new base or secondary buy point to potentially develop and be noted." It powered further into new high territory after the Labor day holiday with higher volume. It reported earnings +50% on +40% sales revenues for the quarter ended June 30, 2012 versus the year ago period. In 3 of the 4 most current quarterly comparisons its earnings increases were above the +25% guideline meeting the C criteria of the fact-based system. It also has a good annual earnings (A criteria) history. The number of top-rated funds owning its shares rose from 346 in Jun '11 to 495 in Sep '12, a reassuring sign concerning the I criteria of the fact-based investment system. Its relatively small supply of only 59.4 million shares outstanding (S criteria) can contribute to greater price volatility in the event of institutional buying or selling.
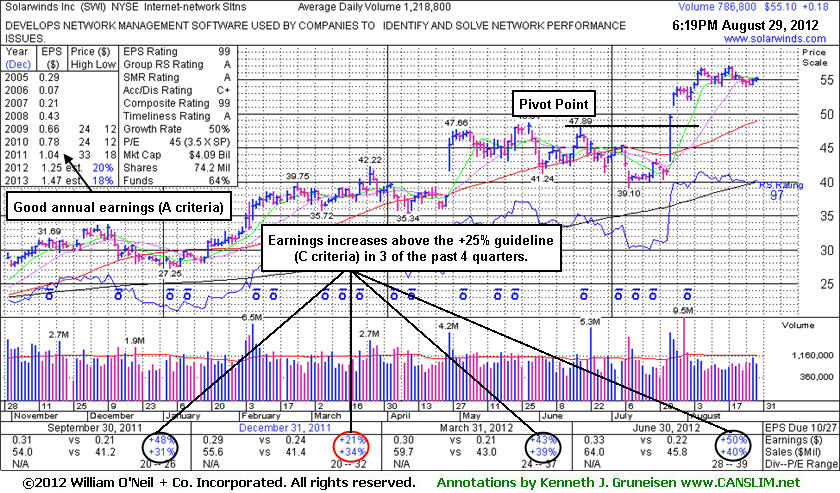
No Overhead Supply as Resistance, But No New Base Yet - Wednesday, August 29, 2012
Solarwinds Inc (SWI $0.18 or -0.33% to $55.10) has been holding its ground stubbornly in a tight range near its all-time high. No overhead supply remains to act as resistance, however it has not formed a sound new base of sufficient length. Prior highs and its 50-day moving average line (the red line) coincide in the $48 area defining an important chart support level to watch on pullbacks. Its last appearance in this FSU section was on 7/30/12 with an annotated graph under the headline, "Pause Following Spurt of Volume-Driven Gains to New Highs". It had gapped up and spiked to a new 52-week high on 7/25/12 with a considerable gain backed by 4 times average volume rallying from a "double bottom" base pattern. Then it quickly rallied beyond its "max buy" level with above average volume behind gains indicative of heavy institutional buying demand.
It reported earnings +50% on +40% sales revenues for the quarter ended June 30, 2012 versus the year ago period. In 3 of the 4 most current quarterly comparisons its earnings increases were above the +25% guideline meeting the C criteria of the fact-based system. It also has a good annual earnings (A criteria) history. The number of top-rated funds owning its shares rose from 346 in Jun '11 to 463 in Jun '12, a reassuring sign concerning the I criteria of the fact-based investment system. Its relatively small supply of only 59.4 million shares outstanding (S criteria) can contribute to greater price volatility in the event of institutional buying or selling. Disciplined investors do not chase extended stocks, they know to wait for a new base or secondary buy point to potentially develop and be noted.
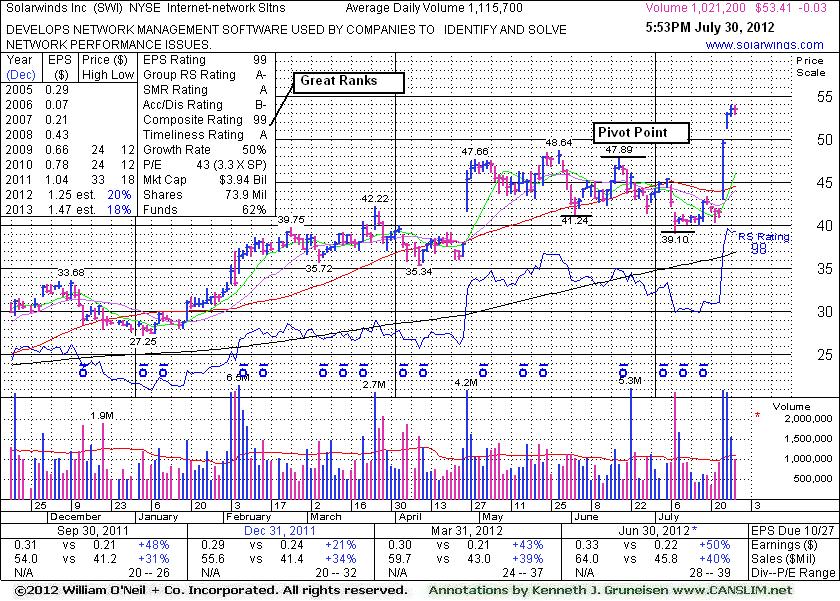
Pause Following Spurt of Volume-Driven Gains to New Highs - Monday, July 30, 2012
Solarwinds Inc (SWI -$0.03 or -0.06% to $53.41) paused today near its all-time high after 3 consecutive volume-driven gains. No overhead supply remains to act as resistance. It quickly rallied beyond its "max buy" level with above average volume behind last week's gains after reporting earnings +50% on +40% sales revenues for the quarter ended June 30, 2012 versus the year ago period. In 3 of the 4 most current quarterly comparisons its earnings increases were above the +25% guideline meeting the C criteria of the fact-based system. It has a good annual earnings (A criteria) history. The number of top-rated funds owning its shares rose from 346 in Jun '11 to 455 in Jun '12, a reassuring sign concerning the I criteria of the fact-based investment system.
It gapped up and spiked to a new 52-week high on 7/25/12 with a considerable gain backed by 4 times average volume rallying from a "double bottom" base pattern. It was rallying above its 50-day moving average line and on the rise when highlighted in yellow in that day's mid-day report (read here) with new pivot point cited based on its 6/19/12 high. Its last appearance in this FSU section was on 6/15/12 with an annotated graph under the headline, "Secondary Buy Point After Finding Support". However, subsequent damaging violations of its 50-day moving average line and deterioration below the 6/04/11 low ($41.24) had triggered more worrisome technical sell signals. Disciplined investors always limit losses by selling any stock that falls more than -7% from their purchase price. Risk management is crucial to investors' success, meanwhile a stock that is sold can always be bought back again if strength returns.
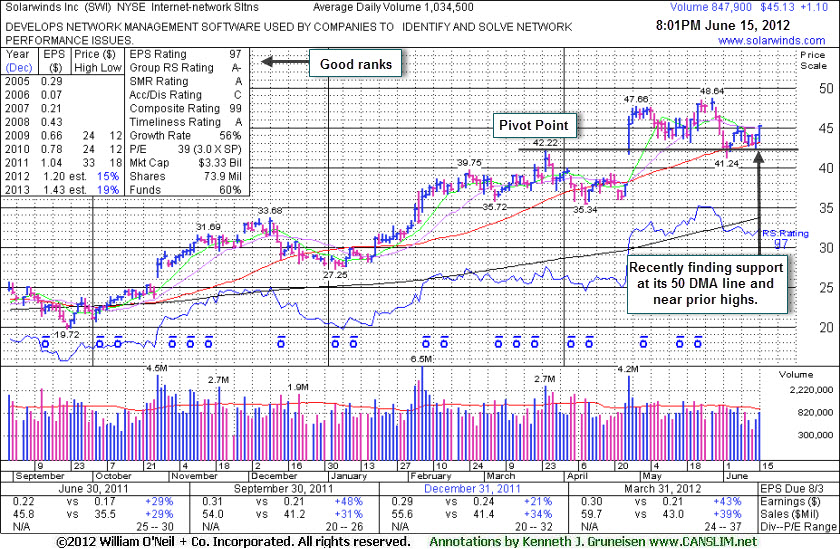
Secondary Buy Point After Finding Support - Friday, June 15, 2012
Solarwinds Inc (SWI +$1.10 or +2.50% to $45.13) is consolidating just above its 50-day moving average (DMA) line and prior highs defining important near-term chart support. It posted another gain on below average volume today. Any damaging violation of that short-term average and the 6/04/11 low ($41.24) would trigger more worrisome technical sell signals.
Its color code has been changed to yellow while no new pivot point is being cited. As the teach in the Certification, a secondary buy point exists between a stock's first successful test of its 10-week moving average up to +5% above its recent high ($48.64 plus another 5% in this case) following an earlier technical breakout.
Its last appearance in this FSU section was on 5/21/12 with an annotated graph under the headline, "Consolidation Following Gap Up on Stronger Earnings and Sales". It reported earnings +43% on +39% sales revenues for the quarter ended March 31, 2012 versus the years ago period. In 3 of the 4 most current quarterly comparisons its earnings increases were above the +25% guideline meeting the C criteria of the fact-based system.
It has a good annual earnings (A criteria) history. The number of top-rated funds owning its shares rose from 346 in Jun '11 to 435 in Mar '12, a reassuring sign concerning the I criteria of the fact-based investment system.
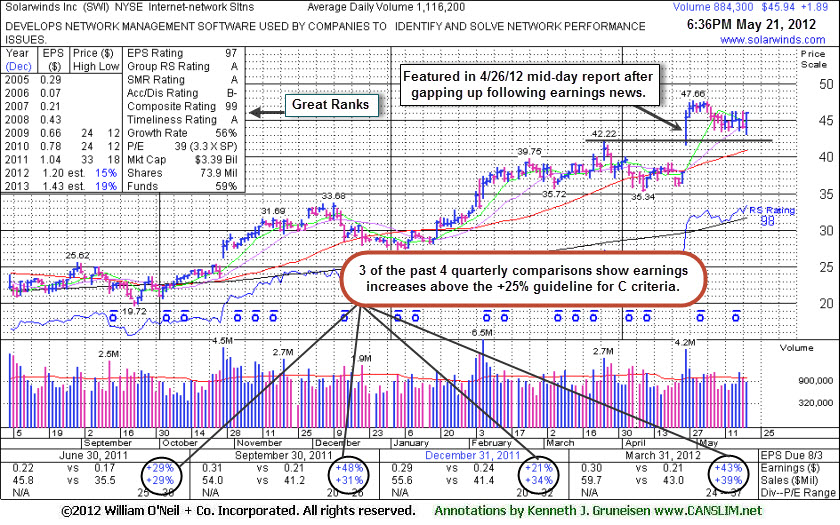
Consolidation Following Gap Up on Stronger Earnings and Sales - Monday, May 21, 2012
Solarwinds Inc (SWI +$1.89 or +4.29% to $45.94) finished near the session high today with a gain on light volume. It has been consolidating above prior highs since it was featured again on 4/26/12 following a considerable gap up gain on heavy volume. It reported earnings +43% on +39% sales revenues for the quarter ended March 31, 2012 versus the years ago period. Now, 3 of the 4 most current quarterly comparisons show earnings increases above the +25% guideline meeting the C criteria of the fact-based system.
After a damaging loss on 4/10/12 with average volume triggered technical sell signals it was noted and dropped from the Featured Stocks list based on its deterioration. Its last appearance in this FSU section was on 3/16/12 with an annotated graph under the headline, "Remaining Strong After Latest Quarter's Sub Par Earnings", as it was showing resilience after its Dec '11 quarterly report with earnings increasing below the +25% guideline of the fact-based system.
It has a good annual earnings (A criteria) history. The number of top-rated funds owning its shares rose from 346 in Jun '11 to 428 in Mar '12, a reassuring sign concerning the I criteria of the fact-based investment system.
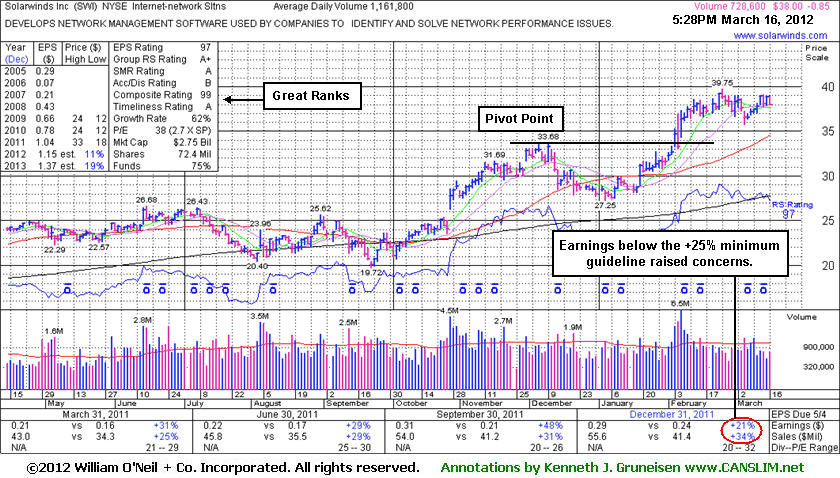
Remaining Strong After Latest Quarter's Sub Par Earnings - Friday, March 16, 2012
Solarwinds Inc (SWI -$0.85 or -2.19% to $38.00) is perched -4.4% off its 52-week high and it has shown resilience after its latest report showed earnings increasing below the +25% guideline of the fact-based system. Repeated notes regarding the Dec '11 quarter have warned that the sub par results raised fundamental concerns. Disciplined investors might sooner consider buy candidates without any fundamental flaws. Investors who are holding the stock might give it the benefit of the doubt and allow it a chance to potentially produce greater gains in a favorable market environment, but be watching out for technical sell signals.Its last appearance in this FSU section was on 1/26/12 with an annotated weekly graph under the headline, "Forming New Base Pattern Worth Watching." A burst of institutional buying on 2/03/12 confirmed a new technical buy signal. However, soon thereafter it reported earnings +21% on +34% sales revenues for the quarter ended December 31, 2011 versus the year ago period. Prior quarterly comparisons showed sales and earnings (C criteria) above the investment system guidelines. It has a good annual earnings (A criteria) history. The number of top-rated funds owning its shares rose from 263 in Dec '10 to 419 in Dec '11, a reassuring sign concerning the I criteria of the fact-based investment system.
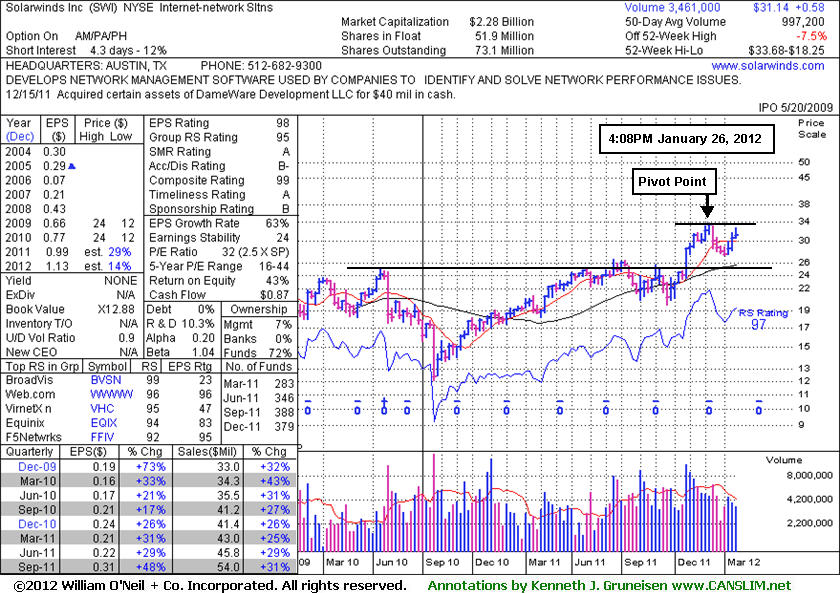
Forming New Base Pattern Worth Watching - Thursday, January 26, 2012
Solarwinds Inc (SWI +$0.39 or +1.26% to $31.33) recently rebounded above its 50-day moving average (DMA) line and it is -7.5% off its 52-week high after an 8-week consolidation. In the earlier mid-day report today (read here) it was featured again in yellow with a new pivot point cited based on its 52-week high plus 10 cents. It has shown resilience since dropped from the Featured Stocks list on 1/04/12. Disciplined investors may watch for a fresh burst of institutional buying to confirm a new technical buy signal. In the meanwhile it makes an ideal candidate for investors to have on their watchlist.Under the headline "Secondary Buy Point Possibly Forming", the last appearance in this FSU section on 12/19/11 discussed secondary buy points following an earlier breakout. Following that analysis, however, it violated its 50-day moving average (DMA) line and raised some concerns with its distributional action, yet it found support well above prior chart highs in the $25-26 area. An earlier appearance in this FSU section on 10/27/11 included an annotated daily graph under the headline, "Breakaway Gap From Double Bottom Base Pattern", at the outset of its rally to as high as $33.68 on 12/09/11.
It reported earnings +48% on +31% sales revenues for the quarter ended September 30, 2011 versus the year ago period. Prior quarterly comparisons showed sales and earnings (C criteria) above the investment system guidelines and it also has a good annual earnings (A criteria) history. The number of top-rated funds owning its shares rose from 263 in Dec '10 to 379 in Dec '11, a reassuring sign concerning the I criteria of the fact-based investment system.
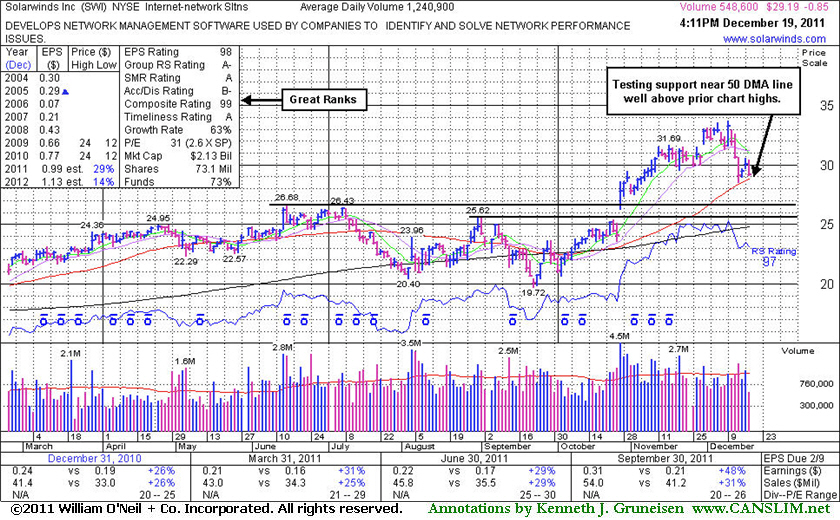
Secondary Buy Point Possibly Forming - Monday, December 19, 2011
Solarwinds Inc (SWI -$0.78 or -2.60% to $29.26) halted its slide after slumping near its 50-day moving average (DMA) line last week. That important short-term average was noted as initial support to watch above prior chart highs. Its last appearance in this FSU section was on 11/22/11 with an annotated graph included under the headline, "Strong Tech Leader Extended From Prior Base."
It is still extended from its previous base pattern. Prior highs in the $25-26 area define initial chart support to watch below its 50 DMA line in the event a violation triggers a technical sell signal. Meanwhile, in the Certification program they teach that a secondary buy point to watch for (following a sound earlier breakout) is from the first successful test of support at a stock's 50 DMA line up to as much as +5% above its latest high. In this case, assuming SWI finds support near that important short-term average, it would then be buyable up to +5% above the latest high hit on 12/09/11 or $33.68 X 1.05 = $35.36.
It reported earnings +48% on +31% sales revenues for the quarter ended September 30, 2011 versus the year ago period. Prior quarterly comparisons showed sales and earnings (C criteria) above the investment system guidelines and it also has a good annual earnings (A criteria) history. The number of top-rated funds owning its shares rose from 263 in Dec '10 to 389 in Sep '11, a reassuring sign concerning the I criteria of the fact-based investment system.
The 10/27/11 "breakaway gap" helped SWI technically break out from a "double bottom" base formed over the prior 5 months. Volume was more than 4 times average behind the considerable gain, a clear indication of institutional accumulation. At the time it was noted - "A breakaway gap is the one noted exception where a stock may be bought more than +5% above its prior highs, however chasing a stock farther above prior highs increases the chance investors may be prompted to sell based on an ordinary pullback if they follow strict selling rules which say to always limit losses if a stock falls more than -7% from your purchase price."
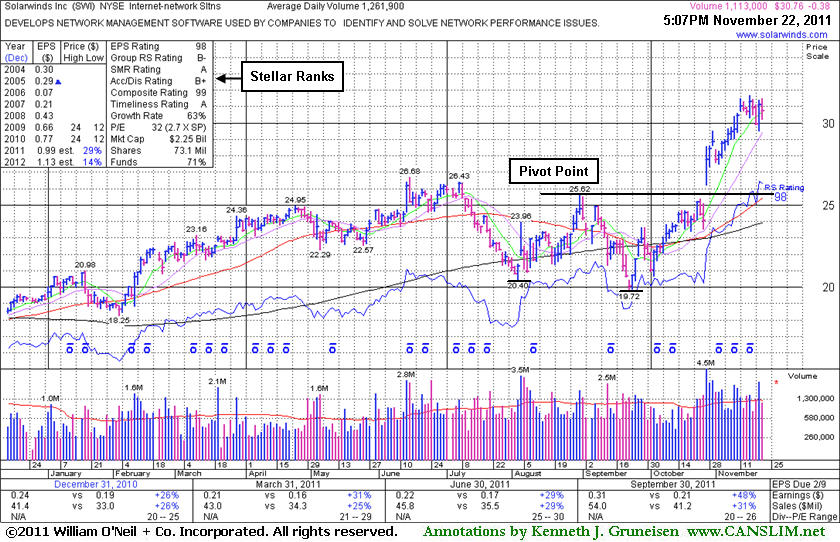
Strong Tech Leader Extended From Prior Base - Tuesday, November 22, 2011
Solarwinds Inc (SWI -$0.38 or -1.22% to $30.76) posted a small loss today on near average volume, holding its ground only -2.9% off its all-time high. It is extended from its previous base pattern. Prior highs in the $25-26 area define initial chart support to watch on pullbacks. Its last appearance in this FSU section was on 10/27/11 with an annotated graph included under the headline, "Breakaway Gap From Double Bottom Base Pattern." It has hardly looked back since then.
SWI reported earnings +48% on +31% sales revenues for the quarter ended September 30, 2011 versus the year ago period. Prior quarterly comparisons showed sales and earnings (C criteria) above the investment system guidelines and it also has a good annual earnings (A criteria) history. The number of top-rated funds owning its shares rose from 264 in Dec '10 to 381 in Sep '11, a reassuring sign concerning the I criteria of the fact-based investment system.
The 10/27/11 "breakaway gap" helped SWI technically break out from a "double bottom" base formed over the prior 5 months. Volume was more than 4 times average behind the considerable gain, a clear indication of institutional accumulation. At the time it was noted - "A breakaway gap is the one noted exception where a stock may be bought more than +5% above its prior highs, however chasing a stock farther above prior highs increases the chance investors may be prompted to sell based on an ordinary pullback if they follow strict selling rules which say to always limit losses if a stock falls more than -7% from your purchase price." Patience may allow for another base or secondary buy point to possibly develop and be noted in the weeks ahead, meanwhile it is too extended to be considered an ideal buy candidate for now.
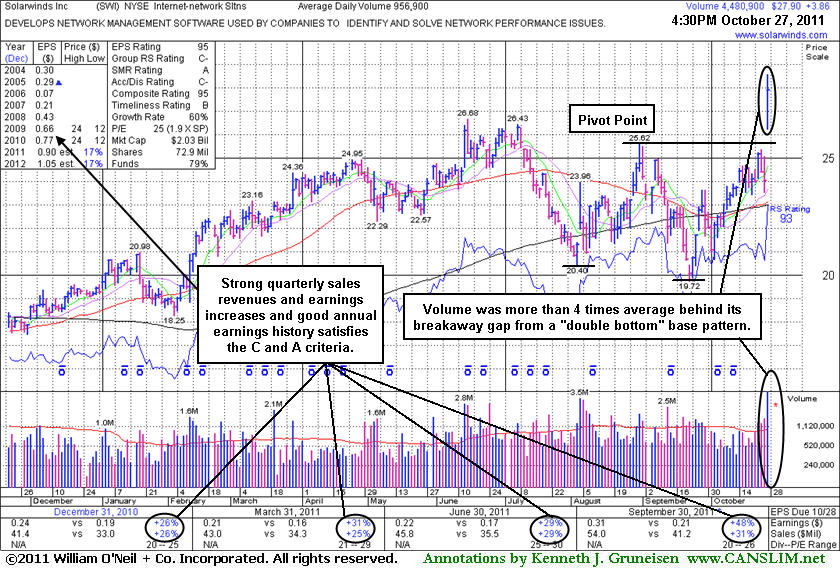
Breakaway Gap From Double Bottom Base Pattern - Thursday, October 27, 2011
Solarwinds Inc (SWI +$3.86 or +16.06% to $27.90) gapped up today after reporting earnings +48% on +31% sales revenues for the quarter ended September 30, 2011 versus the year ago period. It was highlighted in yellow it the mid-day report (read here) with new pivot point cited based on the 8/31/11 high. Following its last appearance in this FSU section on 6/29/11 with an annotated graph included under the headline, "Prior Highs Acted As Support Following Powerful Breakout", it continued its consolidation and remained in good shape until a loss with above average volume on 7/14/11 triggered a technical sell signal that was noted. It was dropped from the Featured Stocks list on 7/21/11 and subsequently slumped below its 200-day moving average (DMA) line.
Today's "breakaway gap" helped SWI technically break out from a "double bottom" base formed over the past 5 months. Volume was more than 4 times average behind the considerable gain, a clear indication of institutional accumulation. A breakaway gap is the one noted exception where a stock may be bought more than +5% above its prior highs, however chasing a stock farther above prior highs increases the chance investors may be prompted to sell based on an ordinary pullback if they follow strict selling rules which say to always limit losses if a stock falls more than -7% from your purchase price.
Prior quarterly comparisons showed sales and earnings near the investment system guidelines, and the latest quarter showed even better increases which marked an acceleration in its growth rate. The number of top-rated funds owning its shares rose from 291 in June '10 to 404 in Sep '11, a reassuring sign concerning the I criteria of the fact-based investment system.
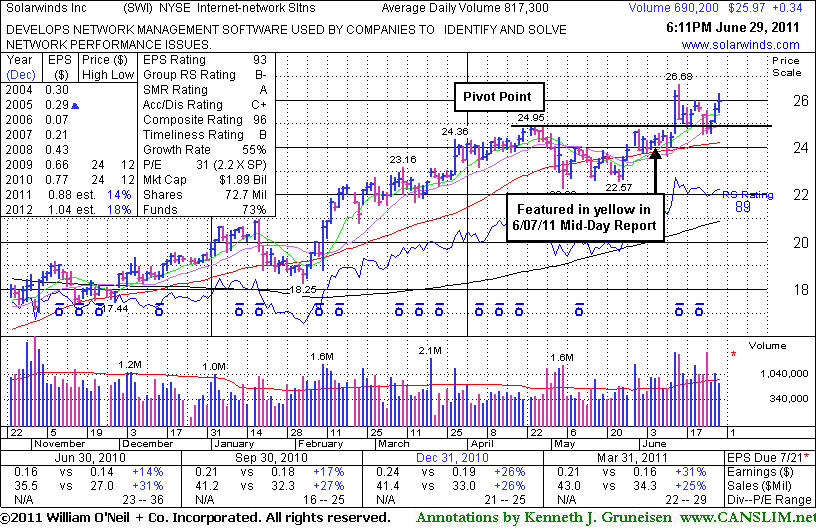
Prior Highs Acted As Support Following Powerful Breakout - Wednesday, June 29, 2011
Solarwinds Inc (SWI +$0.34 or +1.33% to $25.97) finished at its 2nd best close today, rising toward its 52-week high. Prior resistance in the $24-25 area defines support, and a subsequent close under its old high close ($24.77 on 4/25/11) would raise concerns by negating its recent breakout. Typically about 40% of successful breakouts pull back and test support at prior highs before continuing higher. In its last appearance in this FSU section on 6/08/11 an annotated graph was included under the headline, "Favorable Set-Up In Weak Market Environment", it was perched -2.9% off its all-time high with no overhead supply to hinder its progress. Its color code was changed to yellow when it was featured in the 6/07/11 mid-day report (read here) after an orderly base with pivot point based upon its 52-week high plus 10 cents.Disciplined investors know that to trigger a buy signal this high-ranked Internet - Network Solutions group leader needed a gain above its pivot point with sufficient volume. Its powerful breakout came on 6/14/11, and that big volume-driven gain also helped it clear the April 2010 high that was reached while it survived but failed to impress since it was dropped from the Featured Stocks list on 10/28/09. It reported earnings +31% on +25% sales revenues for the quarter ended March 31, 2011 versus the year ago period. Prior quarterly comparisons showed sales and earnings near the investment system guidelines. The number of top-rated funds owning its shares rose from 291 in June '10 to 313 in Mar '11, a reassuring sign concerning the I criteria of the fact-based investment system. One concern that overrides all of its bullish characteristics, however, is the M criteria. Most stocks have faltered along with the broader market in recent weeks, making this outlier an exception.
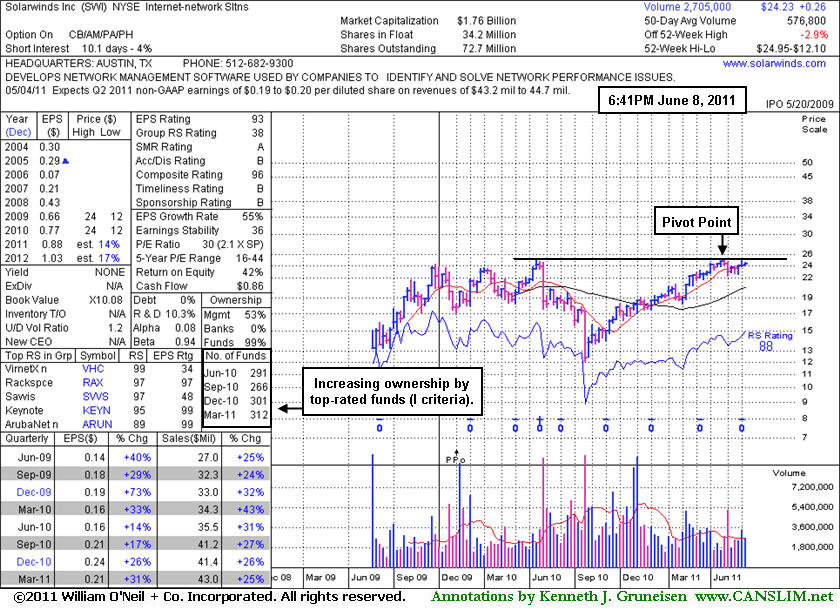
Favorable Set-Up In Weak Market Environment - Wednesday, June 08, 2011
Solarwinds Inc (SWI -$0.12 or -0.49% to $24.23) is perched -2.9% off its all-time high today, and no overhead supply remains to hinder its progress. Its color code was changed to yellow after an orderly base with pivot point based upon its 52-week high plus 10 cents. Disciplined investors know that to trigger a buy signal this high-ranked Internet - Network Solutions group leader needs a gain above its pivot point with sufficient volume and a follow-through day to also confirm that the broader market (M criteria) is favorable. It reported earnings +31% on +25% sales revenues for the quarter ended March 31, 2011 versus the year ago period. Prior quarterly comparisons showed sales and earnings near the investment system guidelines. The number of top-rated funds owning its shares rose from 291 in June '10 to 312 in Mar '11, a reassuring sign concerning the I criteria of the fact-based investment system.
A subsequent rally above its pivot point would also help it clear the April 2010 high that was reached while it survived but failed to impress since it was dropped from the Featured Stocks list on 10/28/09. Management owns a large 53% interest in its shares, keeping the directors motivated to build and maintain shareholder value. However, that could also make it a ripe candidate for Secondary Offerings which, if proposed, might be a short-term hindrance. One other concern is the currently low Group Relative Strength Rating (38). Rackspace Hosting Inc (RAX) and Aruba Networks Inc. (ARUN) have been among the group's strong leaders in the not-too-distant past, however they have both faltered along with the broader market in recent weeks.
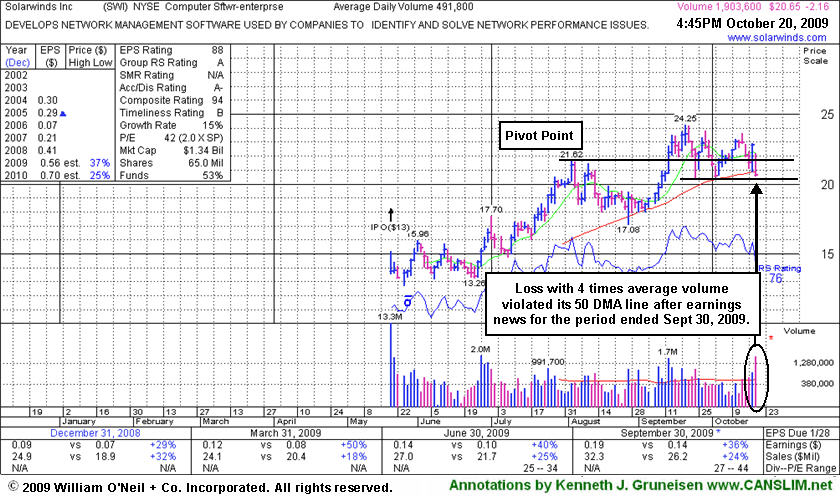
Sell-Off On Earnings News Pressures Firm To Close Below 50-Day Line - Tuesday, October 20, 2009
SolarWinds, Inc. (SWI -$2.11 or -9.25% or $20.70) gapped down today after reporting earnings results for the quarterly period ended Sept 30, 2009. It slumped under its old pivot point again and violated its 50 DMA line, raising concerns while closing near the session low with a considerable loss on nearly 4 times average volume. Failure to find prompt support near its short-term average and near recent chart lows in the $20.50 area would raise more serious concerns, meanwhile any further weakness could trigger a more definitive technical sell signal. This high-ranked Computer Software - Enterprise firm has had a difficult time producing gains backed by above average volume since it was recently featured in the October 2009 issue of CANSLIM.net News (read here).
Strong Performing New Issue In Computer Software - Wednesday, September 30, 2009
|
SolarWinds Inc. |
| |
|
Ticker Symbol: SWI (NYSE) |
Industry Group: Computer Software- Enterprise |
Shares Outstanding: 65,000,000 |
|
Price: $22.03 9/30/09 |
Day's Volume: 349,800 9/30/2009 4:03pm ET |
Shares in Float: 5,200,000 |
|
52 Week High: 24.25 9/21/2009 |
50-Day Average Volume: 504,400 |
Up/Down Volume Ratio: 1.7 |
|
Pivot Point: $21.72 8/04/2009 high plus .10 |
Pivot Point +5% = Max Buy Price: $22.80 |
Web Address: http://www.solarwinds.com/ |

CANSLIM.net Profile: SolarWinds, Inc. provides enterprise-class network management software for network professionals and other information technology professionals. The company's customers include small and mid-size businesses; enterprises; and local, state, and federal government entities. The stock resides in the Computer-Software/Enterprise group which is presently ranked 44th on the 197 Industry Groups list which is inside the much-preferred top quartile of groups needed to satisfy the L criteria. This is a fairly new issue and the fact that there are already 55 top-rated funds with an ownership interest is a strong sign needed to satisfy the institutional interest (the I criteria). Quarterly earnings increases have been above the +25% guideline, satisfying the C criteria. Management owns a whopping 73% of outstanding shares, keeping them very motivated to look after and build shareholder value.
What to Look For and What to Look Out For: Look for the stock to continue offer investors a chance to accumulate shares below its maximum buy price ($22.80) on light volume pullbacks. Keep in mind that much of a stock's success depends on the broader market's ability to sustain a meaningful rally, otherwise 3 out of 4 stocks are likely to struggle in the event that the latest rally falls into a correction. It is very important for the stock's pullback to be contained, whereas a violation of its $21.62 pivot point would have the effect of technically negating its latest breakout, raising concerns. Any closes under its old high closes also would not bode well. Conversely, if the stock finds support near/above its pivot point then begins advancing again, preferably on higher volume, then odds would favor that even higher prices will follow. Only 5.2 million shares (the S criteria) are in the public float, so it might be very volatile in the event of accumulation or distributional pressure from large institutional investors. That's another good reason to be disciplined about your buy and sell tactics.
Technical Analysis: The stock broke out of a 5-week flat base on September 14th on heavy volume and quickly sprinted to a new all-time high before its latest pullback. So far, the consolidation has been constructive. Keep in mind that approximately 40% of successful breakouts pull back and test support at prior highs before continuing higher. The stock remains buyable as long as it continues trading above its 50 DMA line and prior chart highs.