Consolidation Above 50 DMA Line is Healthy - Tuesday, May 29, 2007
A very important technical tool that savvy investors have learned to incorporate in their technical analysis is the 50-day moving average (DMA) line. The 50 DMA line plays a pivotal role relative to a stock's price. If the price of a stock is above its 50 DMA then odds are that its 50 DMA will act as formidable support. Conversely, if the price is below its 50 DMA then the moving average acts as resistance. Healthy stocks sometimes trade under their 50 DMA lines briefly, but usually a strong candidate will promptly bounce and repair a 50 DMA violation. When a stock has violated its 50 DMA line and then lingers beneath it, the stock's outlook gets worse and worse as it spends a greater period of time trading under that important short-term average line. Once the 50 DMA line starts sloping downward it should also be acknowledged that the stock has been struggling for a while, and it might be time to reduce exposure and look for places to put that money to work in stronger buy candidates.
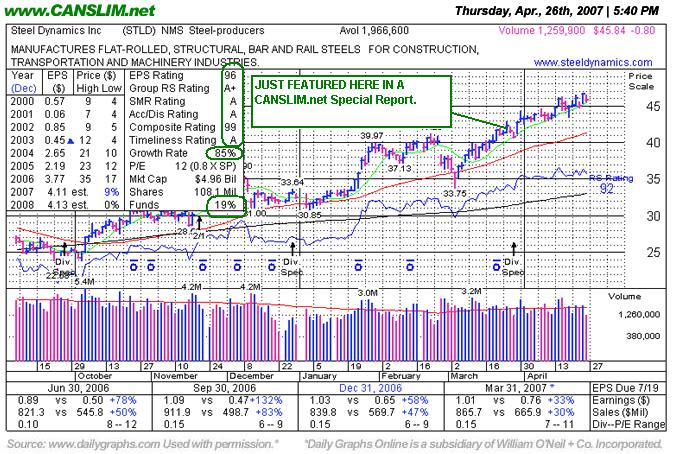
Steel Dynamics Inc. (STLD -$0.69 or -1.47% to $46.30) closed in the upper half of its range today, thus far remaining above the support expected at its 50-day moving average (DMA) line. Its recent breach of an upward trendline raised concerns as it suffered losses on above average volume last week. The stock had been steadily rallying for the past several months above its 50 DMA line, which is typical action for a healthy stock. As long as this stock continues finding support above its 50 DMA line, odds favor that higher prices will follow. However, if the bears emerge and send this stock below that important moving average line, then the next areas of chart support would be expected at its May 1st low of $43.10, and then all the way back down at its latest pivot point of $41.30.
This stock has made several appearances this year in CANSLIM.net reports, first featured in the CANSLIM.net Mid Day BreakOuts Report on Thursday, January 25, 2007 with a $36.00 pivot point (read here). By February 22nd the stock had traded +10.45% higher, but then it gapped down drastically on February 27, 2007 as the major averages abruptly sold off. As the stock rallied towards its prior chart highs it was featured again in the March 16, 2007 CANSLIM.net After Market Update (read here) as it was setting up to potentially breakout of its latest base. A few days later, on the March 21, 2007 session in which the major market averages produced a reassuring follow-through day of gains on heavier volume, STLD jumped to a new high -but volume failed to meet the +50% above average guideline to trigger a proper new technical buy signal. STLD was also highlighted on March 22, 2007 in the CANSLIM.net Special Report "8 Stocks That Should Now Be On Your Watchlist" (read here) with a new pivot point of $41.30. Volume was light as this stock initially traded above its new pivot point, preventing a sound technical buy signal from being triggered. Finally, on March 30, 2007, patient investors were rewarded with a new technical buy signal after volume expanded behind more gains - and at that time it was still within 5% of its pivot point, thus not extended beyond the "max buy" guideline. As always, strictly selling whenever a stock falls 7-8% from your purchase price is the best way to prevent greater losses.
C A N S L I M | StockTalk | News | Chart | ![]() DGO | SEC | Zacks Reports
DGO | SEC | Zacks Reports
View all notes | Alert me of new notes | CANSLIM.net Company Profile
Great Example of a Winning Stock Featured at CANSLIM.net - Thursday, April 26, 2007
A classic example of the success enjoyed by many CANSLIM.net readers usually starts when an investor reads a CANSLIM.net report and buys a featured stock before it has risen above the pivot point by greater than 5%. After a stock breaks out above its pivot point, there is only a +5% window that investors have to purchase the stock under the proper guidelines. Once a stock rises above the "maximum buy price" the risk of a shake out balloons, meaning that even a normal retracement in the stock might force you to employ the 7-8% loss cutting rule. Much can be told by the stock's daily action in the weeks and months that follow a breakout. Typically, a light volume and orderly pullback suggests that the bulls remain in control. However, high volume pullbacks that violate support paint a totally different picture.
Steel Dynamics Inc. (STLD -$0.80 or -1.71% to $45.84) closed today's session lower on below average volume, which is healthy action considering its recent gains. It has made several appearances this year in CANSLIM.net reports, first featured in the CANSLIM.net Mid Day BreakOuts Report on Thursday, January 25, 2007 with a $36.00 pivot point (read here). By February 22nd the stock had traded +10.45% higher, but then it gapped down drastically on February 27, 2007 as the major averages abruptly sold off. Regular readers of CANSLIM.net reports know that we have often cited the statistic that approximately 40% of winning stocks pullback and retest support near their pivot points before moving higher. That generally describes what has happened in this instance. While STLD violated its 50 DMA as the major averages suffered a steep correction, many investors could have easily justified selling. However, healthy stocks typically do not fall under their pivot point by more than 7%. This can help emphasize the importance of buying breakouts very near their pivot point, so you are less likely to have the 7-8% "max loss" sell rule force you to take protective measures and unload a stock that is still in pretty decent shape technically. There is no doubt that STLD had clearly negated most of the bullish action by March 5, 2007, as it fell under its 50-day moving average (DMA) line and traded under support at prior chart highs. However, it promptly repaired the bearish action and rallied back above its 50 DMA line on the very next session, and within a week it was trading just below its all-time highs again. Even at its absolute intra-day low ($33.75) on March 5th it was trading just -6.25% below its pivot point, and it closed that session above the lows an at $35.00 even, near the middle of that day's trading range.
As the stock rallied towards its prior chart highs it was featured again in the March 16, 2007 CANSLIM.net After Market Update (read here) as it was setting up to potentially breakout of its latest base. A few days later, on the March 21, 2007 session in which the major market averages produced a reassuring follow-through day of gains on heavier volume, STLD jumped to a new high -but volume failed to meet the +50% above average guideline to trigger a proper new technical buy signal. STLD was also highlighted on March 22, 2007 in the CANSLIM.net Special Report "8 Stocks That Should Now Be On Your Watchlist" (read here) with a new pivot point of $41.30. Volume was light as this stock initially traded above its new pivot point, preventing a sound technical buy signal from being triggered. Finally, on March 30, 2007, patient investors were rewarded with a new technical buy signal after volume expanded behind more gains - and at that time it was still within 5% of its pivot point, thus not extended beyond the "max buy" guideline.
Steel Dynamics closed -1.9% below its 52-week high, and it is +11% above its latest pivot point, up +27% from its original pivot point. The company just reported strong first quarter results, and helping keep the "C" criteria satisfied, earnings per share rose by +33% as sales revenues jumped by +30%. The stock has also traced out a well-defined steep upward trendline. Whenever this trendline is breached, it could be considered an early sell signal, but until then the odds favor even further gains. As always, strictly selling whenever a stock falls 7-8% from your purchase price is the best way to prevent greater losses.
C A N S L I M | StockTalk | News | Chart | ![]() DGO | SEC | Zacks Reports
DGO | SEC | Zacks Reports
View all notes | Alert me of new notes | CANSLIM.net Company Profile
Strong Steel Stock In Weak Market - Friday, March 16, 2007
Often, when a leading stock is setting up to breakout of a solid base it is highlighted in CANSLIM.net's Mid-Day Breakouts Report. The most relevant factors are noted in the report which allows prudent CANSLIM oriented investors to place the issue in their watch list. After doing any necessary backup research, the investor is prepared to act if and when the stock triggers a technical buy signal (breaks above its pivot point on more than +50% average turnover). In the event the stock fails to trigger a technical buy signal and its price declines then it will simply be removed from the watch list.
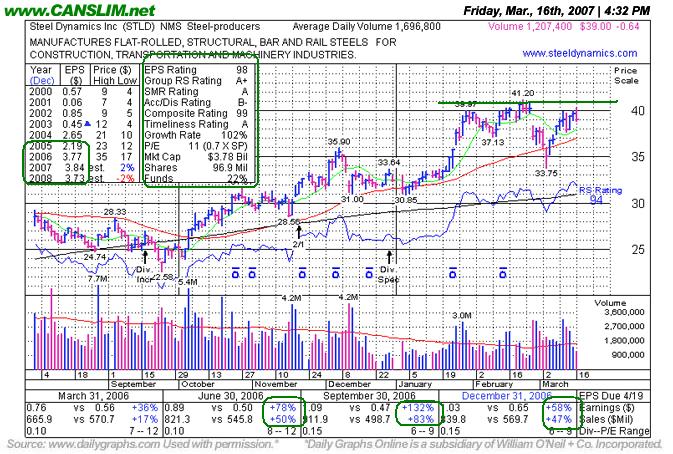
Steel Dynamics Inc. (STLD -$0.65 or -1.64% to $38.99) was recently featured on Thursday, January 25, 2007 with a $36.00 pivot point (read here). Soon thereafter, the stock appeared in the January 29, 2007 After Market Report (read here) discussing its "Near perfect post breakout action." The stock rallied nearly +14% before turning back down, like many of its peers, as the major averages started correcting. On March 5, 2007 STLD briefly sliced under its 50 DMA line and traded under support at prior chart highs, which negated the recent bullish action. However, it promptly repaired the bearish action and rallied back above its 50 DMA. Within a week, STLD was trading just below its all-time highs. Steel Dynamics is currently just -5.4% below its 52-week high and tracing out a new base-on-base pattern with a new pivot point of $41.30. It is very important to build a healthy watch list when the major averages are in a correction. A better case might be made to buy this stock, or any other strong candidate, on or after a solid follow-through day. But low earnings estimates forecasted for its 2007 and 2008 fiscal years also raise some concerns. As always, strictly selling whenever a stock falls 7-8% from your purchase price is the best way to prevent greater losses.
C A N S L I M | StockTalk | News | Chart | ![]() DGO | SEC | Zacks Reports
DGO | SEC | Zacks Reports
View all notes | Alert me of new notes | CANSLIM.net Company Profile |
Near Perfect Post Breakout Action - Monday, January 29, 2007
A classic example of the success enjoyed by many CANSLIM.net readers usually starts when an investor reads a CANSLIM.net report and buys a featured stock before it has risen above the pivot point by greater than 5%. After a stock breaks out above its pivot point, there is only a +5% window that investors have to purchase the stock under the proper guidelines. Once a stock rises above the "maximum buy price" the risk of a shake out balloons, meaning that even a normal retracement in the stock might force you to employ the 7-8% loss cutting rule. Much can be told by the stock's daily action in the weeks and months that follow a breakout. Typically, a light volume and orderly pullback suggests that the bulls remain in control. However, high volume pullbacks that violate support paint a totally different picture.
Steel Dynamics Inc. (STLD +$1.67 or +4.13% to $38.75) was recently featured on Thursday, January 25, 2007 with a $36.00 pivot point and a $37.80 maximum buy price. This company sports a very healthy Earnings Per Share (EPS) rating of 98 and a very healthy Relative Strength (RS) rating of 90. STLD resides in the Steel-Producers group which is currently ranked 42nd out of the 197 Industry Groups covered in the paper, placing it in the much preferred top quartile and satisfying the "L" criteria. It is an encouraging reassurance of leadership to see its Relative Strength Line reaching new highs as the price has surged to new highs. It is important to be disciplined and not "chase" a stock above the pivot point by more than 5%, the "maximum buy" price. Once a stock is clear of all overhead supply the path of least resistance is likely to lead it even higher, however when a stock rolls over and trades back below its pivot point, the bullish breakout action is negated and lower prices become more likely to follow. As always, stocks should be sold if the price ever falls 7-8% below your purchase price, as that is the "max loss" guideline for properly protecting your capital.
C A N S L I M | StockTalk | News | Chart | ![]() DGO | SEC | Zacks Reports
DGO | SEC | Zacks Reports
View all notes | Alert me of new notes | CANSLIM.net Company Profile
STLD- Recent Breakout Should Show Reassuring Volume Increase Confirming Gains - Sunday, December 03, 2006
|
Steel Dynamics, Inc. |
||
|
Ticker Symbol: STLD (NASDAQ) |
Industry Group: Steel & Iron |
Shares Outstanding: 91,860,000 |
|
Price: $32.00 |
Day's Volume: 1,108,480 12/1/2006 |
Shares in Float: 82,580,000 |
|
52 Week High: $34.97 5/11/2006 |
50-Day Average Volume: 2,521,400 |
Up/Down Volume Ratio: 1.4 |
|
Pivot Point: $31.71 10/27/2006 high plus .10 |
Pivot Point +5% = Max Buy Price: $33.30 |
Web Address: http://www.steeldynamics.com |
C A N S L I M | StockTalk | News | Chart |
View all notes | Alert me of new notes | CANSLIM.net Company Profile
CANSLIM.net Profile: Steel Dynamics, Inc. (STLD) engages in the manufacture and sale of steel in the
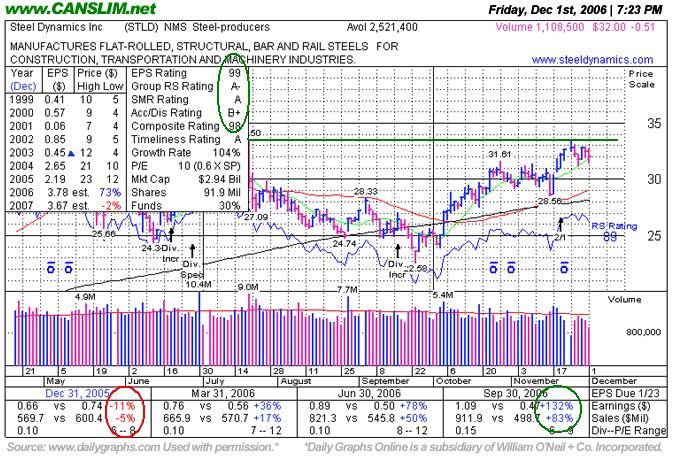
What to Look For and What to Look Out For: STLD after recently broke above the right side of its handle, however it failed to do so with gains backed by the necessary volume to trigger a convincing technical buy signal. Confirming follow-through gains help make a stronger case for buying this high-ranked leader. Look for volume to swell (at least +50% above average) as this stock makes additional progress over earlier chart highs in the $32-33 range. It is essential to see volume swell meaningfully as this issue continues advancing. Note that price progress without high volume is suspect because it fails to fulfill the "I" criteria. It is also important to avoid chasing it above its $33.30 maximum buy price. Deterioration in price back under its recent high close of significance chart-wise ($30.80 on October 26th) would prompt concern because it would fully negate the recent light-volume breakout. Falling below the 50 DMA line (now $29.04) or the recent chart low ($28.56) would be technical sell signals, especially prompting concern if the trading volume increases to above average levels behind the damaging losses.
Technical Analysis: STLD is currently sitting just above its $31.71 pivot point after spending the past 7 months trading between a $22-35 trading range. It needed time to consolidate after a considerable advance ($13.31 in Oct ’05-to-$34.97 in May ‘06). Now it is nearly free of chart resistance due to overhead supply, and in position to potentially begin another leg up.


