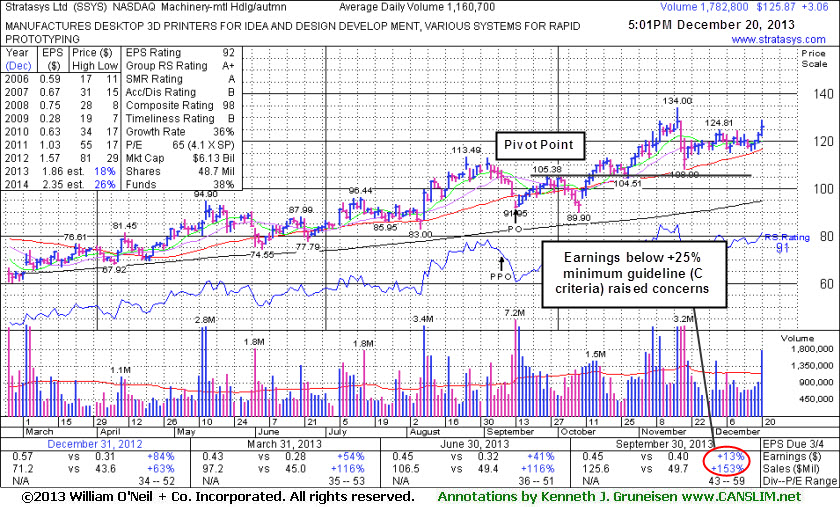
Rallying From Support at 50-Day Moving Average Line - Friday, December 20, 2013
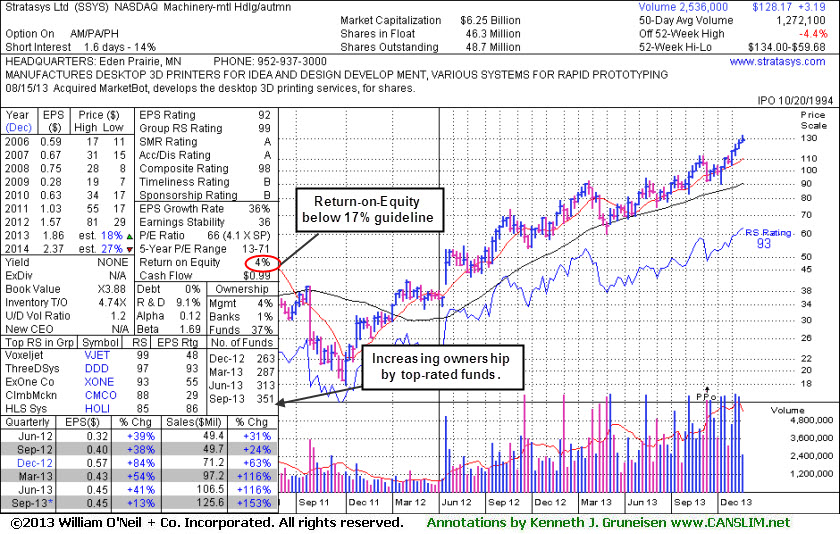
Stratasys Inc (SSYS +$3.06 or +2.49% to $125.87) posted a solid gain with above average volume. It recently has been consolidating above support at its 50-day moving average (DMA) line. More damaging losses would raise greater concerns and trigger worrisome technical sell signals. It remains noted with caution - "Reported earnings +13% on +153% sales revenues, below the +25% minimum earnings guideline (C criteria) raising fundamental concerns." While the fact-based system suggests that any new buying efforts in stocks should be based upon a combination of both fundamental and technical characteristics, sell decisions should be based upon only technical action and not due only to a fundamental disappointment which develops. Therefore, patient investors may give it an opportunity to possibly produce more climactic gains while being watching for technical sell signals.
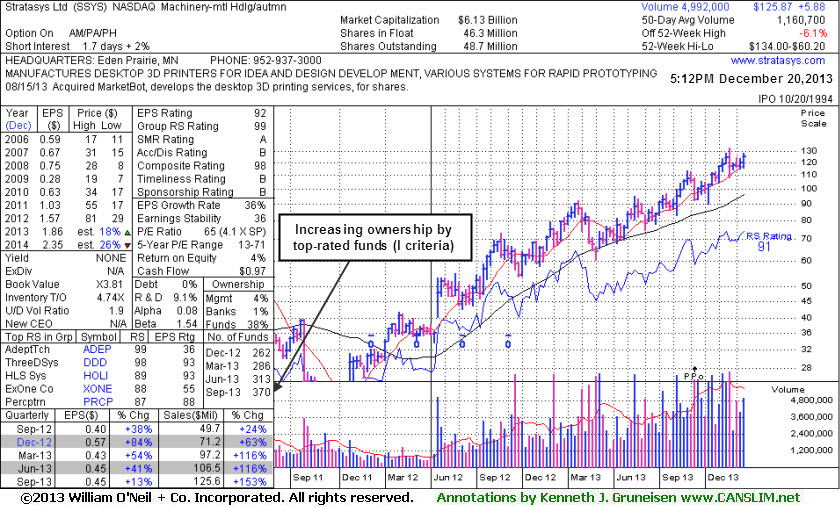
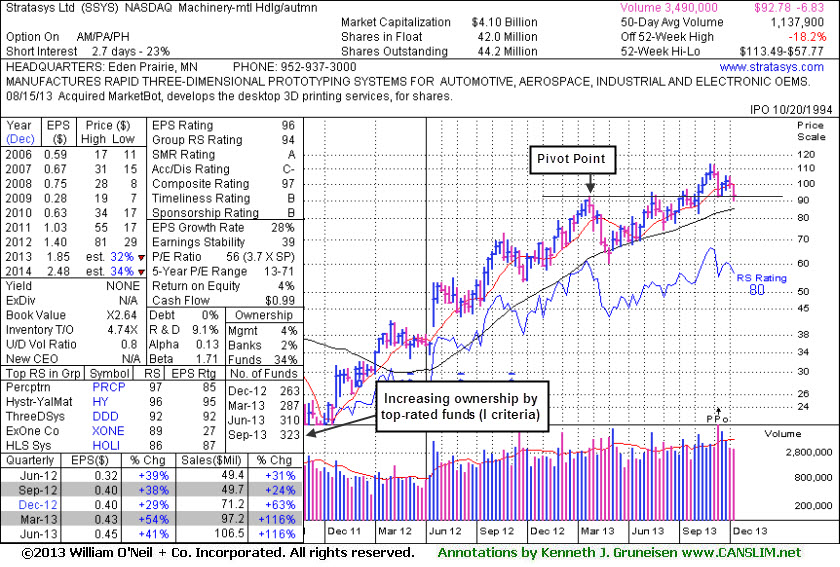
SSYS was last shown in this FSU section on 11/18/13 with annotated daily and weekly graphs under the headline, "Rallying For New Highs Despite Fundamental Flaw Raising Concern", getting extended from a sound base. It completed a new Public Offering on 9/13/13. When it proposed a new Public Offering on 9/09/13 while perched near all-time highs it was noted - "Such offerings can often be a short-term hindrance to upward price progress, however underwriters often help companies attract greater institutional ownership interest in the process." Ownership by top-rated funds rose from 246 in Sep '12 to 351 in Sep '13, a reassuring sign concerning the I criteria (see annotated weekly graph below). However, its Return-on-Equity is now at 4%, below the 17% minimum guideline.
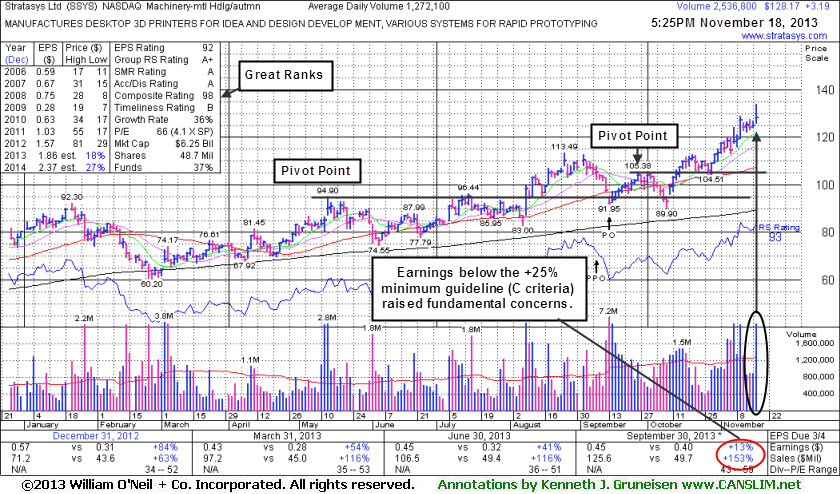
Rallying For New Highs Despite Fundamental Flaw Raising Concern - Monday, November 18, 2013
Stratasys Inc (SSYS +$3.19 or +2.55% to $128.17) hit a new 52-week high with today's volume-driven gain, getting more extended from a sound base. Recently the company reported earnings +13% on +153% sales revenues, below the +25% minimum earnings guideline (C criteria) raising fundamental concerns. While the fact-based system suggests that any new buying efforts in stocks should be based upon a combination of both fundamental and technical characteristics, sell decisions should be based upon only technical action and not due only to a fundamental disappointment which develops. Therefore, patient investors may give it an opportunity to possibly produce more climactic gains while being watching for technical sell signals.SSYS was last shown in this FSU section on 10/09/13 with an annotated graph under the headline, "Faltering and Relative Strength Waning After Offering". It completed a new Public Offering on 9/13/13. When it proposed a new Public Offering on 9/09/13 while perched near all-time highs it was noted - "Such offerings can often be a short-term hindrance to upward price progress, however underwriters often help companies attract greater institutional ownership interest in the process." Ownership by top-rated funds rose from 246 in Sep '12 to 351 in Sep '13, a reassuring sign concerning the I criteria (see annotated weekly graph below). However, its Return-on-Equity is now at 4%, below the 17% minimum guideline.
Faltering and Relative Strength Waning After Offering - Wednesday, October 09, 2013
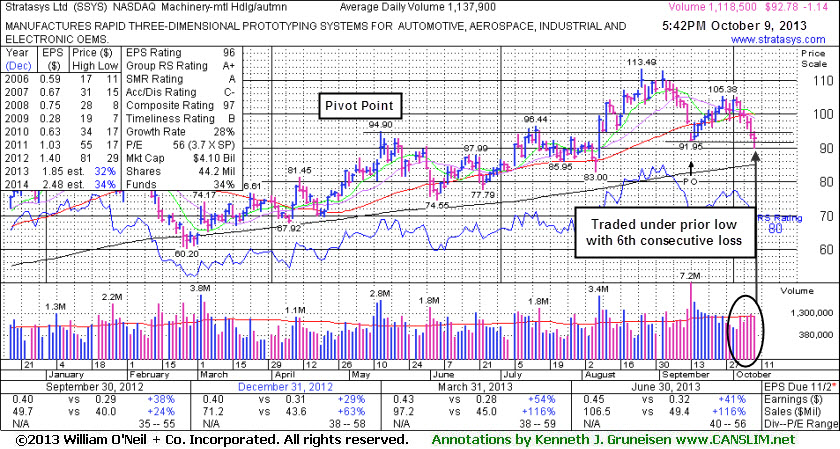
Stratasys Inc (SSYS -$1.14 or -1.21% to $92.78) slumped further below its 50-day moving average (DMA) line with today's 6th consecutive loss and undercut prior lows defining the next near-term support. A rebound above its 50 DMA line is needed for its technical stance and outlook to improve. Its Relative Strength Rating has slumped to 80, right at the minimum guideline for buy candidates under the fact-based investment system. The market (M criteria) has also deteriorated back into a "correction" as noted in the Market Commentary due to damaging losses early this week. Disciplined investors always limit losses by selling any stock that falls more than -7% from their purchase price.
It completed a new Public Offering on 9/13/13. SSYS was last shown in this FSU section on 9/10/13 with an annotated graph under the headline, "Consolidating Following New Proposed Public Offering". When it proposed a new Public Offering on 9/09/13 while perched near all-time highs it was noted - "Such offerings can often be a short-term hindrance to upward price progress, however underwriters often help companies attract greater institutional ownership interest in the process." Ownership by top-rated funds rose from 246 in Sep '12 to 323 in Jun '13, a reassuring sign concerning the I criteria (see annotated weekly graph below).
The company released financial results for the quarter ended June 30, 2013 showing earnings +41% on +116% sales revenues versus the year ago period. Its strong quarterly earnings history above the +25% minimum guideline satisfies the C criteria. A downturn in its FY '09 earnings was previously noted as a flaw with respect to the investment system's A criteria. It found support near its 200 DMA line during a deep consolidation earlier this year.
Consolidating Following New Proposed Public Offering - Tuesday, September 10, 2013
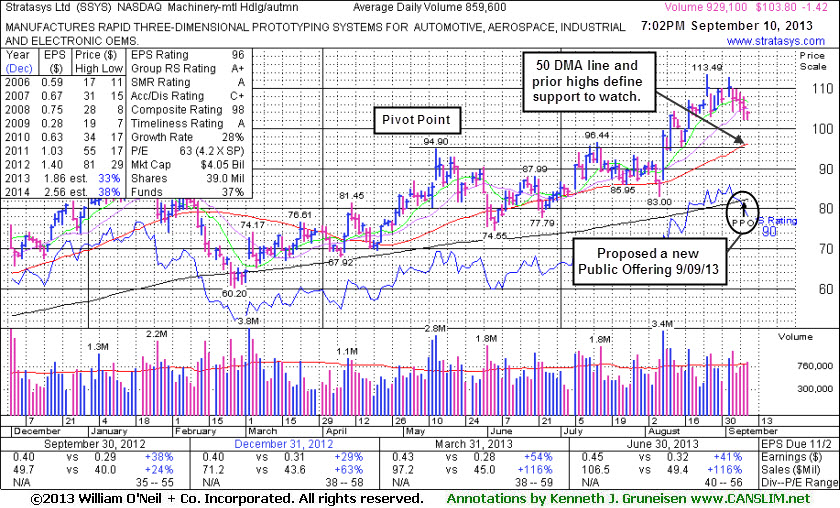
Stratasys Inc (SSYS -$1.42 or -1.35% to $103.80) is extended from a sound base, consolidating well above its 50-day moving average (DMA) line and well above prior highs in the $96 area defining important support. It proposed a new Public Offering on 9/09/13 while perched near all-time highs. Such offerings can often be a short-term hindrance to upward price progress, however underwriters often help companies attract greater institutional ownership interest in the process. Ownership by top-rated funds rose from 246 in Sep '12 to 308 in Jun '13, a reassuring sign concerning the I criteria.Its Relative Strength Rating has improved to 90, above the 80+ minimum guideline for buy candidates under the fact-based investment system, and up from 86 when last shown in this FSU section on 8/16/13 with an annotated graph under the headline, "Consolidating in Orderly Fashion but Market Shift Raises Caution Flag". The market (M criteria) has also shifted back to a "confirmed uptrend" as noted in the Market Commentary due to solid gains early this week.
The company released financial results for the quarter ended June 30, 2013 showing earnings +41% on +116% sales revenues versus the year ago period. Its strong quarterly earnings history above the +25% minimum guideline satisfies the C criteria. A downturn in its FY '09 earnings was previously noted as a flaw with respect to the investment system's A criteria. It found support near its 200 DMA line during a deep consolidation earlier this year.
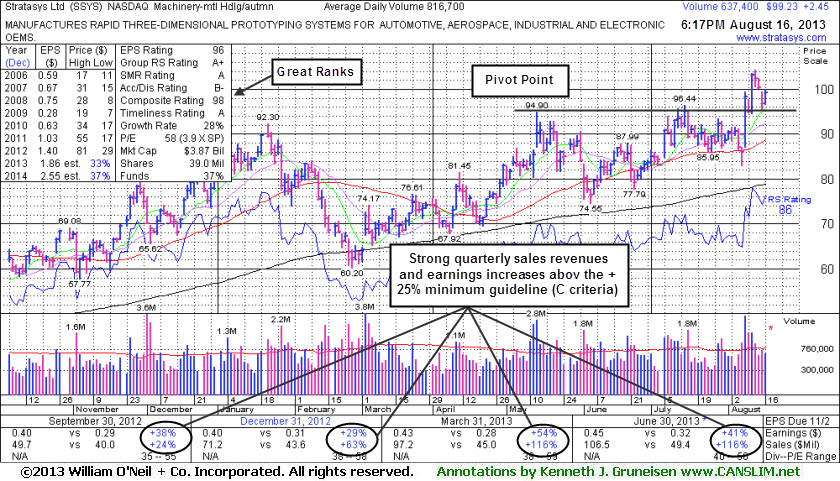
Consolidating in Orderly Fashion but Market Shift Raises Caution Flag - Friday, August 16, 2013
Stratasys Inc (SSYS +$2.45 or +2.53% to $99.23) is consolidating above prior highs in the $96 area defining initial support following the latest breakout. It has pulled back just below the "max buy" level and its color code was changed to yellow. Keep in mind that a volume-driven breakout is a critical sign of the heavy institutional buying demand which can lead to a sustained and meaningful advance in price, but it is not a guarantee the stock will produce great price gains. The market (M criteria) signaled that it is in another correction, so the message now is that it is an important time to adopt a defensive stance. It is not a time to be thinking seriously about accumulating stocks. If the market confirms a new rally then SSYS, along with many other strong leaders, might be worthy of more serious consideration.
Its Relative Strength Rating has improved to 86, above the 80+ minimum guideline for buy candidates under the fact-based investment system. It was last shown in this FSU section on 7/24/13 with an annotated graph under the headline, "Faltering Near 50-day Moving Average While Relative Strength Wanes".
The company released financial results for the quarter ended June 30, 2013 showing earnings +41% on +116% sales revenues versus the year ago period. Its strong quarterly earnings history above the +25% minimum guideline satisfies the C criteria. A downturn in its FY '09 earnings was previously noted as a flaw with respect to the investment system's A criteria. It found support near its 200 DMA line during a deep consolidation earlier this year. Ownership by top-rated funds rose from 246 in Sep '12 to 304 in Jun '13, a reassuring sign concerning the I criteria. It is an interesting turn around story with a small supply of 37.1 million shares (S criteria) outstanding. Longtime members may recall that SSYS was long ago (2003) featured in reports.
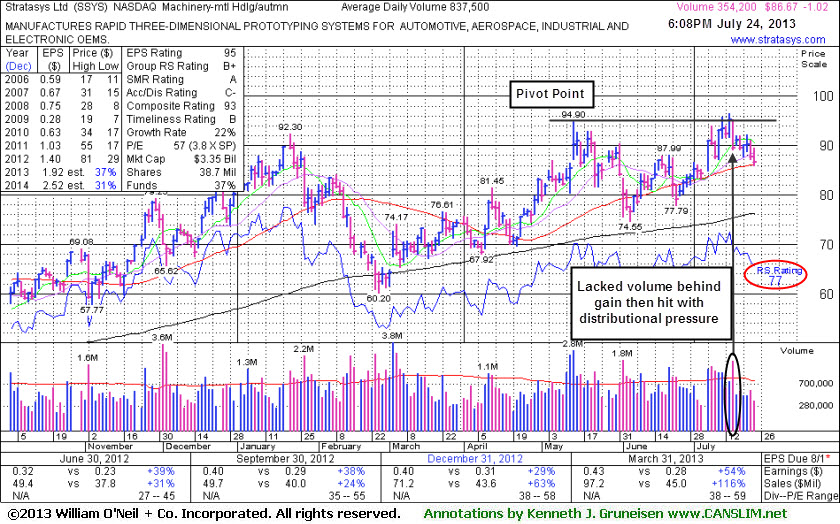
Faltering Near 50-day Moving Average While Relative Strength Wanes - Wednesday, July 24, 2013
Stratasys Inc (SSYS -$1.02 or -1.16% to $86.67) finished the session -10.1% off its 52-week high as it slumped near its 50-day moving average (DMA) line with a loss on light volume. That is an important support level recognized by chart readers. More damaging losses would raise concerns and trigger technical sell signals. It failed to make headway above the previously stubborn resistance in the $94 area since last shown in this FSU section on 7/08/13 with an annotated graph under the headline, "Finished Lower Following 'Negative Reversal' After Challenging High". Members were cautioned - "After challenging its prior high it ended near the session low with a loss on higher volume - action which is technically termed a "negative reversal". When poised for a best-ever close, and while the broader market showed mostly positive action, the weak finish was a clear sign that it was encountering distributional pressure. Disciplined investors will watch for a proper technical breakout and more reassuring from the broader market (M criteria) before considering new buying efforts."
In the interim, more encouraging positive action in the major averages (M criteria) has helped reassure investors that odds are favorable for new buying efforts. However, the stock's Relative Strength Rating has slumped to 77, below the 80+ minimum guideline for buy candidates under the fact-based investment system.
Its strong quarterly earnings history above the +25% minimum guideline satisfies the C criteria. Reported earnings +54% on +116% sales revenues for the Mar '13 quarter versus the year ago period. The company will release financial results for the quarter ended June 30, 2013 before the market open on Thursday, August 8, 2013. Price volume action leading into the next earnings release may likely give investors a hint as to its earnings outlook, and certainly its reaction to earnings news will be closely watched. Volume and volatility often increase near earnings news.
SSYS was highlighted in yellow in the 7/08/13 mid-day report with a pivot point cited based on its 5/14/13 high plus 10 cents (read here). Volume-driven gains had it rallying toward multi-month resistance in the $92-94 area with little resistance due to overhead supply. Following its negative reversal on 7/08/13 it surged higher with heavier volume while challenging its pivot point. Its best close was on 7/15/13, and although it ended that session above its pivot point the volume on that session was below average and not sufficient to trigger a proper technical buy signal. Keep in mind that a volume-driven breakout is a critical sign of the heavy institutional buying demand which can lead to a sustained and meaningful advance in price. It didn't flash that sign of buying demand, but it was then smacked again for a loss with heavy volume on 7/16/13, and its subsequent gains lacked volume conviction.
A downturn in its FY '09 earnings was previously noted as a flaw with respect to the investment system's A criteria. It found support near its 200 DMA line during a deep consolidation earlier this year. Ownership by top-rated funds rose from 246 in Sep '12 to 286 in Jun '13, a reassuring sign concerning the I criteria. It is an interesting turn around story with a small supply of 36.7 million shares (S criteria) outstanding. Longtime members may recall that SSYS was long ago (2003) featured in reports.
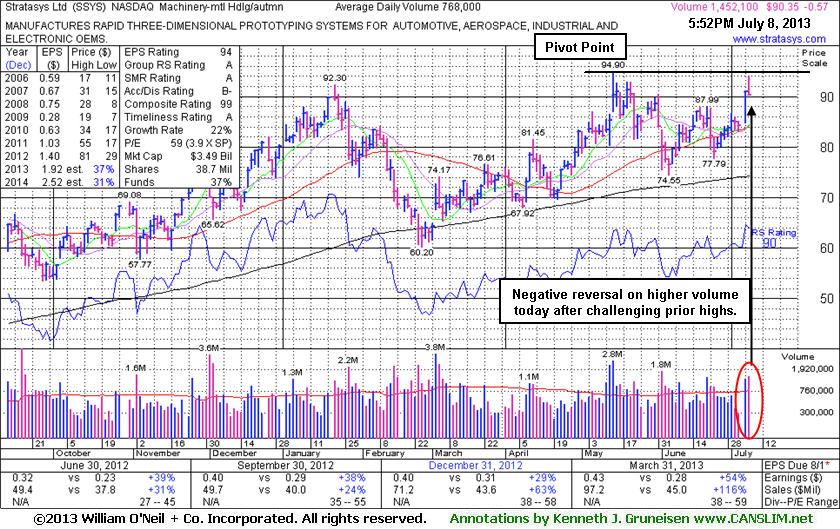
Finished Lower Following "Negative Reversal" After Challenging High - Monday, July 08, 2013
Stratasys Inc (SSYS -$0.57 or -0.63% to $90.35) was highlighted in yellow with a pivot point cited based on its 5/14/13 high plus 10 cents in the earlier mid-day report (read here). Volume-driven gains had it rallying toward multi-month resistance in the $92-94 area, and little resistance remains due to overhead supply. However, after challenging its prior high it ended near the session low with a loss on higher volume - action which is technically termed a "negative reversal". When poised for a best-ever close, and while the broader market showed mostly positive action, the weak finish was a clear sign that it was encountering distributional pressure. Disciplined investors will watch for a proper technical breakout and more reassuring from the broader market (M criteria) before considering new buying efforts.
Its strong quarterly earnings history above the +25% minimum guideline satisfies the C criteria. The 7/05/13 mid-day report noted - "Reported earnings +54% on +116% sales revenues for the Mar '13 quarter versus the year ago period. Downward turn in its FY '09 earnings was previously noted as a flaw with respect to the investment system's A criteria. Found support near its 200 DMA line during a deep consolidation earlier this year. Ownership by top-rated funds rose from 246 in Sep '12 to 277 in Jun '13, a reassuring sign concerning the I criteria. It is an interesting turn around story with a small supply of 36.7 million shares (S criteria) outstanding. Longtime members may recall that SSYS was long ago (2003) featured in reports."