Chip Stock Hits Fresh High as Semiconductor Group Charges - Thursday, June 21, 2007
Volume is a vital component of technical analysis. Prudent investors that incorporate volume into their stock analysis have often benefited several fold. Ideally, healthy stocks will more often tend to rise on higher volume and pullback on lighter volume. Volume is a great proxy for institutional sponsorship. Conversely, high volume declines can be an ominous, as this usually signals distribution and further price deterioration are more likely to follow.
Siliconware Precision Industries Co. Ltd. (SPIL +$0.59 or +5.40% to $11.52) jumped to a fresh all-time high on Thursday, however the volume total failed to meet the required level to trigger a proper new technical buy signal. It is important to remember that volume is a critical component of institutional demand (the "I" criteria) and it has yet to meet the required +50% above average level behind gains that is necessary to trigger a proper technical buy signal. The reason why volume is so important is because there is a strong correlation between the amount of volume and a stock's ability to make meaningful price progress. History shows us that one of the overlapping themes behind the market's greatest winners has been strong volume behind their breakouts. That is why one should be cautious when a stock breaks out on questionable volume. SPIL has an 87 Earnings Per Share rating. It spent the past few months basing, resulting in a new pivot point of $11.48 and new "maximum buy" price of $12.05. Just because SPIL did not trigger a new technical buy signal today does not mean the stock should be dropped from an active watch list. Now that SPIL has cleared all overhead supply, all that is needed to trigger a vaild technical buy signal is to see volume meet the required level behind more gains before SPIL gets too extended from the ideal buy point.
SPIL enjoyed decent gains since it was first featured in the January '07 issue of CANSLIM.net News (read here) with a $8.11 pivot point and a $8.52 maximum buy price. A few weeks later, on January 23, 2007, it broke out of its base triggering a technical buy signal. It spent the next few weeks advancing, and it was very encouraging to see it stay trading near its highs even while the major averages corrected at the end of February and in early-March. This stock's progress was highlighted in more detail under the headline "Avoid "Chasing Stocks Past Pivot By 5%" in the April 11, 2007 CANSLIM.net After Market Report, wherein our experts also emphasized several reasons for investors to be cautious (read here). Subsequent notes prompted more caution by observing that the company's latest quarterly financial report showed sales and earnings growth below the +25% guideline. Once again, at this point it is imperative to wait for a new technical buy signal to be triggered before initiating a position.
As always, it is of the utmost importance to sell a stock if it drops 7-8% below your purchase price. C A N S L I M | StockTalk | News | Chart | ![]() DGO | SEC | Zacks Reports
DGO | SEC | Zacks Reports
View all notes | Alert me of new notes | CANSLIM.net Company Profile
Close Under 50 DMA on High Volume Puts Support at Trendline to Test - Monday, May 14, 2007
 A very important technical tool that savvy investors have learned to incorporate in their technical analysis is the 50-day moving average (DMA) line. The 50 DMA line plays a pivotal role relative to a stock's price. If the price of a stock is above its 50 DMA then odds are that its 50 DMA will act as formidable support. Conversely, if the price is below its 50 DMA then the moving average acts as resistance. Healthy stocks sometimes trade under their 50 DMA lines briefly, but usually a strong candidate will promptly bounce and repair a 50 DMA violation. When a stock has violated its 50 DMA line and then lingers beneath it, the stock's outlook gets worse and worse as it spends a greater period of time trading under that important short-term average line. Once the 50 DMA line starts sloping downward it should also be acknowledged that the stock has been struggling for a while, and it might be time to reduce exposure and look for places to put that money to work in stronger buy candidates.
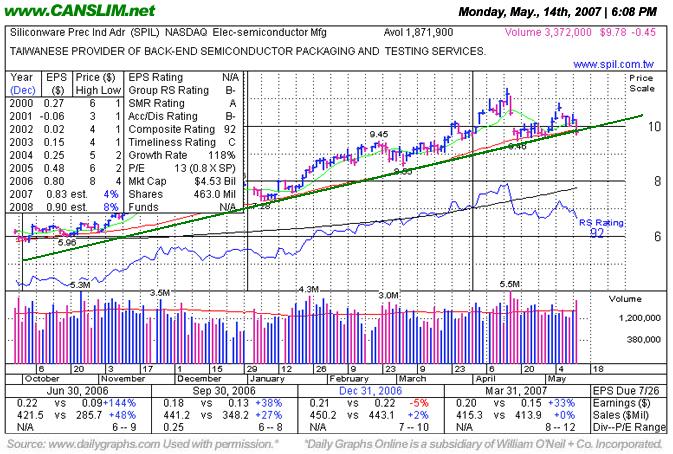
Siliconware Precision Industries Co. Ltd. (SPIL -$0.45 or -4.40% to $9.78) suffered a considerable loss today on above average volume and sliced below its 50-day moving average line ($9.87). The stock closed on the lower boundary of its multi-month upward trendline which, along with the recent chart lows near $9.50 in the last couple of weeks, may be considered a key chart support level at this juncture. It is important to remember that healthy stocks tend to find support above their 50 DMA lines or upward trendlines several times during a meaningful rally, but they do not slice through them. When these important areas of support are breached, technical sell signals are triggered, and lower prices become more likely to follow. Any violations should be promptly repaired, and they should not be ignored.
SPIL enjoyed decent gains since it was first featured in the first featured in the January '07 issue of CANSLIM.net News (read here) with a $8.11 pivot point and a $8.52 maximum buy price. A few weeks later, on January 23, 2007, it broke out of its base triggering a technical buy signal. It spent the next few weeks advancing, and it was very encouraging to see it stay trading near its highs even while the major averages corrected at the end of February and in early-March. This stock's progress was highlighted in more detail under the headline "Avoid "Chasing Stocks Past Pivot By 5%" in the April 11, 2007 CANSLIM.net After Market Report, wherein our experts also emphasized several reasons for investors to be cautious (read here). Subsequent notes prompted more caution by observing that the company's latest quarterly financial report showed sales and earnings growth below the +25% guideline.
C A N S L I M | StockTalk | News | Chart | ![]() DGO | SEC | Zacks Reports
DGO | SEC | Zacks Reports

View all notes | Alert me of new notes | CANSLIM.net Company Profile
Avoid "Chasing" Stocks Past Pivot By +5% - Wednesday, April 11, 2007
A classic example of the success enjoyed by many CANSLIM.net readers usually starts when an investor reads a CANSLIM.net report and buys a featured stock before it has risen above the pivot point by greater than 5%. After a stock breaks out above its pivot point, there is only a +5% window that investors have to purchase the stock under the proper guidelines. Once a stock rises above the "maximum buy price" the risk of a shake out balloons, meaning that even a normal retracement in the stock might force you to employ the 7-8% loss cutting rule. Much can be told by the stock's daily action in the weeks and months that follow a breakout. Typically, a light volume and orderly pullback suggests that the bulls remain in control. However, high volume pullbacks that violate support paint a totally different picture.
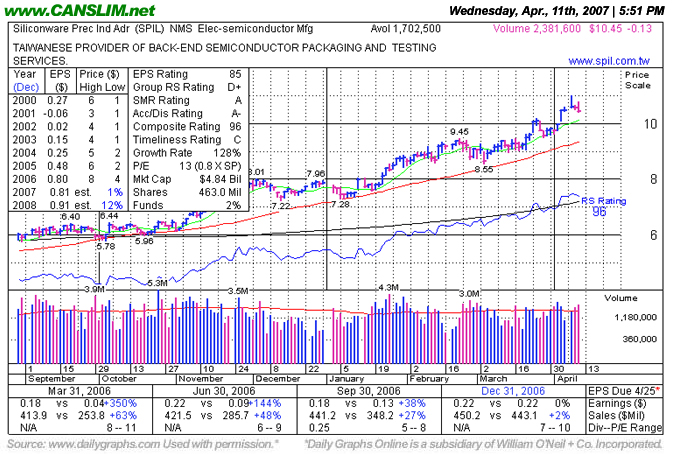
Siliconware Precision Industries Co. Ltd. (SPIL -0.13 or -1.23% to $10.45) jumped to another new high close on Wednesday. This stock was first featured in the January '07 issue of CANSLIM.net News (read here) with a $8.11 pivot point and a $8.52 maximum buy price. A few weeks later, on January 23, 2007, this issue broke out of its base triggering a technical buy signal and spent the next few weeks advancing. It was very encouraging to see this issue trade new its highs while the major averages corrected. That action was highlighted in the March 8, 2007 CANSLIM.net After Market Report under the headline reading "Isolating Strength in a Weak Market" (read here). On March 21, 2007, the same day the current rally attempt followed-through, SPIL vaulted into new high territory and has not looked back since.
Once a stock is owned, the decision to sell should be based on its technical (price/volume) action. As long as this issue continues rallying on above average volume and does not violate important chart support levels, it deserves the bullish benefit of the doubt. It is also very important to be disciplined and ONLY buy stocks within the guidelines. SPIL is clearly too extended from a sound price base to be considered buyable at this point. Buying above a stock's pivot point by more than +5%, the "maximum buy" price, increases the odds that you will get prematurely stopped out. Instead of buying above a stock's maximum buy price it is best to be disciplined and wait for a new base and pivot point to develop before a position is taken. As always, a stock should be sold if it drops 7-8% below your purchase price.
C A N S L I M | StockTalk | News | Chart | ![]() DGO | SEC | Zacks Reports
DGO | SEC | Zacks Reports
View all notes | Alert me of new notes | CANSLIM.net Company Profile
Isolating Strength in a Weak Market - Thursday, March 08, 2007
Often, when a leading stock is setting up to breakout of a solid base it is highlighted in CANSLIM.net's Mid-Day Breakouts Report. The most relevant factors are noted in the report which allows prudent CANSLIM oriented investors to place the issue in their watch list. After doing any necessary backup research, the investor is prepared to act if and when the stock triggers a technical buy signal (breaks above its pivot point on more than +50% average turnover). In the event the stock fails to trigger a technical buy signal and its price declines then it will simply be removed from the watch list.
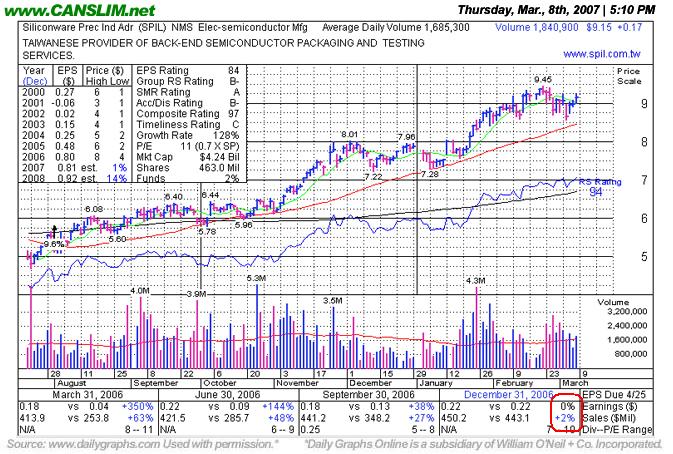
Siliconware Precision Industries Co. Ltd. (SPIL +$0.17 or +1.82% to $9.15) closed -3.2% below its 52-week high and is stubbornly holding on to its recent gains. This stock was first featured on Wednesday, January 28, 2004 with a $8.11 pivot point. SPIL jumped an impressive +16% within four weeks. Last week, when the major averages got smacked, SPIL pulled back and found support above its 50 DMA line, which is perfectly healthy. The stock has edged higher over the past few days and is a great example of how a stock should perform when the major averages pullback. The stock also found support at the lower boundary of its multi-month upward trendline. Concerns are raised by its latest quarterly financials, which showed lackluster sales revenue growth and flat earnings (see red circle). It still maintains good ranks, but may be considered a questionable buy candidate now, due to the below guidelines fundamentals in the last quarter (the "C" criteria). However, as long as this stock continues trading above its 50-day moving average (DMA) line, and above its upward trendline (not drawn), the bulls remain in control. Keeping track of strong stocks during market corrections is a great way to be ready to act when a proper follow-through day emerges.
C A N S L I M | StockTalk | News | Chart | ![]() DGO | SEC | Zacks Reports
DGO | SEC | Zacks Reports
View all notes | Alert me of new notes | CANSLIM.net Company Profile
Stock Rallies Even Though Fundamentals Dried Up - Wednesday, February 14, 2007
A classic example of the success enjoyed by many CANSLIM.net readers usually starts when an investor reads a CANSLIM.net report and buys a featured stock before it has risen above the pivot point by greater than 5%. After a stock breaks out above its pivot point, there is only a +5% window that investors have to purchase the stock under the proper guidelines. Once a stock rises above the "maximum buy price" the risk of a shake out balloons, meaning that even a normal retracement in the stock might force you to employ the 7-8% loss cutting rule. Much can be told by the stock's daily action in the weeks and months that follow a breakout. Typically, a light volume and orderly pullback suggests that the bulls remain in control. However, high volume pullbacks that violate support paint a totally different picture.
Siliconware Precision Industries Co. Ltd. (SPIL $0.49 or +5.52% to $9.18) jumped to a fresh all-time high with a considerable gain on about average volume. This stock was first featured in the January 2007 issue of CANSLIM.net News (read here) as it was approaching its $8.11 pivot point. A few weeks later, it appeared in the Friday, January 19, 2007 CANSLIM.net Mid Day Breakouts Report (read here) with a $8.11 and a $8.52 maximum buy price. On January 23, 2007, this issue broke out of its base and it has not looked back since.
Siliconware Precision still sports a healthy Earnings Per Share (EPS) rating of 84. It is also encouraging to see the company earn a Relative Strength (RS) rating of 89, which will likely change for the better after an impressive move to the upside. However, SPIL failed to increase its earnings by the +25% guideline in its most recent quarterly financial report versus the year earlier period. Even though its fundamentals have recently raised concerns, the technical action in the stock has remained strong. Once a stock is owned, the decision to sell should be based on its technical (price/volume) action. As long as this issue continues rallying on above average volume and does not violate important chart support levels, it still deserves the bullish benefit of the doubt. It is also very important to be disciplined and ONLY buy stocks within the guidelines. Now, along with the concerns about its fundamentals, SPIL is also too extended from a sound price base. Buying above a stock's pivot point by more than +5%, the "maximum buy" price, increases the odds that you will get prematurely stopped out. As always, a stock should be sold if it drops 7-8% below your purchase price.
C A N S L I M | StockTalk | News | Chart | ![]() DGO | SEC | Zacks Reports
DGO | SEC | Zacks Reports
View all notes | Alert me of new notes | CANSLIM.net Company Profile
SPIL - Leader Basing Above 50 DMA Line - Tuesday, January 02, 2007
|
Siliconware Prec Ind (SPIL) |
||
|
Ticker Symbol: SPIL (NASDAQ) |
Industry Group: Semiconductor Equipment & Materials |
Shares Outstanding: 463,000,000 |
|
Price: $7.86 |
Day's Volume: 613,500 12/29/2006 |
Shares in Float: 458,400,000 |
|
52 Week High: $8.01 12/04//2006 |
50-Day Average Volume: 1,764,600 |
Up/Down Volume Ratio: 2.1 |
|
Pivot Point: $8.11 12/04/06 high plus .10 |
Pivot Point +5% = Max Buy Price: $8.52 |
Web Address: http://www.spil.com.tw |
C A N S L I M | StockTalk | News | Chart | SEC | Zacks Reports

View all notes | Alert me of new notes | CANSLIM.net Company Profile
CANSLIM.net Profile: Siliconware Precision Industries Co., Ltd. provides semiconductor packaging and testing services. It offers a range of standard and customized packaging and testing solutions, including advanced lead-frame packages and substrate packages, such as the flip-chip ball grid array; and testing services for logic, mixed signal, and embedded memory devices. The company also offers turnkey solutions from packaging and testing to direct shipment of semiconductor devices to end users. The company serves communications, computing, consumer, automotive, and industrial end markets primarily in the
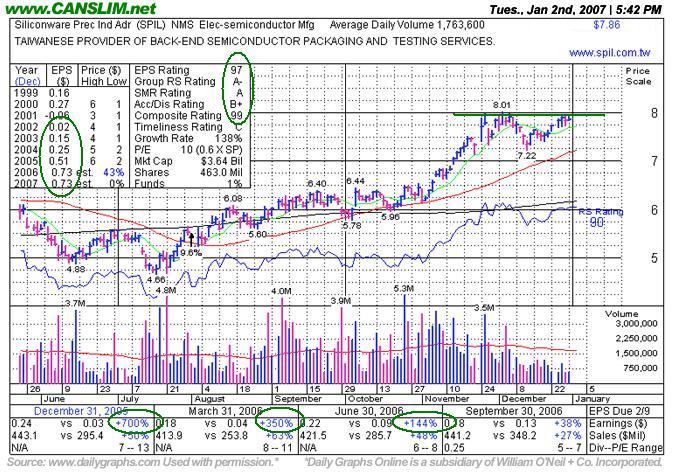
What to Look For and What to Look Out For: Look for SPIL to continue consolidating above its 50 day moving average (DMA) line and eventually breakout out to new highs. It is encouraging to see volume recede as it has while SPIL has spent the past five weeks trading just shy of the $8 level. It would be a technical buy signal to see this issue blast into new high territory on high volume at least +50% above average. Conversely, investors should wait on the sidelines if SPIL fails to trade above its $8.11 pivot point on the necessary volume to trigger a technical buy signal. Any break down below its 50 DMA line would likely lead to even further downside. Always limit losses per the 7-8% sell rule, and never hold a stock if it falls more than that much from your purchase price.
Technical Analysis: Six weeks ago, SPIL ralllied into new all-time high territory with persistent gains on heavier than average volume. After a very healthy advance, it has spent the past 5 weeks consolidating. It is very healthy to see volume dry up, which suggests that there are not a lot of sellers ready to rush to the exits - even while the stock is lingering near its highs. As long as this issue continues trading above its 50 DMA the bulls remain in control. It is imperative to wait for a technical buy signal to be triggered before initiating any new positions. It faces minimal resistance due to overhead supply, but until this issue trades above its pivot point its chances for much greater success are limited.


