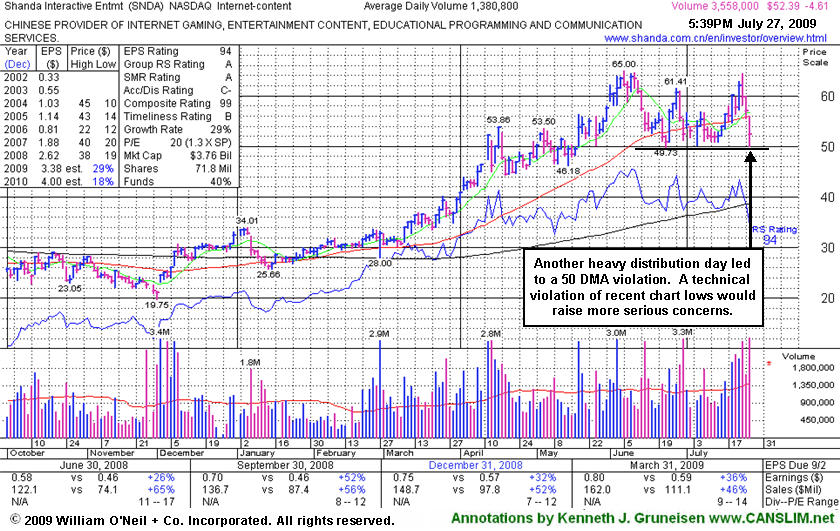
Shanda Interactive Ent Ltd (SNDA -$4.61 or -8.09% to $52.39) gapped down today and violated its 50-day moving average (DMA) line, another clear distribution day that hurts its outlook. When it was recently approaching its all-time highs, a new pivot point was noted and its color code was changed to yellow in the 7/22/09 Mid-Day Breakouts Report (read here). However, that has been followed by three damaging losses in a row. Technically, deterioration under its June low ($49.73) raise more serious concerns and trigger additional sell signals, especially if volume swells behind more damaging losses. Losses on heavy volume in recent weeks were noted as they signaled distributional pressure. For its outlook to improve it needs gains to lift it back above its short-term average. After featured in the June 2009 issue of CANSLIM.net News (read here), SNDA quickly got too extended from a proper buy point. Its outlook now grows increasingly questionable the longer and deeper it slumps into its prior base below it previous chart highs in the $53 area.
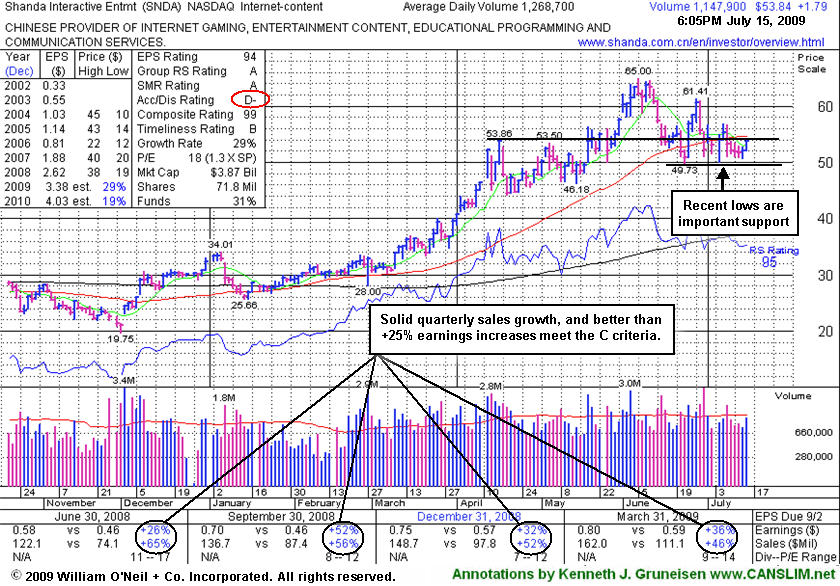
Shanda Interactive Ent Ltd (SNDA +$1.79 or +3.44% to $53.84) posted a gain on average volume today but it remains under its 50-day moving average (DMA) line. Concerns increase the longer it trades below that short-term average, meanwhile, convincing gains back above its 50 DMA line would be a nice reassurance that it was attracting institutional support. Subsequent deterioration below its recent chart low near $50 could raise more serious concerns and trigger a more worrisome technical sell signal, especially if volume swells behind more damaging losses. Losses on heavy volume in recent weeks were noted as they signaled distributional pressure leading to violations of it upward trendline and 50 DMA line. Its Accumulation/Distribution rank also reflects the recent action, having fallen from a respectable B on June 3rd, to a rather dismal D- today!
A closer look at its chart identified a worrisome "island reversal" pattern in the annotated graph included with and earlier appearance in this FSU section on June 25th, and any members who may not have noted that ominous pattern before should take time now to review that earlier report (read here). After featured in the June 2009 issue of CANSLIM.net News (read here), SNDA quickly got too extended from a proper buy point. Its outlook now grows increasingly questionable the longer and deeper it slumps into its prior base below it previous chart highs in the $53 area. More time is needed for it to form a new sound base such as "double bottom" in the coming weeks.
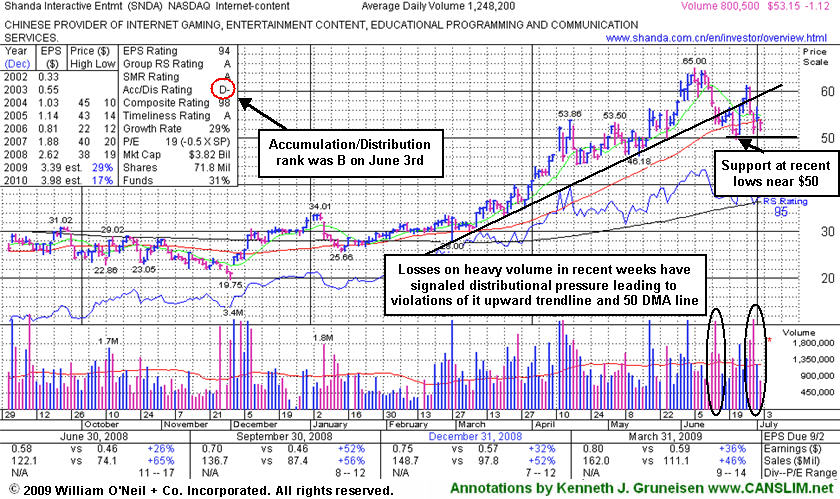
Shanda Interactive Ent Ltd (SNDA -$1.12 or -2.06% to $53.15) gapped down today for a loss on light volume, sinking below its 50-day moving average (DMA) line again. Deterioration below its recent chart low near $50 would raise more serious concerns and trigger a worrisome technical sell signal, especially if volume swells behind more damaging losses. Losses on heavy volume in recent weeks were noted as they signaled distributional pressure leading to violations of it upward trendline and 50 DMA line. Its Accumulation/Distribution rank also reflects the recent action, having fallen from a respectable B on June 3rd, to a rather dismal D- today!
A closer look at its chart identified a worrisome "island reversal" pattern in the annotated graph included with the stock's last appearance in this FSU section on June 25th, and any members who may not have noted that ominous pattern before should take time now to review that earlier report (read here). After featured in the June 2009 issue of CANSLIM.net News (read here), SNDA quickly got too extended from a proper buy point. Its outlook now grows increasingly questionable the longer and deeper it slumps into its prior base below it previous chart highs in the $53 area. More time is needed for it to form a new sound base such as "double bottom" in the coming weeks.
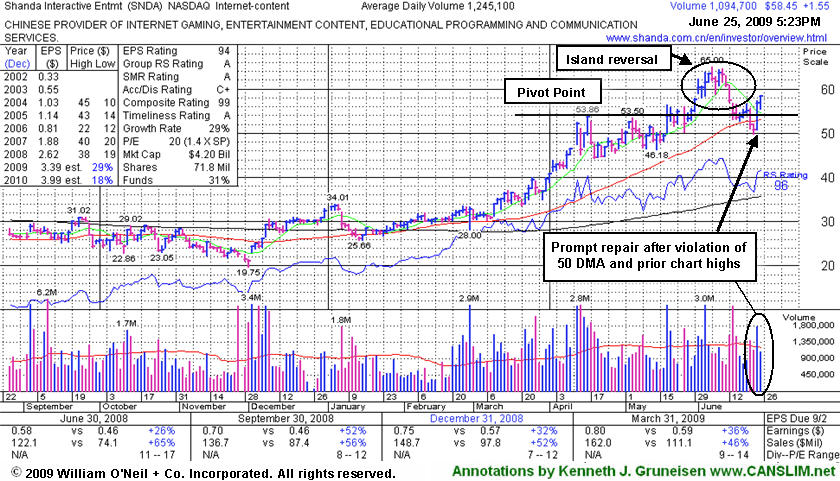
Shanda Interactive Ent Ltd's (SNDA $+1.55 or +2.72% to $58.45) color code was changed to yellow based on its resilience after recently noted distributional pressure. It posted a gain today on lighter volume after a considerable gain on higher volume helped promptly repair this week's violation of its 50-day moving average (DMA) line and prior chart highs -weakness which had raised concerns and triggered a technical sell signal. However, any subsequent deterioration under its short-term average and back into the prior base could be a more ominous sign, especially if volume swells and its latest low near $50 is violated. A closer look at its chart below identifies a worrisome "island reversal" pattern. In this case, its 6/01/09 gap up gain on heavy volume, followed by its 6/15/09 gap down and loss on heavy volume, completed a bearish island reversal. This week's gains have served to fill its latest gap and help it avoid slumping badly into its prior base, which is a somewhat encouraging sign of support.
Just after featured in the June 2009 issue of CANSLIM.net News, SNDA quickly got too extended from a proper buy point. In the stock's Featured Stock Update section appearance on June 3rd it was noted that, "Patient investors may watch for a pullback near its 50-day moving average (DMA) line, an important support level which has not been tested since breaking out above resistance at $34.00 back in March." Investors who may be considering SNDA trades now should be sure to review the additional analysis that was included in the "What to Look Out For" section of the June 2009 issue of CANSLIM.net News - read here).
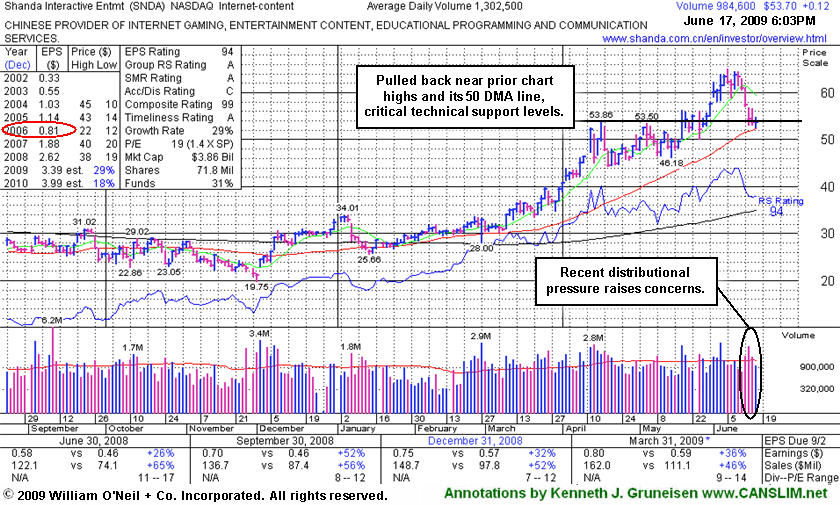
Shanda Interactive Ent Ltd (SNDA $+0.12 or +0.22% to $53.70) posted a tiny gain today on light volume. That followed 3 straight losses with above average volume, yet ended a 5-day losing streak near its latest pivot point. It is now testing prior chart highs and its 50-day moving average line which are very important support levels to watch. Violations could trigger worrisome technical sell signals, especially if volume spikes higher behind subsequent losses.
Just after featured in the June 2009 issue of CANSLIM.net News, it quickly got too extended from a proper buy point. In the stock's latest Featured Stock Update section appearance on June 3rd it was noted that, "Patient investors may watch for a pullback near its 50-day moving average (DMA) line, an important support level which has not been tested since breaking out above resistance at $34.00 back in March." Its color code has been changed to yellow now, however the recently noted distributional pressure (6/12 and 6/15) in this stock does not bode well, and distributional pressure recently evident in the broader market averages (the M criteria) has not been an encouraging sign. Investors who may be considering SNDA trades now should be sure to review the additional analysis that was included in the "What to Look Out For" section of the June 2009 issue of CANSLIM.net News - read here).
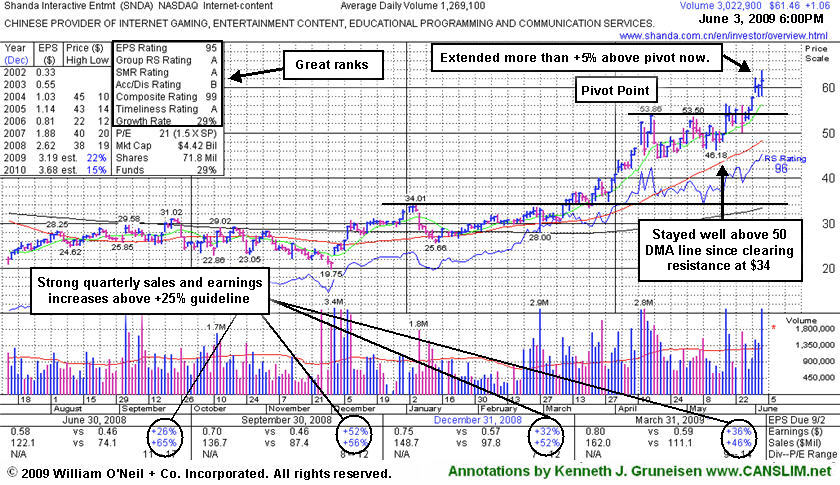
Shanda Interactive Ent Ltd (SNDA $+1.06 or +1.75% to $60.99) hit a new all-time high today and then closed in the middle of its intra-day trading range following the release of solid earnings and sales news for the latest quarter. It is extended from a sound base now. Disciplined investors avoid chasing any stock more than +5% above its pivot point. Patient investors may watch for a pullback near its 50-day moving average (DMA) line, an important support level which has not been tested since breaking out above resistance at $34.00 back in March. Just featured in the June 2009 issue of CANSLIM.net News. Be sure to review the "What to Look Out For" section and entire detailed summary - read here).
C A N S L I M | StockTalk | News | Chart | SEC | Zacks Reports | ![]()
![]()
![]()
View all notes | Alert me of new notes | CANSLIM.net Company Profile
|
Shanda Interactive Entertainment |
| |
|
Ticker Symbol: SNDA (NASDAQ) |
Industry Group: Internet- Content |
Shares Outstanding: 71,800,000 |
|
Price: $57.62 5/29/09 |
Day's Volume: 991,900 5/29/2009 |
Shares in Float: 23,000,000 |
|
52 Week High: $58.00 5/29/09 |
50-Day Average Volume: 1,249,600 |
Up/Down Volume Ratio: 1.5 |
|
Pivot Point: $53.95 4/16/09 high plus $0.10 |
Pivot Point +5% = Max Buy Price: $56.65 |
Web Address: http://www.snda.com/ |
C A N S L I M | StockTalk | News | Chart | SEC | Zacks Reports |

CANSLIM.net Profile: Shanda Interactive Entertainment Limited, an interactive entertainment media company, operates online games. It was founded in 1999 and is based in Shanghai, the People's Republic of China. It offers a portfolio of entertainment content, including massively multi-player online role playing games. The stock resides in the Internet-Content group which is presently ranked 31st on the 197 Industry Groups list which is inside the much-preferred top quartile of groups, satisfing the L criteria. The number of top-rated funds with an ownership interest has grown from 42 funds in June '08 to 67 funds as of March '09, an encouraging sign of increasing institutional interest (the I criteria). Strong quarterly earnings growth satisfies the C criteria. Its dip in 2006 is a flaw which was previously noted as a concern in its otherwise impressive and strong annual earnings history (the A criteria). See additional concerns below.
What to Look For and What to Look Out For: The stock is currently trading above its maximum buy price, and caution and patience are suggested. SNDA is scheduled to report earnings on Wednesday, June 3rd, after the close of trading. Street estimates are mostly in the range of 72-74 cents per share, and it has a history of beating expectations. Near earnings news, investors may expect that volume and price action can be very volatile, and another currently Featured Stock, Netease.com Inc (NTES) provides a great recent example. It is important to remain disciplined, and chasing it after its impressive rally from $19.75 on December 1st may not be a prudent move. Instead, look for this stock to pullback and offer investors a chance to accumulate shares below its maximum buy price ($56.65). Bear in mind that it may eventually test important near-term support at its 50-day moving average (DMA) line, much the way Longtop Financial Technologies Ltd (LFT) recently did (while maneuvering to offer shares) after a comparable advance in the same timeframe. This past week, Shanda said that, subject to SEC clearance, it would offer shares in its online gaming unit "as capital-markets conditions permit." The number of shares the subsidiary will sell, and price, were not yet determined.
Of the few favorable looking leaders showing up in recent CANSLIM.net reports, Chinese firms have obviously enjoyed a heavy weighting. Caution is advised due to the inherent risk of international exposure, as geo-political news or events could prompt the entire group of foreign stocks to suddenly trade drastically down or up. While the current leadership is noted in China-linked stocks, and it could be an ongoing phenomenon; investors are reminded to make disciplined buys and sells always. Mindray Medical International Ltd. (MR) and China Medical Technologies Inc. (CMED) are two fine examples of former leaders hailing from China. Both companies continued producing impressive quarterly sales revenues and earnings increases for a long time afterwards, but they slumped badly since being dropped from the CANSLIM.net Featured Stocks list in 2008.
Keep in mind that much of a stock's success depends on the broader market's (the M criteria) ability to sustain a meaningful rally, otherwise 3 out of 4 stocks are likely to struggle in the event that the latest rally-attempt encounters more distributional pressure. Confirming gains backed by more than the minimum +50% above average volume guideline would provide a reassuring "follow through" that might reaffirm its recent breakout. No overhead supply can hinder the stock's ability to rally, which is an encouraging sign.
Technical Analysis: In March it was noted in several mid-day reports as it challenged and broke out above its January chart highs near $34. From its stage 1 base breakout it rallied +56% before pausing to consolidate. The stock spent a little over a month building its second stage base ($46-54) before its May 19th gain on heavy volume. That session's close was off well off its high and below the pivot point, which is considered a technical flaw in its latest breakout, which has been followed by lighter volume gains as the stock has gotten extended beyond its "max buy" level.