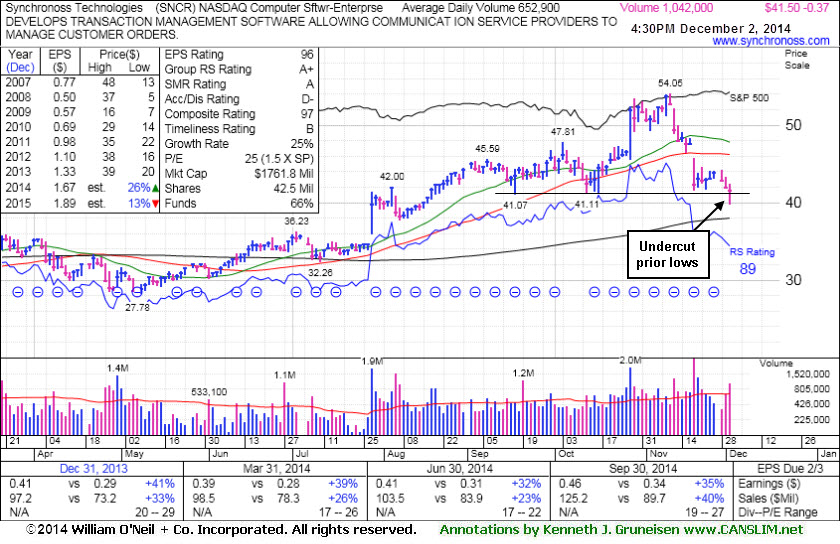
Synchronoss Technologies (SNCR -$0.37 or -0.91% to $41.50) finished near the middle of its intra-day range but it was down again today and with above average volume. In the process it slumped further below its 50-day moving average (DMA) line and undercut prior lows in the $41 area raising greater concerns. It will be dropped from the Featured Stocks list tonight.
Disciplined investors limit losses by selling any stock with falls more than -7% from their purchase price. SNCR was last shown in this FSU section on 11/12/14 with annotated graphs under the headline, "Loss on Heavy Volume a Sign of Distributional Pressure". It gapped down on 11/19/14 with a damaging loss on even higher volume noted while violating its 50 DMA line - triggering a worrisome technical sell signal.
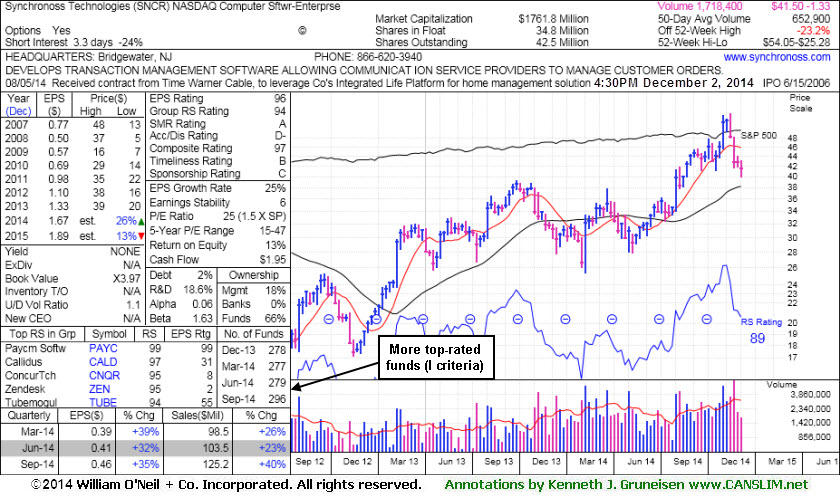
SNCR was highlighted in yellow in the 10/27/14 mid-day report (read here). It blasted higher on the next session after the high-ranked Computer Software - Enterprise firm reported earnings +35% on +40% sales revenues for the Sep '14 quarter. Prior quarterly earnings had been above the +25% minimum guideline (C criteria) of the fact-based system, and it has a strong annual earnings (A criteria) history. The number of top-rated funds owning its shares rose from 277 in Mar '14 to 296 in Sep '14, a reassuring sign concerning the I criteria.
SNCR was last shown in this FSU section on 10/27/14 with annotated graphs under the headline, "No Resistance Remains; Perched at Secondary Buy Point", after highlighted in yellow while perched near its 52-week high with an annotated weekly graph in the earlier mid-day report (read here). It blasted higher on the next session after the high-ranked Computer Software - Enterprise firm reported earnings +35% on +40% sales revenues for the Sep '14 quarter. Prior quarterly earnings had been above the +25% minimum guideline (C criteria) of the fact-based system, and it has a strong annual earnings (A criteria) history.
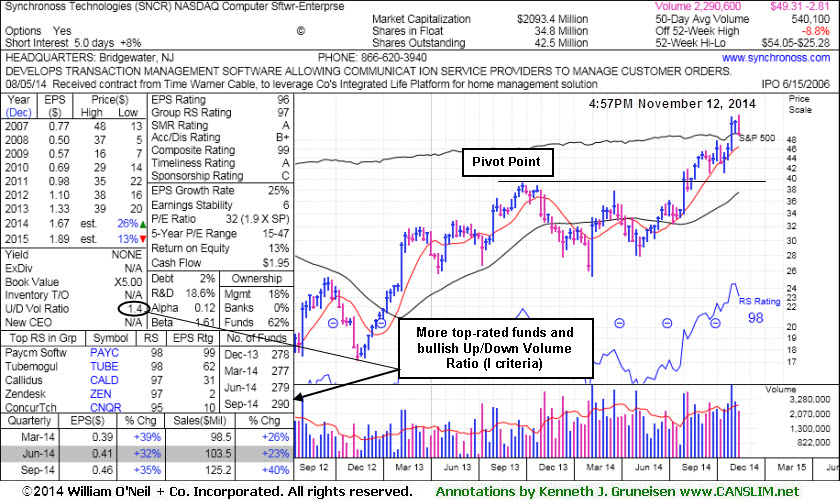
The number of top-rated funds owning its shares rose from 277 in Mar '14 to 290 in Sep '14, a reassuring sign concerning the I criteria. Its current Up/Down Volume Ratio of 1.4 is an unbiased indication its shares have been under accumulation over the past 50 days.
Synchronoss Technologies (SNCR +$0.46 or +1.00% to $46.59) was highlighted in yellow while perched near its 52-week high with an annotated weekly graph in the earlier mid-day report (read here). No resistance remains due to overhead supply. In the Certification they teach that a valid secondary buy point exists under the fact-based system up to +5% above the latest high following the first successful test of a stock's 10-week moving average (WMA) line after an earlier technical breakout. The mid-day report showed an annotated weekly graph which illustrated its successful test of the 10 WMA.
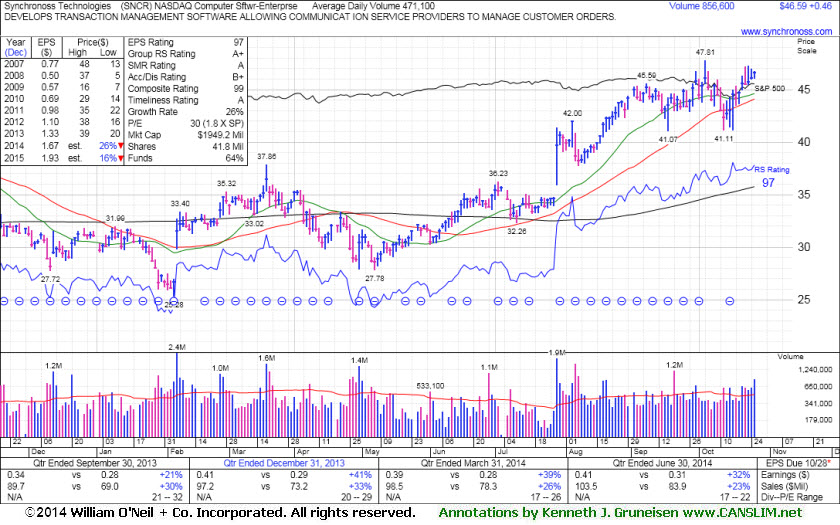
The high-ranked Computer Software - Enterprise firm is due to report Sep '14 quarterly earnings Tuesday morning. Volume and volatility often increase near earnings news. It was last noted with caution in the 8/20/14 mid-day report - "Patient investors may watch for a new base or secondary buy point to possibly develop and be noted in the weeks ahead. Quarterly earnings (C criteria) history through Jun '14 has been above the guidelines of the fact-based system and it has a strong annual earnings (A criteria) history."
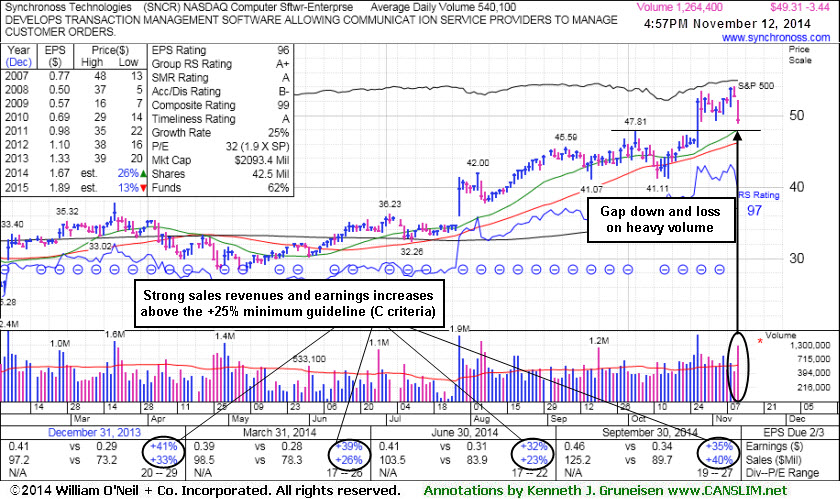
The number of top-rated funds owning its shares rose from 277 in Mar '14 to 286 in Sep '14, a reassuring sign concerning the I criteria. Its current Up/Down Volume Ratio of 2.0 is an unbiased indication its shares have been under accumulation over the past 50 days.