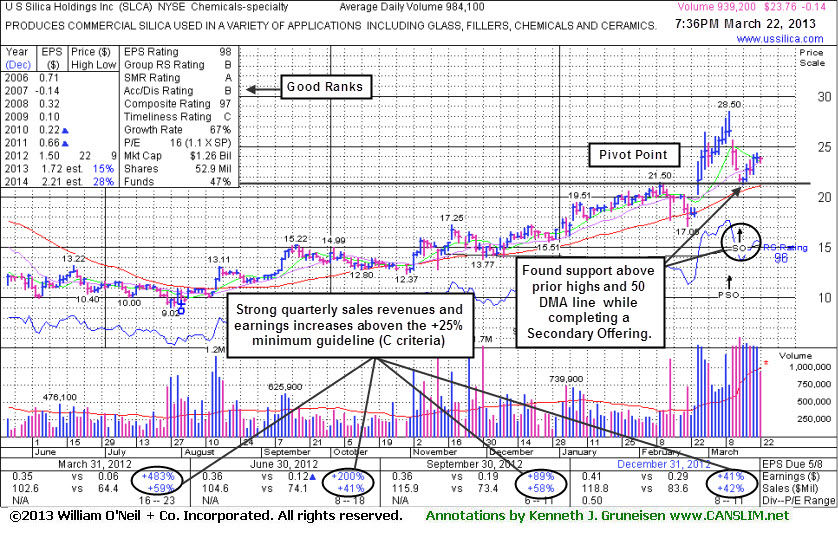
U S Silica Holdings Inc (SLCA -$0.14 or -0.59% to $23.76) tallied considerable volume-driven gains this week while rebounding from losses since completing a Secondary Offering on 3/14/13. It found support above prior highs and above its 50-day moving average (DMA) line, whereas a violation of those levels would have completely negated the stock's prior breakout and raised serious concerns.
The high-ranked leader from the Chemicals - Specialty industry group was last shown in this FSU section on 2/26/13 with an annotated weekly graph under the headline, "Broader Market May Hurt Outlier's Chances After Breakout". A weekly graph illustrated how, technically, its big gain cleared the right side of the previously noted very deep 11-month cup shaped base. The broader market soon resumed its rally with a follow-through day noted in the 3/05/13 market commentary. By that time, however, SLCA had already followed up its breakout with a streak of volume-driven gains. By quickly ratcheting more than +20% above its pivot point in the first 2-3 weeks, it had the look of some of the market's historic great winners. Regular readers saw it repeatedly noted - "Having rallied more than +20% in the first 2-3 weeks after its breakout, the investment system rules suggest holding such winners for a minimum of 8 weeks." Then, a Secondary Offering it proposed after the close on 3/11/13 led to an abrupt pullback. Yet, as we have observed upon Secondary Offerings by other high-ranked leaders - "Such offerings often are a short-term hindrance to upward price progress yet typically result in broader institutional ownership interest."
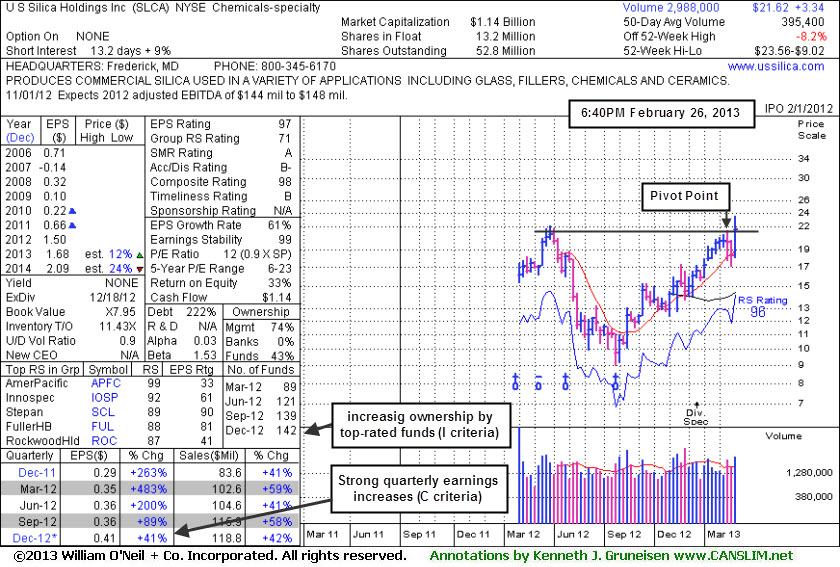
SLCA reported strong sales revenues and earnings growth in the most current quarterly (C criteria) comparisons through Dec '12. The small supply (S criteria) of only 13.2 million shares in the public float may contribute to greater volatility in the event of institutional positioning. The number of top-rated funds owning its shares rose from 89 in Mar '12 to 146 in Dec '12 which is reassuring concerning the I criteria.
Often, when a leading stock is breaking out of a solid base it is highlighted in CANSLIM.net's Mid-Day Breakouts Report. The most relevant factors are noted in the report which alerts prudent CANSLIM oriented investors. After doing any necessary backup research, the investor is prepared to act. Disciplined investors know to buy as near as possible to the pivot point and avoid chasing stocks after they have rallied more than +5% above their pivot point. It is crucial to always limit losses whenever any stock heads the wrong direction, and disciplined investors sell if a struggling stock ever falls more than -7% from their purchase price.
U S Silica Holdings Inc (SLCA +$3.27 or +17.82% to $21.62) was highlighted in yellow with pivot point based on its 2/11/13 high in the earlier mid-day report (read here). It reported strong sales revenues and earnings growth in the most current quarterly (C criteria) comparisons through Dec '12. It gapped up from near its 50-day moving average (DMA) line with a considerable volume-driven gain for a new 52-week high.
Disciplined investors may note, however, that the weakness in the broader market (M criteria) is an overriding concern which hurts the chances for most stocks until a new confirmed rally. Pay extra attention to the bold portion of the daily market commentary for ongoing analysis on market conditions as the changing stance impacts what followers of the fact-based investment system must do. Three out of four stocks tend to follow the direction of the broader market, so this outlier's chances of making meaningful progress may not be very good unless the market's strong 2013 rally quickly resumes.
Technically, its big gain cleared the right side of the previously noted very deep 11-month cup shaped base. The weekly graph below shows that there was above average volume behind recent losses in the "handle", whereas lighter volume totals in the handle are considered healthier action based on historic examples. The small supply (S criteria) of only 13.2 million shares in the public float may contribute to greater volatility in the event of institutional positioning. The number of top-rated funds owning its shares rose from 89 in Mar '12 to 142 in Dec '12 which is reassuring concerning the I criteria.