Halted Slide Following 50-Day Moving Average Violation - Thursday, April 03, 2014
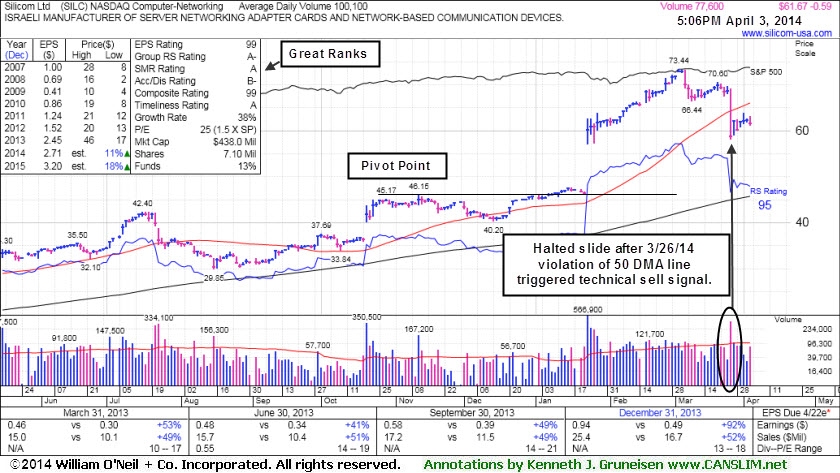
Silicom Ltd (SILC -$0.59 or -0.95% to $61.67) halted its slide after a damaging volume-driven loss last week violated its 50-day moving average (DMA) line triggering a technical sell signal. Only a prompt rebound above that important short-term average would help its outlook improve. More damaging losses leading to deterioration below the recent low ($58.12 on 3/26/14) would raise greater concerns and trigger additional technical sell signals. It is extended from any sound base. Patient investors may watch for a new base or secondary buy point to possibly develop and be noted in the weeks ahead.
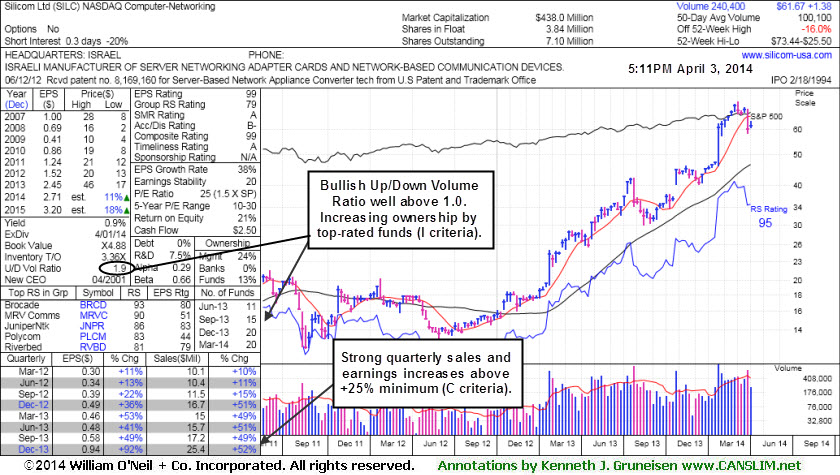
It was last shown in this FSU section on 3/20/14 with annotated graphs under the headline, "Traded Up +64.6% in Under 3 Months Since Featured in Mid-Day Report", two and a half months after first featured in yellow at $44.62 in the 12/23/13 mid-day report (read here). There was a considerable "breakaway gap" up on 1/23/14 after reporting earnings +92% on +52% sales for the Dec '13 quarter, beating consensus estimates and continuing its streak of strong quarterly earnings increases satisfying the C criteria. After a downturn in FY '08 and '09 earnings its annual earnings (A criteria) history has shown strong and steady growth. Its small supply (S criteria) of only 3.84 million shares in the public float can contribute to greater price volatility in the event of institutional buying or selling. The number of top-rated funds owning its shares rose from 7 in Dec '12 to 20 in Dec '13, a reassuring sign concerning the I criteria. Its current Up/Down Volume Ratio of 1.9 is also an unbiased indication its shares have been under accumulation over the past 50 days.
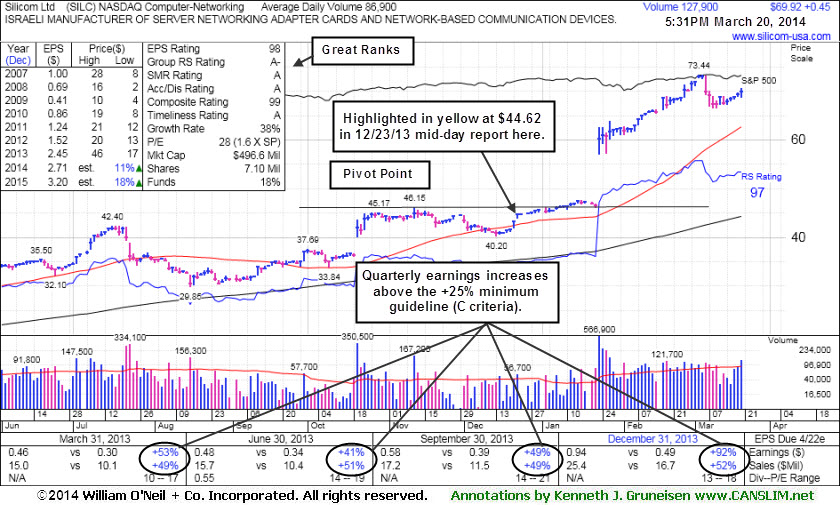
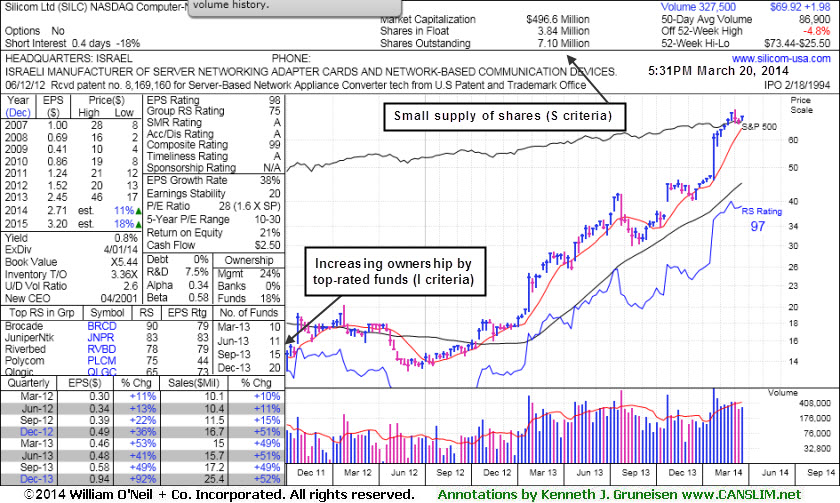
Traded Up +64.6% in Under 3 Months Since Featured in Mid-Day Report - Thursday, March 20, 2014
Silicom Ltd (SILC +$0.45 or +0.65% to $69.92) posted a 5th consecutive small gain today with increasing volume. Now in its 3rd week of consolidation, it recently has been noted - "Extended from any sound base. Patient investors may watch for a new base or secondary buy point to possibly develop and be noted in the weeks ahead." It has stubbornly held its ground since its last appearance in this FSU section on 3/06/14 with annotated graphs under the headline, "Very Extended From Prior Base After 11 Straight Weekly Gains". It traded up as much as +64.6% in the two and a half months since first featured in yellow at $44.62 in the 12/23/13 mid-day report (read here).There was a considerable "breakaway gap" up on 1/23/14 after reporting earnings +92% on +52% sales for the Dec '13 quarter, beating consensus estimates and continuing its streak of strong quarterly earnings increases satisfying the C criteria. After a downturn in FY '08 and '09 earnings its annual earnings (A criteria) history has shown strong and steady growth. Its small supply (S criteria) of only 3.84 million shares in the public float can contribute to greater price volatility in the event of institutional buying or selling. The number of top-rated funds owning its shares rose from 7 in Dec '12 to 20 in Dec '13, a reassuring sign concerning the I criteria. Its current Up/Down Volume Ratio of 2.6 is also an unbiased indication its shares have been under accumulation over the past 50 days.
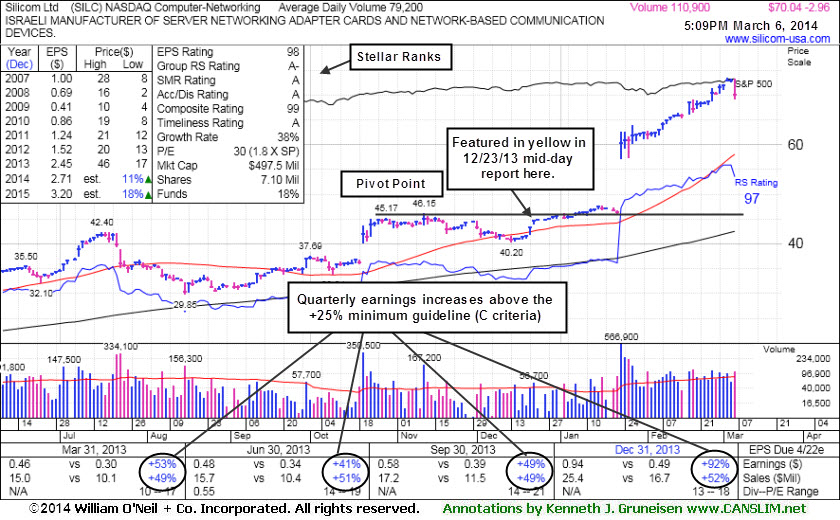
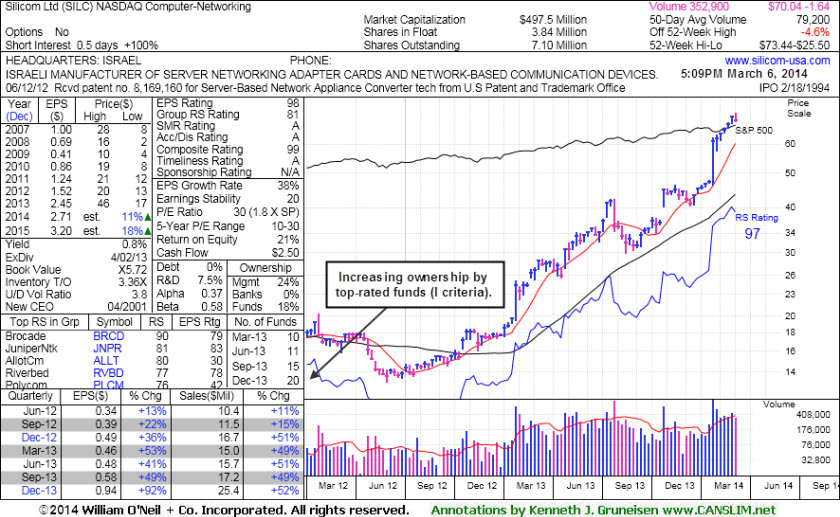
Very Extended From Prior Base After 11 Straight Weekly Gains - Thursday, March 06, 2014
Silicom Ltd (SILC -$2.96 or -4.05% to $70.04) pulled back from all-time highs with today's loss on higher volume following a streak of 4 consecutive gains. It is extended from any sound base after 11 consecutive weekly gains. Patient investors may watch for a new base or secondary buy point to possibly develop and be noted in the weeks ahead. It made gradual progress since last shown in this FSU section on 2/11/14 under the headline, "Stubbornly Held Ground Following Breakaway Gap".There was a considerable "breakaway gap" up on 1/23/14 after reporting earnings +92% on +52% sales for the Dec '13 quarter, beating consensus estimates and continuing its streak of strong quarterly earnings increases satisfying the C criteria. After a downturn in FY '08 and '09 earnings its annual earnings (A criteria) history has shown strong and steady growth. Its small supply (S criteria) of only 3.84 million shares in the public float can contribute to greater price volatility in the event of institutional buying or selling. The number of top-rated funds owning its shares rose from 7 in Dec '12 to 20 in Dec '13, a reassuring sign concerning the I criteria. Its current Up/Down Volume Ratio of 3.8 is also an unbiased indication its shares have been under accumulation over the past 50 days.
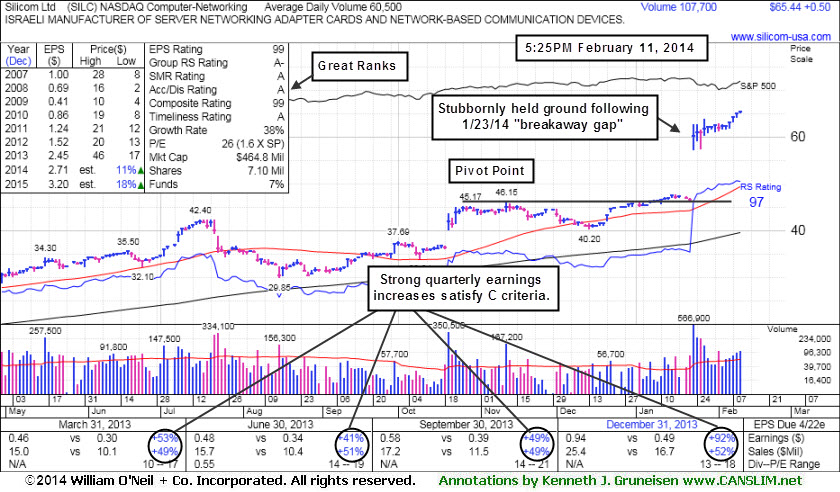
Stubbornly Held Ground Following Breakaway Gap - Tuesday, February 11, 2014
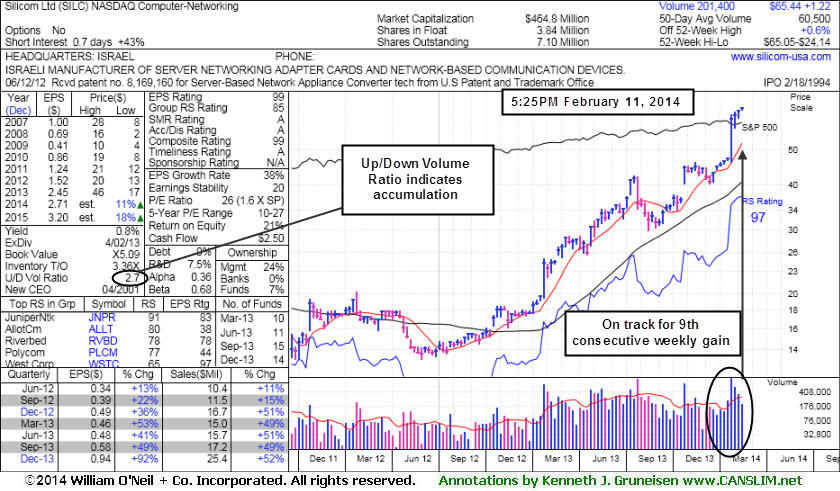
Silicom Ltd (SILC +$0.50 or +0.77% to $65.44) is hovering near its 52-week high, extended from any sound base while on track for a 9th consecutive weekly gain. It has been stubbornly holding its ground since last shown in this FSU section on 1/23/14 under the headline, "Considerable Gap Up Following Strong Earnings Report ". There was a considerable "breakaway gap" up on 1/23/14 after reporting earnings +92% on +52% sales for the Dec '13 quarter, beating consensus estimates and continuing its streak of strong quarterly earnings increases satisfying the C criteria.
After a downturn in FY '08 and '09 earnings its annual earnings (A criteria) history has shown strong and steady growth. Its small supply (S criteria) of only 3.93 million shares in the public float can contribute to greater price volatility in the event of institutional buying or selling. The number of top-rated funds owning its shares rose from 7 in Dec '12 to 14 in Dec '13, a reassuring sign concerning the I criteria. Its current Up/Down Volume Ratio of 2.7 is also an unbiased indication its shares have been under accumulation over the past 50 days."
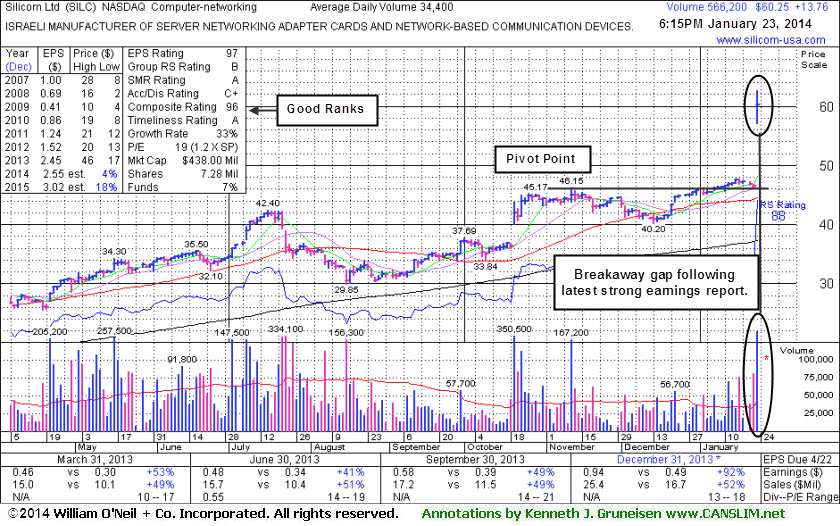
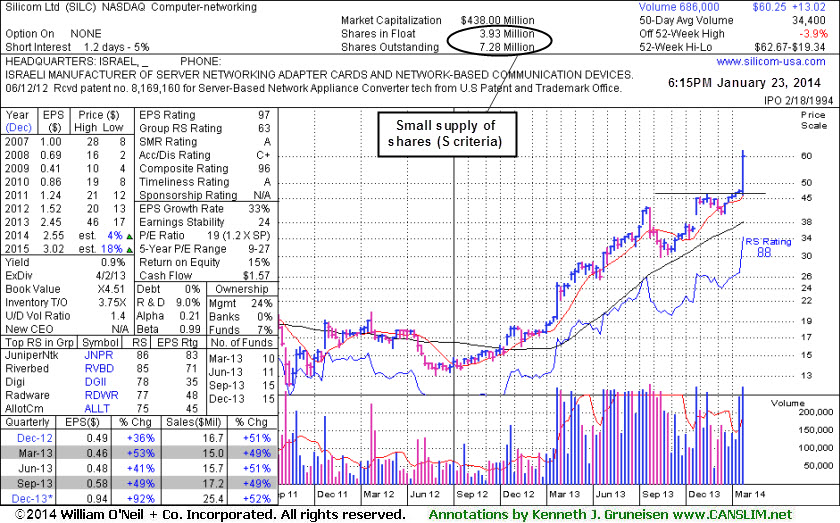
Considerable Gap Up Following Strong Earnings Report - Thursday, January 23, 2014
Silicom Ltd (SILC +$13.76 or +29.6% to $60.25) reported earnings +92% on +52% sales for the Dec '13 quarter, beating consensus estimates and continuing its streak of strong quarterly earnings increases satisfying the C criteria. It gapped up today for a considerable volume-driven gain and new 52-week high. Its color code was changed to green after exceeding its "max buy" level.SILC was last shown in this FSU section on 12/24/13 with annotated graphs under the headline, "Stock With Small Supply Has Formed a Sound Base Pattern". The high-ranked Computer - Networking firm had finished strong after highlighted in the 12/23/13 mid-day report in yellow with pivot point cited based on its 11/12/13 high plus 10 cents (read here). Members were reminded -
"Subsequent volume-driven gains above the pivot point may trigger a technical buy signal. Disciplined investors know there is no advantage to buying "early", but after fresh proof of institutional buying demand the odds are considered most favorable for any stock to continue on to produce meaningful gains."
"After a downturn in FY '08 and '09 earnings its annual earnings (A criteria) history has shown strong and steady growth. Its small supply (S criteria) of only 3.93 million shares in the public float can contribute to greater price volatility in the event of institutional buying or selling. The number of top-rated funds owning its shares rose from 7 in Dec '12 to 15 in Sep '13, a reassuring sign concerning the I criteria. Its current Up/Down Volume Ratio of 1.8 is also an unbiased indication its shares have been under accumulation over the past 50 days."
Below is a summary of recent notes which alerted members when taking action may have been appropriate under the fact-based investment system's guidelines. Remember that your upgraded membership allows you to chose the "Set NEW NOTE alert" link for any stocks you wish closely monitor, then you will automatically receive new notes from our experts directly via email as soon as they are published, keeping you informed ahead of the subsequently published reports. All prior notes on stocks can be reviewed via the "View all notes" links and via the Company Profile pages members can go back and review all Featured Articles & Daily Graphs annotated in prior reports.
1/22/2014 12:40:47 PM - Y - Still hovering near its 52-week high following a streak of 10 consecutive small gains. It remains below its "max buy" level with near-term support to watch at its 50 DMA line.
1/16/2014 1:29:34 PM - Y - Inching to yet another new 52-week high with today's 10th consecutive small gain, yet it remains below its "max buy" level. Last noted on 1/13/14, its small gain on the session with +122% above average volume confirmed a technical buy signal.
1/13/2014 1:21:24 PM - Y - Hitting another new 52-week high with today's 7th consecutive small gain, inching higher without especially great volume conviction. Volume should be a minimum of +40% above average behind gains above a stock's pivot point to trigger a proper technical buy signal.
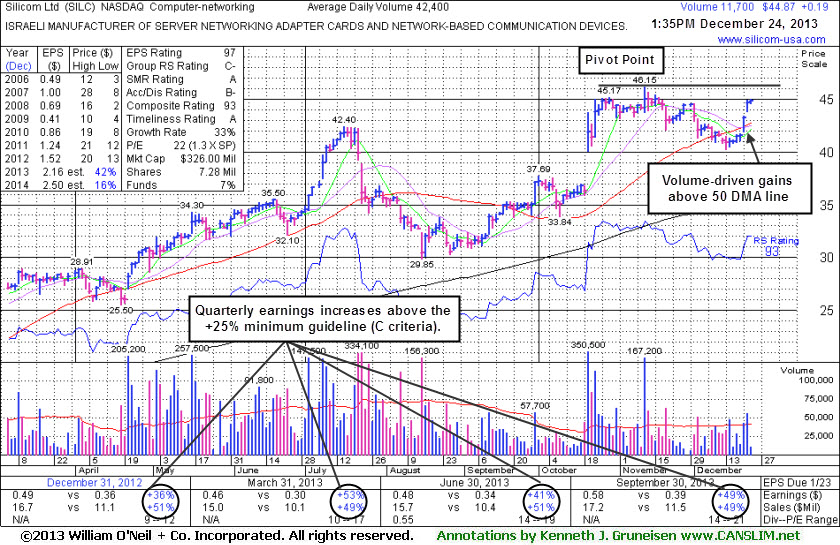
Stock With Small Supply Has Formed a Sound Base Pattern - Tuesday, December 24, 2013
Silicom Ltd (SILC +$0.19 to $44.87) posted a quiet gain today. It finished strong after highlighted in the 12/23/13 mid-day report in yellow with pivot point cited based on its 11/12/13 high plus 10 cents (read here). This Israeli manufacturer of Computer - Networking devices has rebounded from below its 50-day moving average (DMA) line and rallied toward its 52-week high with volume-driven gains leaving very little resistance remaining due to overhead supply. Subsequent volume-driven gains above the pivot point may trigger a technical buy signal. Disciplined investors know there is no advantage to buying "early", but after fresh proof of institutional buying demand the odds are considered most favorable for any stock to continue on to produce meaningful gains.
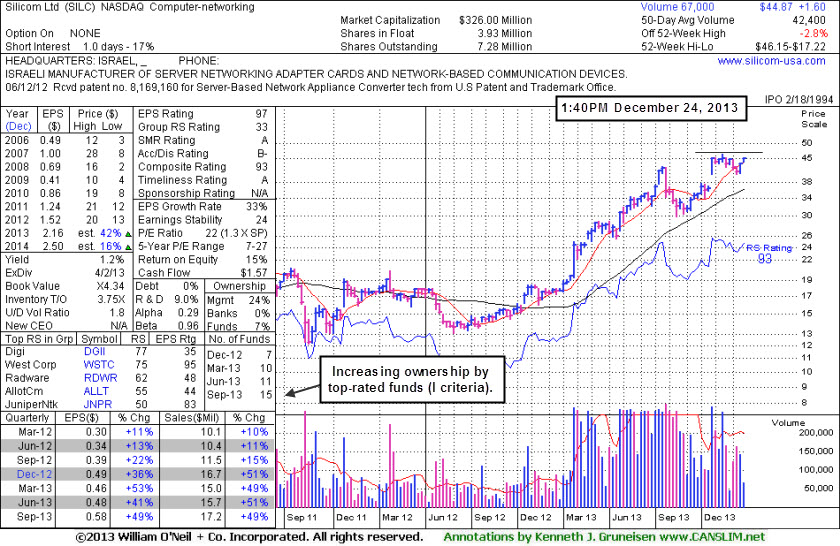
The high-ranked Computer - Networking firm recently reported earnings +49% on +49% sales revenues for the Sep '13, continuing its streak of strong quarterly earnings increases satisfying the C criteria. After a downturn in FY '08 and '09 earnings its annual earnings (A criteria) history has shown strong and steady growth.
Its small supply (S criteria) of only 3.93 million shares in the public float can contribute to greater price volatility in the event of institutional buying or selling. The number of top-rated funds owning its shares rose from 7 in Dec '12 to 15 in Sep '13, a reassuring sign concerning the I criteria. Its current Up/Down Volume Ratio of 1.8 is also an unbiased indication its shares have been under accumulation over the past 50 days.