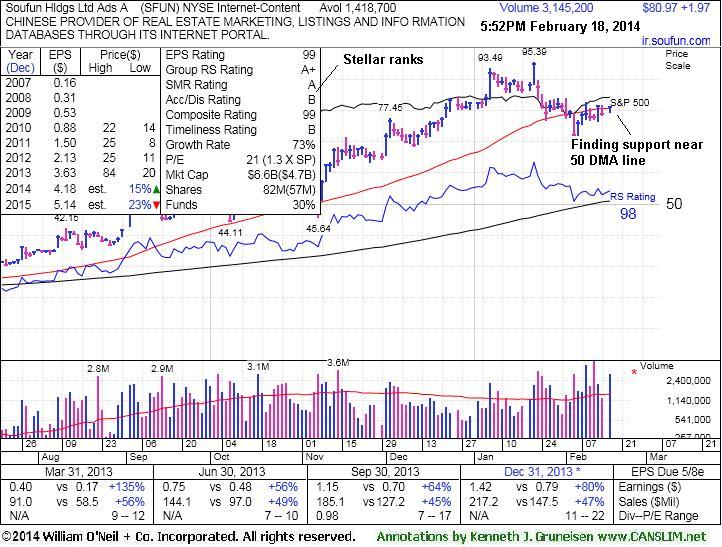
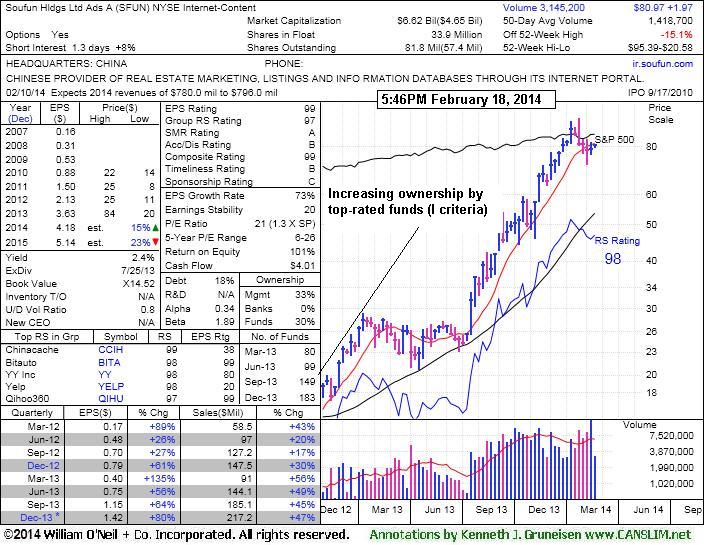
Finding Support Near 50-Day Moving Average Line - Tuesday, February 18, 2014
Soufun Hldgs Ltd Ads (SFUN +$1.97 or +2.49% to $80.97) has been consolidating near its 50-day moving average (DMA) line and tallied a solid gain today with above average volume. It has not formed a sound base. Disciplined investors avoid chasing extended stocks. It traded up as much as +247% since first featured in the 2/11/13 mid-day report in yellow (read here). The high-ranked Internet - Content firm has been enduring distributional pressure while retreating from its 52-week high since last shown in this FSU section on 1/31/14 with annotated graphs under the headline, "50-Day Moving Average Defines Near Term Support After Great Rally". It has been repeatedly noted as very extended from any sound base. Its prior low ($71.77 on 2/06/14) defines important support below its 50 DMA line ($80.70 now). Deterioration below the 50 DMA line or recent lows may trigger worrisome technical sell signals.
Fundamentals remain strong as it reported +80% earnings on +47% sales revenues for the Dec '13 quarter versus the year ago period, solidly satisfying the C criteria. The number of top-rated funds owning its shares rose from 67 in Sep '12 to 183 in Dec '13, a reassuring sign concerning the I criteria. Its small supply (S criteria) of only 33.9 million shares in the public float can contribute to greater price volatility in the event of institutional buying or selling.
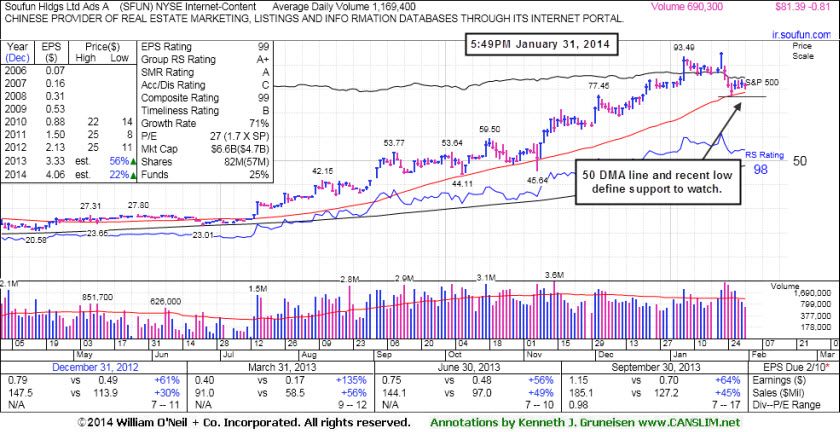
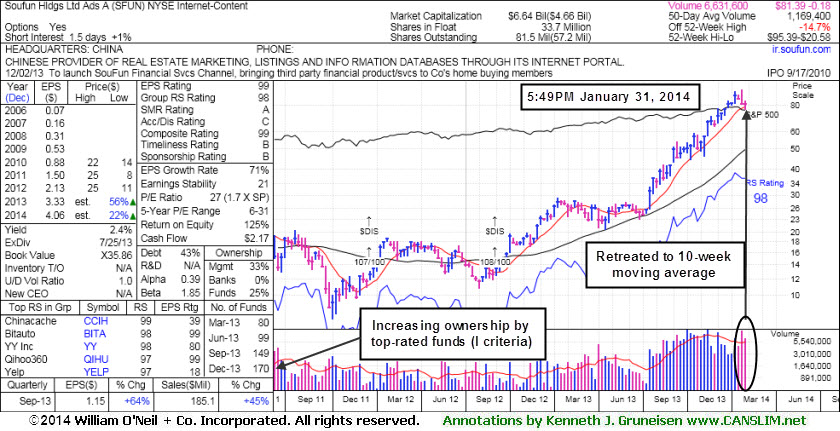
50-Day Moving Average Defines Near Term Support After Great Rally - Friday, January 31, 2014
Soufun Hldgs Ltd Ads (SFUN -$0.81 or -0.99% to $81.39) halted its slide at its 50-day moving average (DMA) line after 3 consecutive volume-driven losses. It has been repeatedly noted as very extended from any sound base. Its 50 DMA line ($78.52 now) defines important support to watch. A subsequent violation of the 50 DMA line or recent lows may trigger worrisome technical sell signals.
The high-ranked Internet - Content firm had powered into new high territory since last shown in this FSU section on 1/10/14 with annotated graphs under the headline, "Extended From Base Following More Volume-Driven Gains", and prior reports cautioned - "It is extended from any sound base pattern yet may produce more climactic gains. Disciplined investors avoid chasing extended stocks. It traded up as much as +247% since first featured in the 2/11/13 mid-day report in yellow (read here).
Fundamentals remain strong as it reported +64% earnings on +45% sales revenues for the Sep '13 quarter versus the year ago period, solidly satisfying the C criteria. The number of top-rated funds owning its shares rose from 67 in Sep '12 to 170 in Dec '13, a reassuring sign concerning the I criteria. Its small supply (S criteria) of only 33.7 million shares in the public float can contribute to greater price volatility in the event of institutional buying or selling.
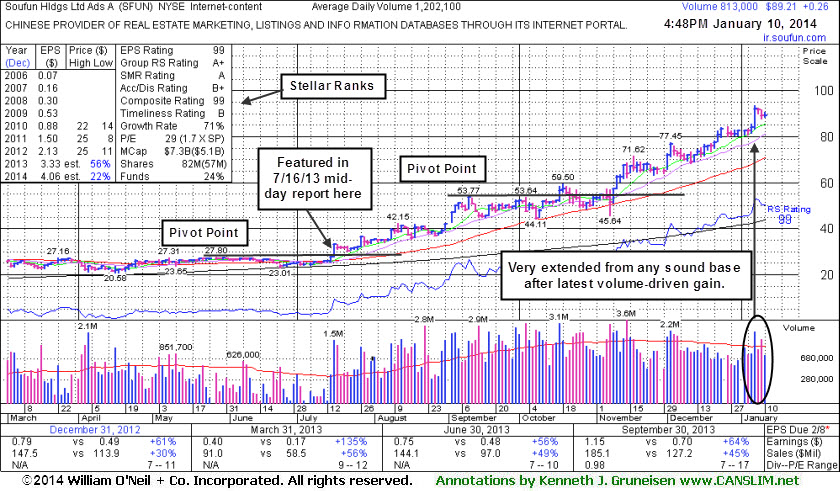
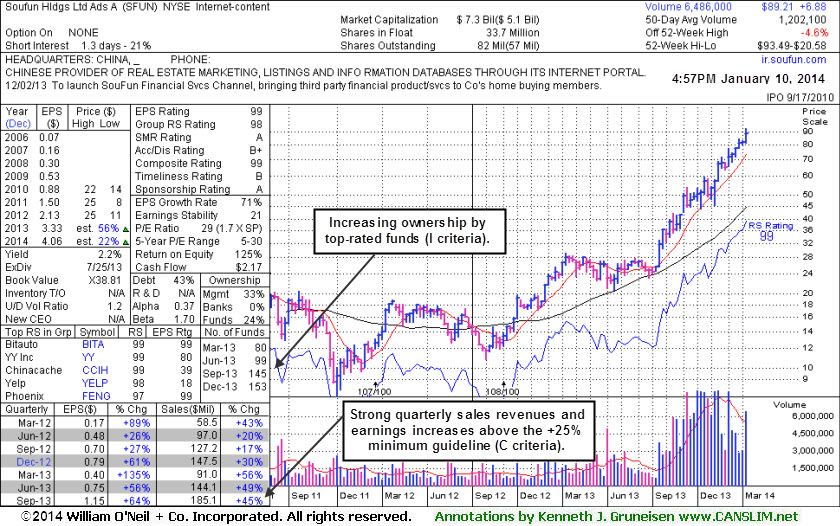
Extended From Base Following More Volume-Driven Gains - Friday, January 10, 2014
Soufun Hldgs Ltd Ads (SFUN +$0.26 or +0.29% to $89.21) is perched near its all-time high after tallying another considerable gain on 1/07/14 with above average volume. It has not flashed any worrisome technical sell signals which might prompt investors to look to lock in profits. Prior reports cautioned - "It is extended from any sound base pattern yet may produce more climactic gains. Prior highs and its 50 DMA line coincide in the $59 area defining important support to watch." Now its 50-day moving average (DMA) line comes into play near the $70 area as a support level to watch on pullbacks.The high-ranked Internet - Content firm powered into new high territory since last shown in this FSU section on 12/09/13 with annotated graphs under the headline, "Extended From Base Yet May Produce More Climactic Gains". Disciplined investors avoid chasing extended stocks. It has rallied +240% since first featured in the 2/11/13 mid-day report in yellow (read here).
Fundamentals remain strong as it reported +64% earnings on +45% sales revenues for the Sep '13 quarter versus the year ago period, solidly satisfying the C criteria. The number of top-rated funds owning its shares rose from 67 in Sep '12 to 153 in Dec '13, a reassuring sign concerning the I criteria. Its small supply (S criteria) of only 33.7 million shares in the public float can contribute to greater price volatility in the event of institutional buying or selling.
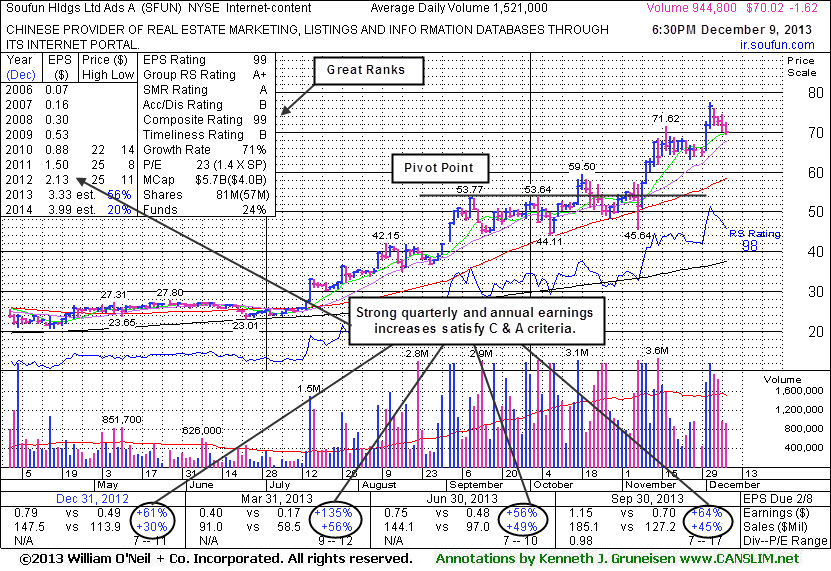
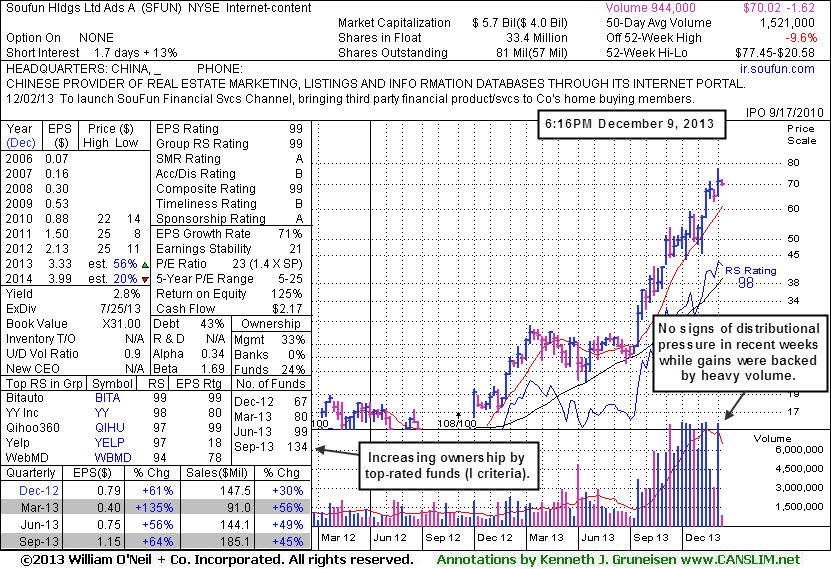
Extended From Base Yet May Produce More Climactic Gains - Monday, December 09, 2013
Soufun Hldgs Ltd Ads (SFUN -$1.62 or -2.26% to $70.02) is -9.6% off its all-time high after it pulled back for a 4th consecutive loss today with lighter volume, consolidating from its all-time high hit last week. It is extended from any sound base pattern yet may produce more climactic gains. Disciplined investors avoid chasing extended stocks. Prior highs and its 50-day moving average (DMA) line coincide in the $59 area defining important support to watch.
The high-ranked Internet - Content firm powered into new high territory since last shown in this FSU section on 11/08/13 with annotated graphs under the headline, "Perched Near All-Time High After Testing Support". It has rallied +182% since first featured in the 2/11/13 mid-day report in yellow (read here).
Fundamentals remain strong as it reported +64% earnings on +45% sales revenues for the Sep '13 quarter versus the year ago period, solidly satisfying the C criteria. The number of top-rated funds owning its shares rose from 67 in Sep '12 to 134 in Sep '13, a reassuring sign concerning the I criteria. Its small supply (S criteria) of only 33.4 million shares in the public float can contribute to greater price volatility in the event of institutional buying or selling.
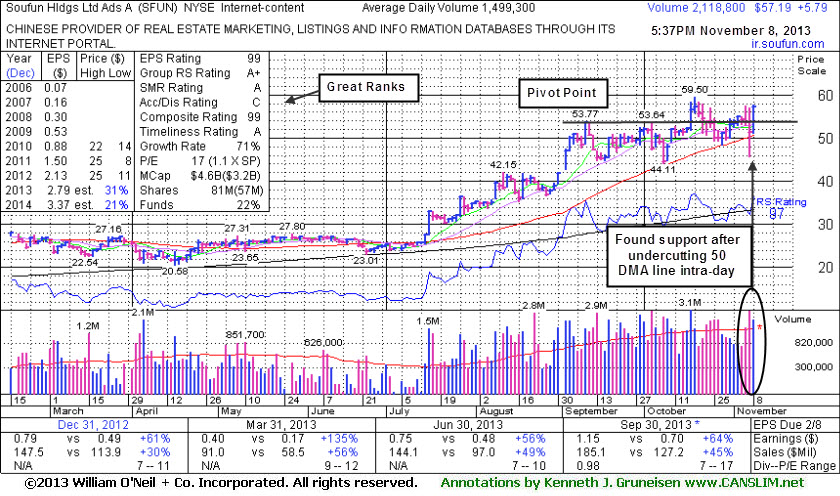
Perched Near All-Time High After Testing Support - Friday, November 08, 2013
Soufun Hldgs Ltd Ads (SFUN +$5.79 or +11.26% to $57.19) posted a large gain with above average volume, but lighter volume than the prior session. Wider than usual intra-day swings indicate uncertainty which often bodes poorly for stocks. It undercut its 50-day moving average (DMA) line and prior low ($48.30 on 10/19/13) intra-day Thursday yet rebounded to finish above that important short-term average and in the middle of the session's wider than usual range. More damaging losses would raise greater concerns, and the 50 DMA line is an area where it is likely to attract support from the institutional crowd unless their opinion on is outlook changes. It was last shown in this FSU section on 10/01/13 with an annotated graph under the headline, "Following Great Rally No New Base Has Been Formed".
Keep in mind that 3 out of 4 stocks tend to move in the direction of the major averages so broader market action (M criteria) will largely determine whether or not it might break down or produce more climactic gains in the weeks ahead. Prior reports cautioned members - "Disciplined investors avoid chasing stocks too extended from sound bases." It has traded up as much as +101% since it first appeared highlighted in yellow in the 7/16/13 the mid-day report (read here) while it spiked to new 52-week and all-time highs and quickly rallied above its "max buy" level.
Fundamentals remain strong as it reported +56% earnings on +49% sales revenues for the Jun '13 quarter versus the year ago period, solidly satisfying the C criteria. The number of top-rated funds owning its shares rose from 76 in Sep '12 to 113 in Jun '13, a reassuring sign concerning the I criteria. Its small supply (S criteria) of only 33.4 million shares in the public float can contribute to greater price volatility in the event of institutional buying or selling.

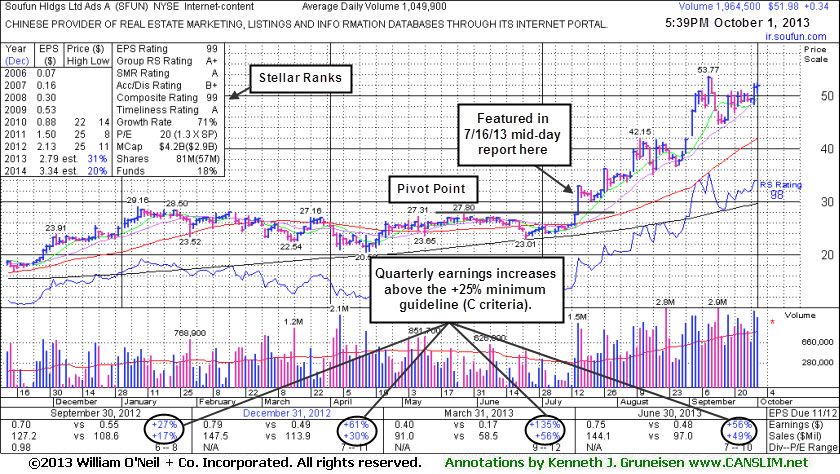
Following Great Rally No New Base Has Been Formed - Tuesday, October 01, 2013
Soufun Hldgs Ltd Ads (SFUN +$0.34 or +0.66% to $51.98) has rallied near its 52-week high with additional volume-driven gains this week. Prior reports cautioned - "This high-ranked Internet - Content firm may go on to produce more climactic gains, but it is very extended from any sound base. Recent highs near $42 define initial support to watch above its 50 DMA line." Its current consolidation is still too brief to be recognized as a sound base pattern. It rallied to new highs with volume-driven gains and has not spent much time basing since last shown in this FSU section on 8/30/13 with an annotated graph under the headline, "Volume-Driven Gain For a New High Close".It may possibly go on to form a new base or secondary buy point which may be noted in the weeks ahead. Prior reports cautioned members - "Disciplined investors avoid chasing stocks too extended from sound bases." It has traded up as much as +82% since it first appeared highlighted in yellow in the 7/16/13 the mid-day report (read here) while it spiked to new 52-week and all-time highs and quickly rallied above its "max buy" level.
Fundamentals remain strong as it reported +56% earnings on +49% sales revenues for the Jun '13 quarter versus the year ago period, solidly satisfying the C criteria. The number of top-rated funds owning its shares rose from 76 in Sep '12 to 98 in Jun '13, a reassuring sign concerning the I criteria. Its small supply (S criteria) of only 33.4 million shares in the public float can contribute to greater price volatility in the event of institutional buying or selling.
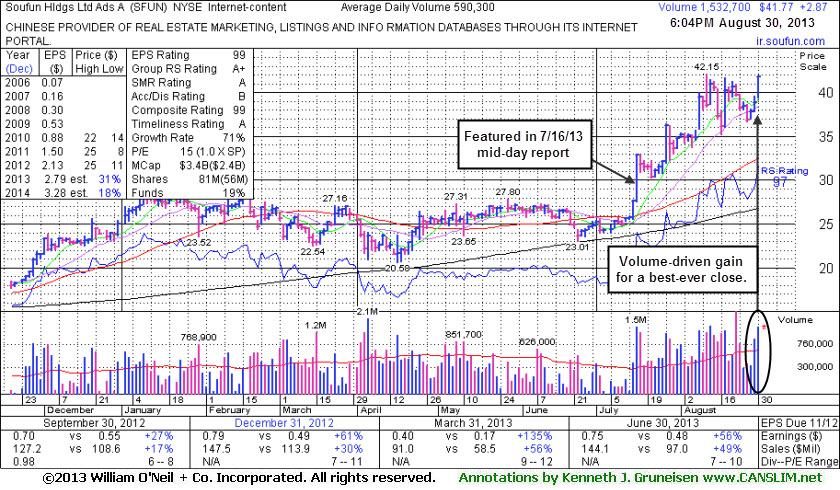
Volume-Driven Gain For a New High Close - Friday, August 30, 2013
Soufun Hldgs Ltd Ads (SFUN +$2.87 or +7.38% to $41.77) rallied to a best-ever close with another big volume-driven gain. It has shown strength and resilience amid widespread market (M criteria) weakness. It is extended from a sound base and prior reports cautioned - "Disciplined investors avoid chasing stocks too extended from sound bases." It was last shown in this FSU section on 8/08/13 with an annotated graph under the headline, "Finished at New High After Another Volume-Driven Gain", as it gapped up. It has traded up as much as +42.7% since it first appeared highlighted in yellow in the 7/16/13 the mid-day report (read here) while it spiked to new 52-week and all-time highs and quickly rallied above its "max buy" level.
Fundamentals remain strong as it reported +56% earnings on +49% sales revenues for the Jun '13 quarter versus the year ago period, solidly satisfying the C criteria. The number of top-rated funds owning its shares rose from 76 in Sep '12 to 96 in Jun '13, a reassuring sign concerning the I criteria. Its small supply (S criteria) of only 33.3 million shares in the public float can contribute to greater price volatility in the event of institutional buying or selling.
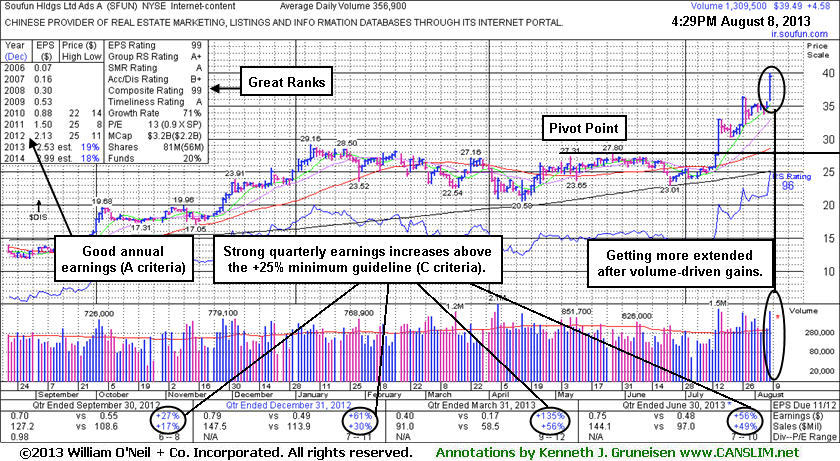
Finished at New High After Another Volume-Driven Gain - Thursday, August 08, 2013
Soufun Hldgs Ltd Ads (SFUN +$4.68 or +13.41% to $39.59) gapped up today, getting more extended from its latest base with another considerable volume-driven gain. It was last shown in this FSU section on 7/16/13 with an annotated weekly graph under the headline, "Finished Session With Large Breakout Gain on 5 Times Average Volume", after highlighted in the mid-day report (read here) as it spiked to new 52-week and all-time highs and quickly rallied above its "max buy" level.SFUN found support at its 200-day moving average (DMA) line during its long consolidation after dropped from the Featured Stocks list on 3/08/13. Fundamentals remained strong as it reported +56% earnings on +49% sales revenues for the Jun '13 quarter versus the year ago period. The number of top-rated funds owning its shares rose from 76 in Sep '12 to 88 in Jun '13, a reassuring sign concerning the I criteria. Its small supply (S criteria) of only 33.3 million shares in the public float can contribute to greater price volatility in the event of institutional buying or selling.
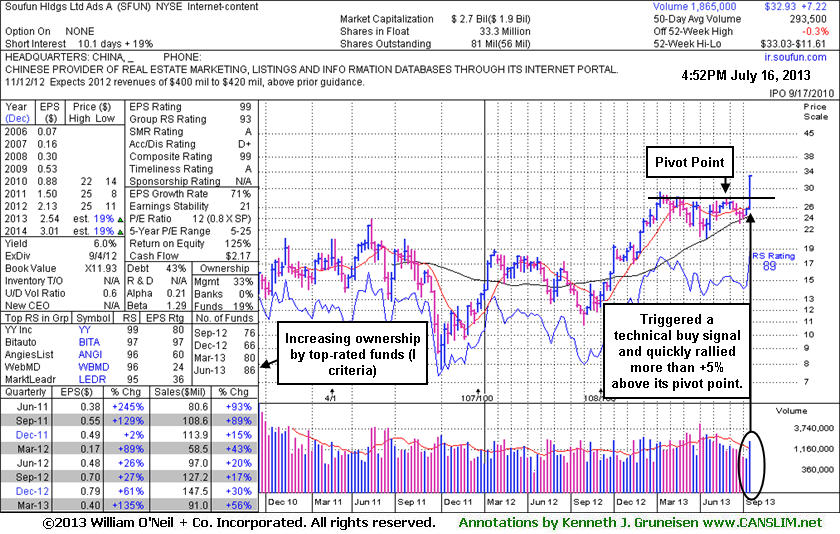
Finished Session With Large Breakout Gain on 5 Times Average Volume - Tuesday, July 16, 2013
Soufun Hldgs Ltd Ads (SFUN +$5.33 or +19.31% to $32.93) was highlighted in yellow with new pivot point cited based on its 5/28/13 high plus 10 cents in the earlier mid-day report (read here). It spiked to new 52-week and all-time highs clinching a technical buy signal. It finished strong with a considerable gain backed by more than 5 times average volume as it blasted above its pivot point and quickly rallied above its "max buy" level. Prior highs in the $28-29 area define initial support to watch on pullbacks. It found support at its 200-day moving average (DMA) line during its long consolidation after dropped from the Featured Stocks list on 3/08/13. Fundamentals remained strong as it reported +135% earnings on +56% sales revenues for the Mar '13 quarter versus the year ago period. The number of top-rated funds owning its shares rose from 76 in Sep '12 to 86 in Jun '13, a reassuring sign concerning the I criteria.
Approximately 40% of successful breakouts pull back and test support at their prior highs before continuing higher. Patient and disciplined investors watch out to avoid chasing extended stocks trading more than +5% above their pivot point. They may watch for opportunities to accumulate shares in strong leaders as secondary buy points and new bases possibly form and are noted in the weeks ahead. Keep in mind that during bullish market environments, strong leaders often will present multiple chances to accumulate their shares under the strict guidelines of the fact-based system.
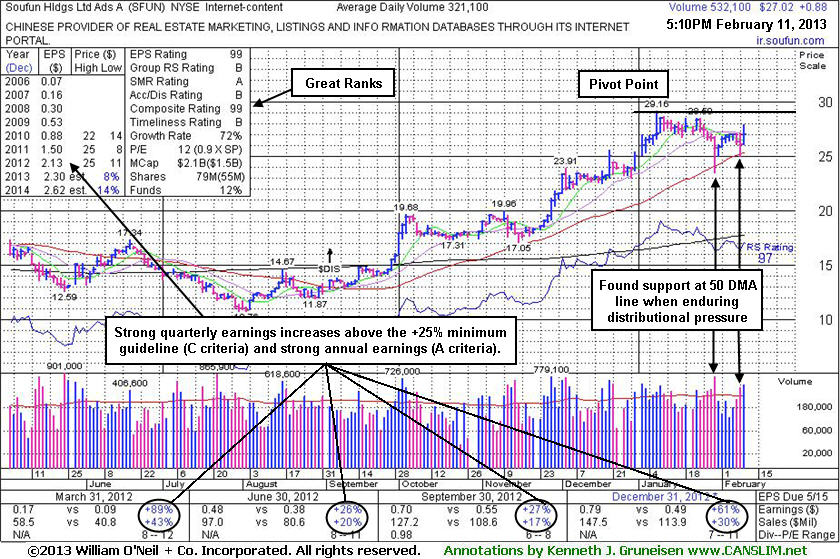
Forming Base While Enduring Distributional Pressure Above 50-Day Moving Average - Monday, February 11, 2013
Often, when a leading stock is setting up to breakout of a solid base it is highlighted in CANSLIM.net's Mid-Day Breakouts Report. The most relevant factors are noted in the report which alerts prudent CANSLIM oriented investors to place the issue in their watch list. After doing any necessary backup research, the investor is prepared to act after the stock triggers a technical buy signal (breaks above its pivot point on more than +50% average turnover) but before it gets too extended from a sound base. In the event the stock fails to trigger a technical buy signal and its price declines then it will simply be removed from the watch list. Disciplined investors know to buy as near as possible to the pivot point and avoid chasing stocks after they have rallied more than +5% above their pivot point. It is crucial to always limit losses whenever any stock heads the wrong direction, and disciplined investors sell if a struggling stock ever falls more than -7% from their purchase price.
Soufun Hldgs Ltd Ads (SFUN +$0.88 or +3.37% to $27.02) was highlighted in yellow with pivot point cited based on its 1/08/13 high plus 10 cents in the earlier mid-day report (read here). Disciplined investors may watch for subsequent volume-driven gains to confirm a proper technical buy signal. It finished -7.3% off its 52-week high today. It has endured distributional pressure in recent weeks as the annotated graph below shows, yet it has been finding support at its 50-day moving average (DMA) line and still building on an orderly base pattern. Its current Up/Down Volume Ratio of 1.4 is an unbiased indication institutional accumulation (I criteria) has been taking place over the past 50 days. Reported earnings +61% on +30% sales revenues for the Dec '12 quarter, marking 4 consecutive quarters with earnings above the +25% minimum guideline (C criteria). This high-ranked Chinese Real Estate Internet portal firm's IPO was on 9/17/10 and its shares split 4:1 on 2/18/11.