Perched Near All-Time High After Concerns Raised by Latest Earnings - Wednesday, February 22, 2017
ServisFirst Bancshares Inc (SFBS +$0.14 or +0.33% to $42.09) has been holding its ground stubbornly and perched at all-time highs. Recently it reported earnings +8% on +20% sales revenues for the Dec '16 quarter, below the +25% minimum guideline (C criteria), raising fundamental concerns. Its 50-day moving average (DMA) line ($38.57) defines important near-term support above recent lows in the $36 area. Subsequent violations would trigger technical sell signals.
SFBS was last shown in this FSU section on 1/12/17 with an annotated graph under the headline, "Stubbornly Holding Ground Near Highs". Do not be confused by 2-1 stock split effective 12/21/16 so the Featured Price, Pivot Point and Max Buy levels were adjusted accordingly. It got a burst of momentum along with many other Financial stocks following the election.
The 4 prior quarterly comparisons were above the +25% minimum earnings guideline (C criteria), helping it match the fact-based investment system's guidelines. Earnings rose +28%, +34%, and +31% in the Dec '15, Mar and Jun '16 quarters, respectively, and underlying sales revenues growth has been in the +17-26% range. Its annual earnings (A criteria) history has been strong.
The number of top-rated funds owning its shares rose from 159 in Sep '15 to 245 in Dec '16, a reassuring sign concerning the I criteria. Its current Up/Down Volume Ratio of 1.2 is an unbiased indication its shares have been under slight accumulation over the past 50 days. Its small supply of only 46.3 million shares (S criteria) in the public float can contribute to greater price volatility in the event of institutional buying or selling.
Charts used courtesy of www.stockcharts.com

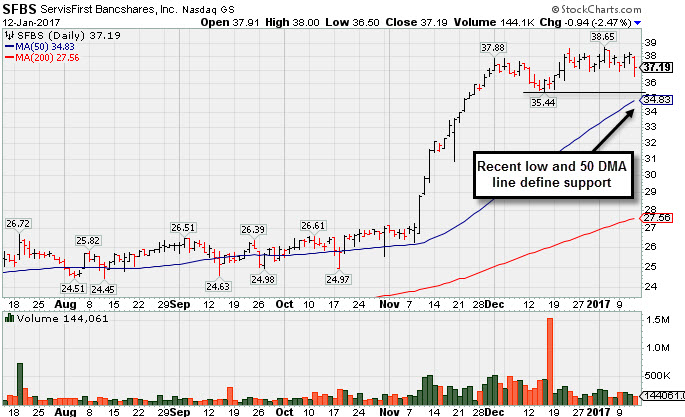
Stubbornly Holding Ground Near Highs - Thursday, January 12, 2017
ServisFirst Bancshares Inc (SFBS -$0.94 or -2.47% to $37.19) has been stubbornly holding its ground in a tight range near all-time highs, extended from its prior base. Its 50-day moving average (DMA) line ($34.86) defines important support to watch on pullbacks.
Do not be confused by 2-1 stock split effective 12/21/16 so the Featured Price, Pivot Point and Max Buy levels were adjusted accordingly since it was last shown in this FSU section on 12/14/16 with an annotated graph under the headline, "Financial Firm Remains Extended Well Above Prior Highs". It got a burst of momentum along with many other Financial stocks following the election.
SFBS reported earnings +28% on +18% sales revenues for the Sep '16 quarter, its 4th consecutive quarterly comparison above the +25% minimum earnings guideline (C criteria), helping it match the fact-based investment system's guidelines. Earnings rose +28%, +34%, and +31% in the Dec '15, Mar and Jun '16 quarters, respectively, and underlying sales revenues growth has been in the +17-26% range. Its annual earnings (A criteria) history has been strong.
The number of top-rated funds owning its shares rose from 159 in Sep '15 to 232 in Sep '16, a reassuring sign concerning the I criteria. Its current Up/Down Volume Ratio of 1.4 is an unbiased indication its shares have been under accumulation over the past 50 days. Its small supply of only 23.1 million shares (S criteria) in the public float can contribute to greater price volatility in the event of institutional buying or selling.
Charts used courtesy of www.stockcharts.com
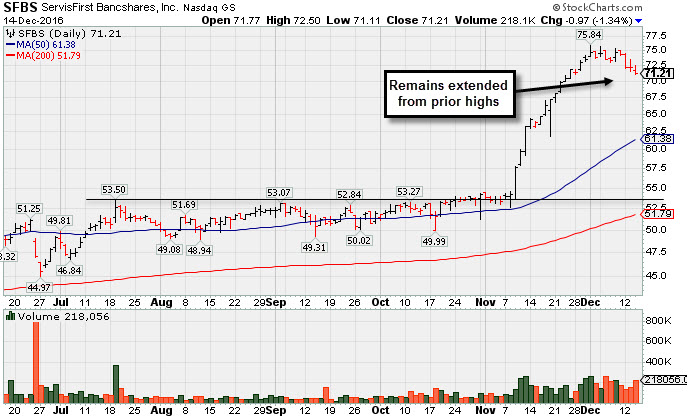
Financial Firm Remains Extended Well Above Prior Highs - Wednesday, December 14, 2016
ServisFirst Bancshares Inc (SFBS -$0.97 or -1.34% to $71.21) has recently been churning above average volume while pulling back from all-time highs. It remains very extended from its prior base. Its 50-day moving average (DMA) line ($61.38) defines important support to watch on pullbacks. It was last shown in this FSU section on 11/22/16 with an annotated graph under the headline, "Very Extended From Prior Base Following Post-Election Gains". It got a burst of momentum along with many other Financial stocks following the election.
SFBS reported earnings +28% on +18% sales revenues for the Sep '16 quarter, its 4th consecutive quarterly comparison above the +25% minimum earnings guideline (C criteria), helping it match the fact-based investment system's guidelines. Earnings rose +28%, +34%, and +31% in the Dec '15, Mar and Jun '16 quarters, respectively, and underlying sales revenues growth has been in the +17-26% range. Its annual earnings (A criteria) history has been strong.
The number of top-rated funds owning its shares rose from 159 in Sep '15 to 232 in Sep '16, a reassuring sign concerning the I criteria. Its current Up/Down Volume Ratio of 1.5 is an unbiased indication its shares have been under accumulation over the past 50 days. Its small supply of only 23.1 million shares (S criteria) in the public float can contribute to greater price volatility in the event of institutional buying or selling.
Charts used courtesy of www.stockcharts.com
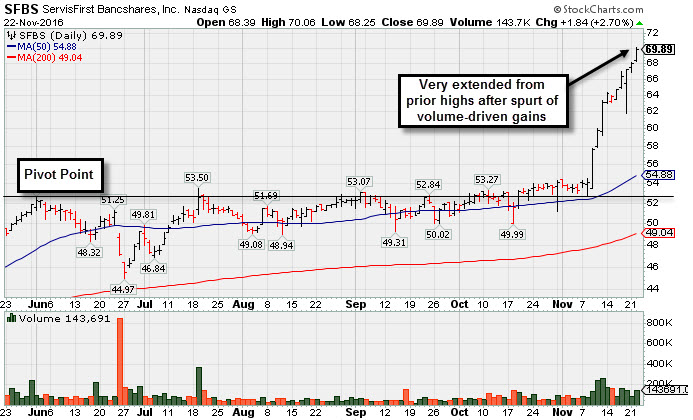
Very Extended From Prior Base Following Post-Election Gains - Tuesday, November 22, 2016
ServisFirst Bancshares Inc (SFBS +$1.84 or +2.70% to $69.89) hit yet another new all-time high today, adding to a spurt of volume-driven gains and getting very extended from its prior base. It got a burst of momentum along with many other Financial stocks following the election, rallying considerably since last shown in this FSU section on 11/07/16 with an annotated graph under the headline, "Relative Strength Improved as Bullish Action Has Continued". It was recently noted that its 10/31/16 gain backed by +52% above average volume helped reconfirm a technical buy signal. Since 9/22/16 its Relative Strength Rating has improved from 74 to 94, well above the 80+ minimum guideline for buy candidates under the fact-based investment system.
SFBS reported earnings +28% on +18% sales revenues for the Sep '16 quarter, its 4th consecutive quarterly comparison above the +25% minimum earnings guideline (C criteria), helping it match the fact-based investment system's guidelines. Earnings rose +28%, +34%, and +31% in the Dec '15, Mar and Jun '16 quarters, respectively, and underlying sales revenues growth has been in the +17-26% range. Its annual earnings (A criteria) history has been strong.
The number of top-rated funds owning its shares rose from 159 in Sep '15 to 231 in Sep '16, a reassuring sign concerning the I criteria. Its current Up/Down Volume Ratio of 1.5 is an unbiased indication its shares have been under accumulation over the past 50 days. Its small supply of only 23.1 million shares (S criteria) in the public float can contribute to greater price volatility in the event of institutional buying or selling.
Charts used courtesy of www.stockcharts.com
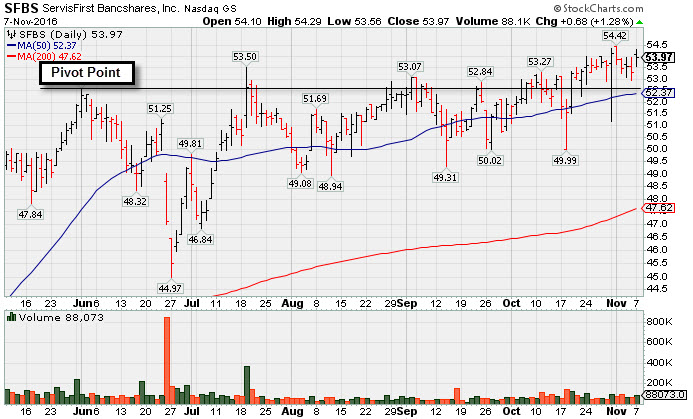
Relative Strength Improved as Bullish Action Has Continued - Monday, November 7, 2016
ServisFirst Bancshares Inc (SFBS +$0.68 or +1.28% to $53.97) posted a gain today with above average volume for its second best close ever. It was recently noted that its 10/31/16 gain backed by +52% above average volume helped reconfirm a technical buy signal. It found support after briefly undercutting its 50-day moving average (DMA) line. More damaging losses would raise concerns.
Since last shown in this FSU section on 9/22/16 with an annotated graph under the headline, "Relative Strength Rating is Under Guidelines While Perched Near Highs". its Relative Strength Rating has improved from 74 to 85, back above the 80+ minimum guideline for buy candidates under the fact-based investment system.
SFBS reported earnings +28% on +18% sales revenues for the Sep '16 quarter, its 4th consecutive quarterly comparison above the +25% minimum earnings guideline (C criteria), helping it match the fact-based investment system's guidelines. Earnings rose +28%, +34%, and +31% in the Dec '15, Mar and Jun '16 quarters, respectively, and underlying sales revenues growth has been in the +17-26% range. Its annual earnings (A criteria) history has been strong.
The number of top-rated funds owning its shares rose from 159 in Sep '15 to 231 in Sep '16, a reassuring sign concerning the I criteria. Its current Up/Down Volume Ratio of 1.0 is an unbiased indication its shares have been essentially neutral in terms of accumulation/distribution over the past 50 days. Its small supply of only 23.1 million shares (S criteria) in the public float can contribute to greater price volatility in the event of institutional buying or selling.
Charts used courtesy of www.stockcharts.com
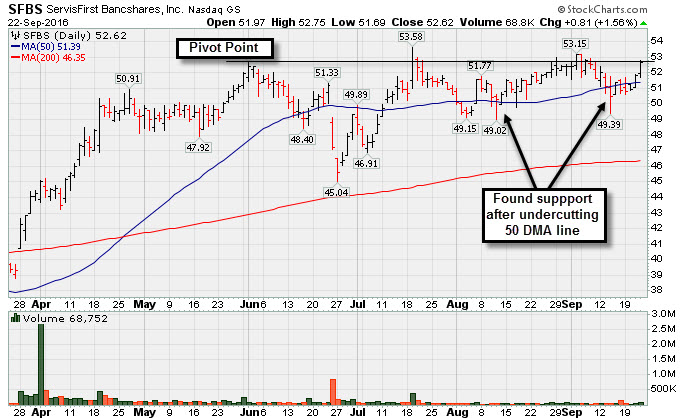
Relative Strength Rating is Under Guidelines While Perched Near Highs - Thursday, September 22, 2016
ServisFirst Bancshares Inc (SFBS +$0.81 or +1.56% to $52.62) rose within close striking distance of its 52-week high with its gain on Thursday. A new pivot point might be cited based on its 7/19/16 high, however, it has made little headway in recent months and its Relative Strength Rating has slumped to a 74 currently, below the 80+ minimum guideline for buy candidates under the fact-based investment system.
It was last shown in this FSU section on 8/25/16 with an annotated graph under the headline, "Still Consolidating Within Close Striking Distance of New Highs". SFBS reported earnings +31% on +17% sales revenues for the Jun '16 quarter, its 3rd consecutive quarterly comparison above the +25% minimum earnings guideline (C criteria), helping it better match the fact-based investment system's guidelines. Earnings rose +28% and +34% in the Dec '15 and Mar '16 quarters, respectively, and underlying sales revenues growth has been in the +17-26% range. Its annual earnings (A criteria) history has been strong.
The number of top-rated funds owning its shares rose from 159 in Sep '15 to 233 in Jun '16, a reassuring sign concerning the I criteria. Its current Up/Down Volume Ratio of 1.1 is an unbiased indication its shares have been only under slight accumulation over the past 50 days. Its small supply of only 23.1 million shares (S criteria) in the public float can contribute to greater price volatility in the event of institutional buying or selling.
Charts used courtesy of www.stockcharts.com
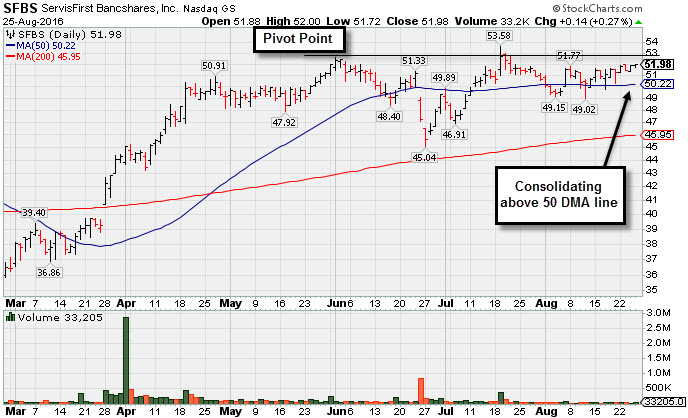
Still Consolidating Within Close Striking Distance of New Highs - Thursday, August 25, 2016
SFBS +$0.14 or +0.27% to $51.98) is still quietly consolidating above its 50-day moving average (DMA) line ($50.24). Without proof of fresh institutional buying demand there is little reason to believe a sustained and meaningful advance in price is likely. Members were previously reminded - "A volume-driven gain and strong close above the pivot point are needed to clinch a convincing technical buy signal. It has been quietly consolidating since highlighted in yellow in the 7/19/16 mid-day report with pivot point cited based on the 6/01/16 high plus 10 cents. "
It was last shown in this FSU section on 7/20/16 with an annotated graph under the headline, "Meeting Resistance Near Prior Highs". It was highlighted in yellow with pivot point cited based on the 6/01/16 high plus 10 cents. SFBS reported earnings +31% on +17% sales revenues for the Jun '16 quarter, its 3rd consecutive quarterly comparison above the +25% minimum earnings guideline (C criteria), helping it better match the fact-based investment system's guidelines. Earnings rose +28% and +34% in the Dec '15 and Mar '16 quarters, respectively, and underlying sales revenues growth has been in the +17-26% range. Its annual earnings (A criteria) history has been strong.
The number of top-rated funds owning its shares rose from 159 in Sep '15 to 228 in Jun '16, a reassuring sign concerning the I criteria. Its current Up/Down Volume Ratio of 1.1 is an unbiased indication its shares have been only under slight accumulation over the past 50 days. Its small supply of only 23.1 million shares (S criteria) in the public float can contribute to greater price volatility in the event of institutional buying or selling.
Charts used courtesy of www.stockcharts.com
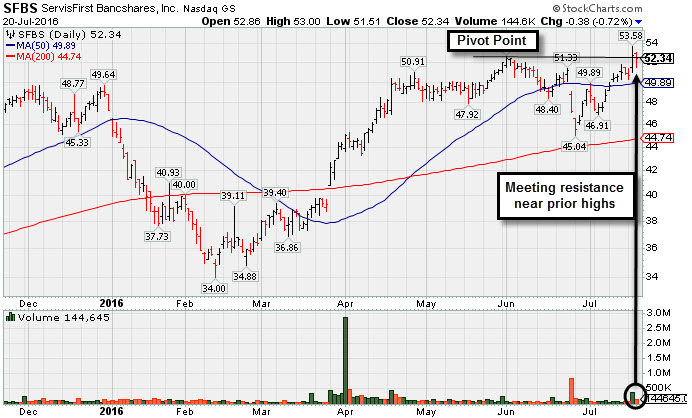
Meeting Resistance Near Prior Highs - Wednesday, July 20, 2016
SFBS -$0.38 or -0.72% to $52.34) churned above average volume today without making price progress, a sign of distributional pressure. It finished near its prior high and pivot point with a big volume-driven gain on the prior session after highlighted in yellow with pivot point cited based on the 6/01/16 high plus 10 cents. A volume-driven gain for new highs (N criteria) and a strong close above the pivot point may help clinch a convincing technical buy signal. Without proof of fresh institutional buying demand there is less reason to believe a sustained and meaningful advance in price is likely.
SFBS reported earnings +31% on +17% sales revenues for the Jun '16 quarter, its 3rd consecutive quarterly comparison above the +25% minimum earnings guideline (C criteria), helping it better match the fact-based investment system's guidelines. Earnings rose +28% and +34% in the Dec '15 and Mar '16 quarters, respectively, and underlying sales revenues growth has been in the +17-26% range. Its annual earnings (A criteria) history has been strong.
The number of top-rated funds owning its shares rose from 159 in Sep '15 to 228 in Jun '16, a reassuring sign concerning the I criteria. Its current Up/Down Volume Ratio of 1.4 is an unbiased indication its shares have been under accumulation over the past 50 days. Its small supply of only 23.1 million shares (S criteria) in the public float can contribute to greater price volatility in the event of institutional buying or selling.
Charts used courtesy of www.stockcharts.com