Fourth Loss Following "Negative Reversal" at All-Time High - Monday, February 14, 2022
Formed Double Bottom Base and Faces Little Resistance - Thursday, January 27, 2022
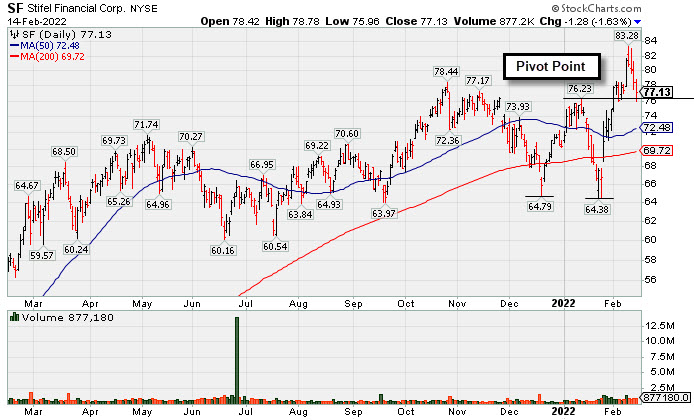
Fourth Loss Following "Negative Reversal" at All-Time High - Monday, February 14, 2022
Stifel Financial Corp (SF -$1.28 or -1.63% to $77.13) pulled back today for a 4th consecutive volume-driven loss after a "negative reversal" at its 52-week high. Its color code was changed to yellow after pulling back below its "max buy" level. Prior highs in the $76-78 area define initial support to watch above its 50-day moving average (DMA) line ($72.48).
SF was highlighted in yellow with pivot point cited based on its 1/12/22 high in the 1/27/22 mid-day report (read here) while building on a "double bottom" base. It was shown in greater detail that evening with an annotated graph under the headline, "Formed Double Bottom Base and Faces Little Resistance". Since then a noted follow-through day in the market (M criteria) to confirm a new uptrend and subsequent gains above the stock's pivot point backed by at least +40% above average volume triggered a technical buy signal.
It has a 98 Earnings Per Share Rating, well above the 80+ minimum guideline for buy candidates. It reported strong results above the +25% minimum guideline (C criteria). in the past 5 quarterly comparisons through Dec '21 versus the year ago period. Annual earnings (A criteria) history has been good.
It hails from the FINANCIAL SERVICES - Investment Brokerage - Regional industry group which is currently ranked 43rd on the 197 Industry Groups list. There are 104.3 million shares outstanding (S criteria). The number of top-rated funds owning its shares rose from 601 in Mar '21 to 623 in Dec '21. Its current Up/Down Volume Ratio of 1.1 is an unbiased indication its shares have been under slight accumulation over the past 50 days. It has a Timeliness Rating of A and Sponsorship Rating of C.
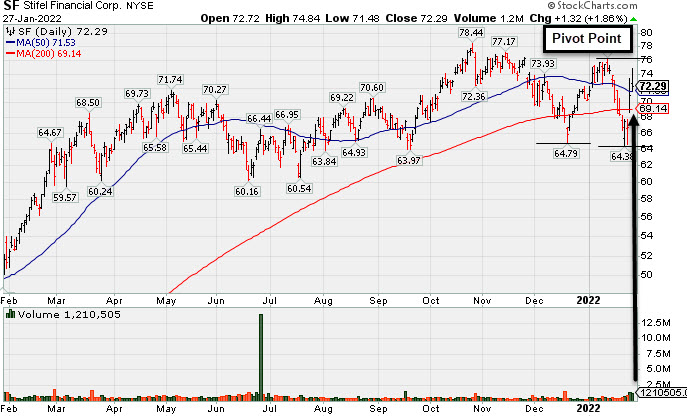
Formed Double Bottom Base and Faces Little Resistance - Thursday, January 27, 2022
Stifel Financial Corp (SF +$1.32 or +1.86% to $72.29) was highlighted in yellow with pivot point cited based on its 1/12/22 high in the earlier mid-day report while building on a "double bottom" base. Disciplined investors will wait for a noted follow-through day in the market (M criteria) to confirm a new uptrend. Subsequent gains above the stock's pivot point backed by at least +40% above average volume are needed to trigger a proper technical buy signal. It has been rebounding toward its all-time high with 2 consecutive volume-driven gains after again briefly undercutting its 200-day moving average (DMA) line.
It has a 98 Earnings Per Share Rating, well above the 80+ minimum guideline for buy candidates. It reported strong results above the +25% minimum guideline (C criteria). in the past 5 quarterly comparisons through Dec '21 versus the year ago period. Annual earnings (A criteria) history has been good.
It hails from the FINANCIAL SERVICES - Investment Brokerage - Regional industry group which is currently ranked 51st on the 197 Industry Groups list. There are 104.3 million shares outstanding (S criteria). The number of top-rated funds owning its shares rose from 601 in Mar '21 to 613 in Dec '21. Its current Up/Down Volume Ratio of 0.8 is an unbiased indication its shares have been under distributional pressure over the past 50 days. It has a Timeliness Rating of B and Sponsorship Rating of C.