Quickly Rallied Following Strong Earnings News - Thursday, May 10, 2018
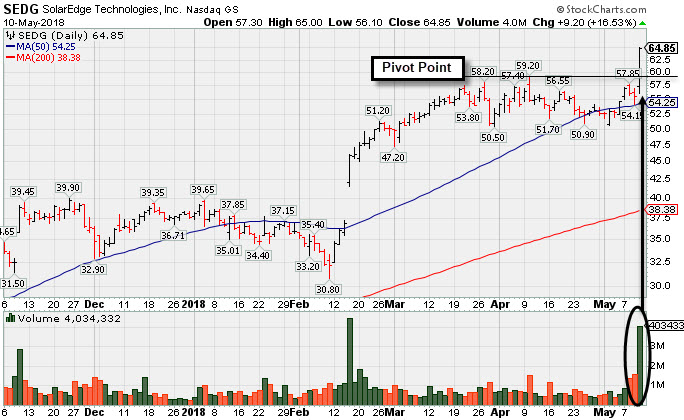
Solaredge Technologies (SEDG +$9.20 or +16.53% to $64.85) rallied for a considerable gain with +466% above average volume hitting a new all-time high (N criteria). Bullish action came after it reported earnings +142% on +82% sales revenues for the Mar '18 quarter, continuing its strong track record. It quickly rallied above the "max buy" level and its color code was changed to green. Disciplined investors avoid chasing stocks more than +5% above the prior high or pivot point.
SEDG was highlighted in yellow with pivot point cited based on its 4/10/18 high plus 10 cents in the prior mid-day report (read here) and noted - "Subsequent gains above the pivot point backed by at least +40% above average volume are needed to trigger a technical buy signal. Last noted in the 4/16/18 mid-day reports - 'This Israel-based Energy - Solar firm had a "breakaway gap" for a considerable volume-driven gain on 2/15/18 and tallied additional volume driven gains for new all-time highs. Bullish action came after it reported Dec '17 earnings +166% on +70% sales revenues, its 3rd consecutive quarterly comparison with earnings above the +25% minimum guideline (C criteria) with a great acceleration in its sales revenues growth rate. Disciplined investors may wait for a new base or secondary buy point to possibly develop and be noted in the weeks ahead.'"
It has earned the highest possible 99 Earnings Per Share Rating. After years of losses it generated strong annual earnings (A criteria) growth of $1.33 per share in FY '15, $1.72 per share in FY '16, and $2.43 per share in FY '17. The number of top-rated funds owning its shares rose from 150 in Jun '17 to 305 in Mar '18, a reassuring sign concerning the I criteria. The small supply of 34.2 million shares (S criteria) in the public float can contribute to greater price volatility in the event of institutional buying or selling.
Charts courtesy of www.stockcharts.com