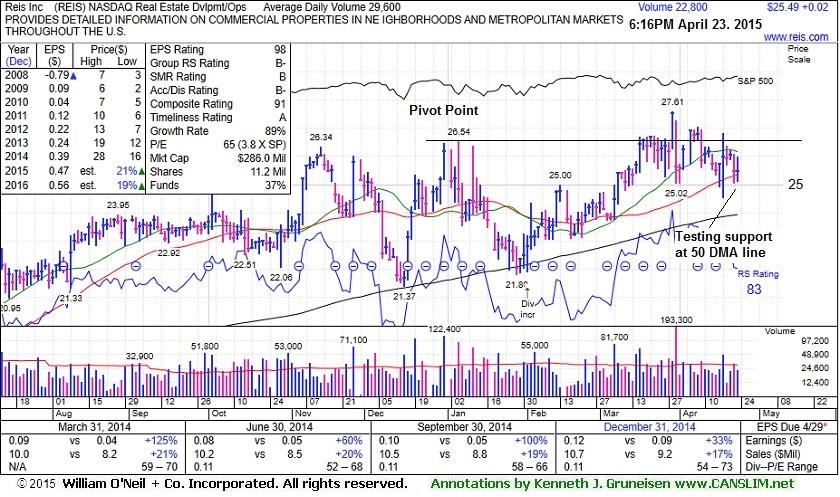
Reis Inc (REIS +$0.02 or +0.08% to $25.49) has been testing support at its 50-day moving average (DMA) line ($25.36). Little resistance remains due to overhead supply. Members were repeatedly reminded - "Gains above the pivot point must have at least +40% above average volume to trigger a convincing technical buy signal."
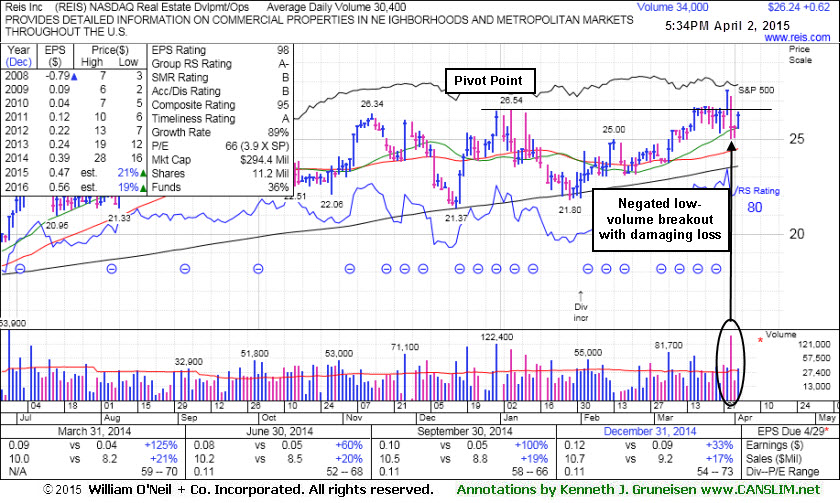
REIS was last shown in this FSU section with annotated graphs on 4/02/15 under the headline, "Encountered Distributional Pressure Following Breakout Lacking Volume". Action was noted as distributional pressure as it suffered a big loss on 5 times average volume on 3/31/15. It hit a new 52-week high and rallied above its pivot point on the prior session, but the volume was only +28% above average. Members were reminded - "Gains above the pivot point must have at least +40% above average volume to trigger a convincing technical buy signal." Pyramiding is a tactic taught in the Certification that allows investors to let market action help to dictate entries and weighting into each new position purchased.
On 3/16/15 it was highlighted in yellow in the mid-day (read here). It had earnings increases above the +25% minimum guideline (C criteria) and sales revenues improving in the Mar, Jun, Sep, and Dec '14 quarterly comparisons. Annual earnings (A criteria) history has been improving steadily since FY '10.
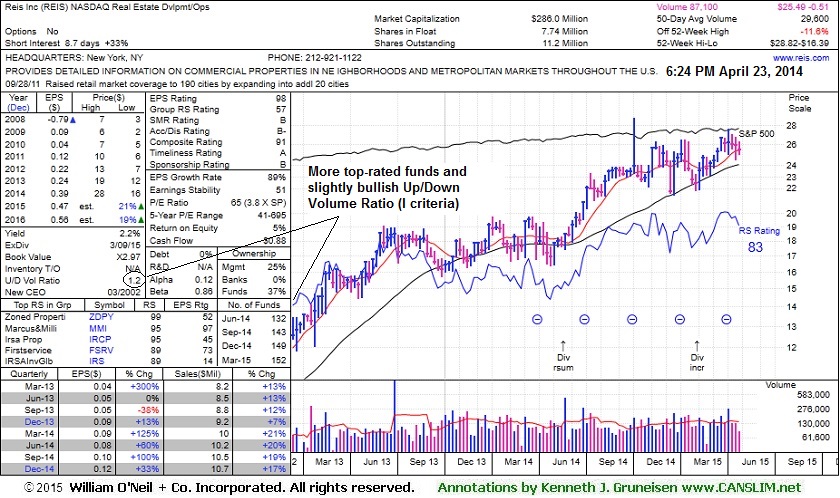
The high-ranked Real Estate Development/Operations firm has an Up/Down Volume Ratio of 1.2 which is an unbiased indication its shares have been under accumulation over the past 50 days. The number of top-rated funds owning its shares rose from 117 in Mar '14 to 152 in Mar '15, a reassuring sign concerning the I criteria.
Reis Inc (REIS +$0.62 or +2.42% to $26.24) posted a gain on higher (near average) volume today. Recent action was noted as distributional pressure as it suffered a big loss on 5 times average volume on 3/31/15. It hit a new 52-week high and rallied above its pivot point on the prior session, but the volume was only +28% above average. Members were reminded - "Gains above the pivot point must have at least +40% above average volume to trigger a convincing technical buy signal." Pyramiding is a tactic taught in the Certification that allows investors to let market action help to dictate entries and weighting into each new position purchased.
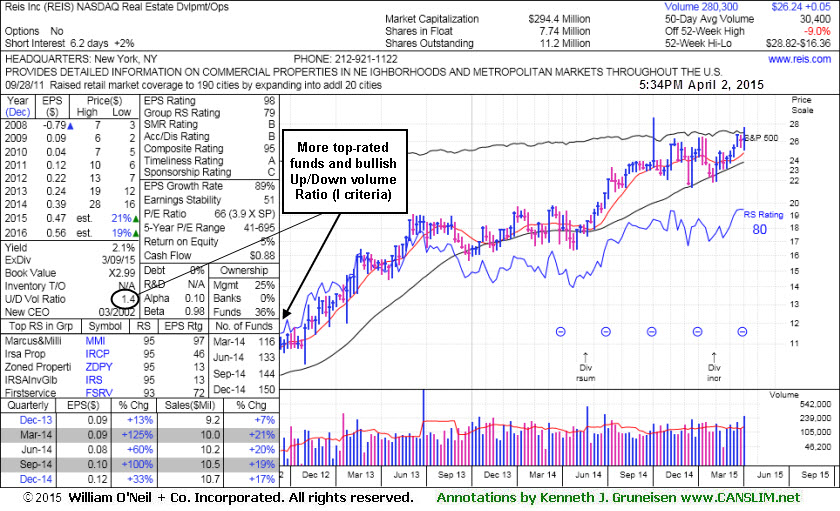
REIS was last shown in this FSU section with annotated graphs on 3/16/15 under the headline, "Found Support at Long-Term Average and Fundamentals Are Good", after highlighted in yellow in the mid-day (read here).
It found support at its 200-day moving average (DMA) line during its consolidation. It had earnings increases above the +25% minimum guideline (C criteria) and sales revenues improving in the Mar, Jun, Sep, and Dec '14 quarterly comparisons. Annual earnings (A criteria) history has been improving steadily since FY '10.
The high-ranked Real Estate Development/Operations firm has an Up/Down Volume Ratio of 1.4 which is an unbiased indication its shares have been under accumulation over the past 50 days. The number of top-rated funds owning its shares rose from 117 in Mar '14 to 150 in Dec '14, a reassuring sign concerning the I criteria.
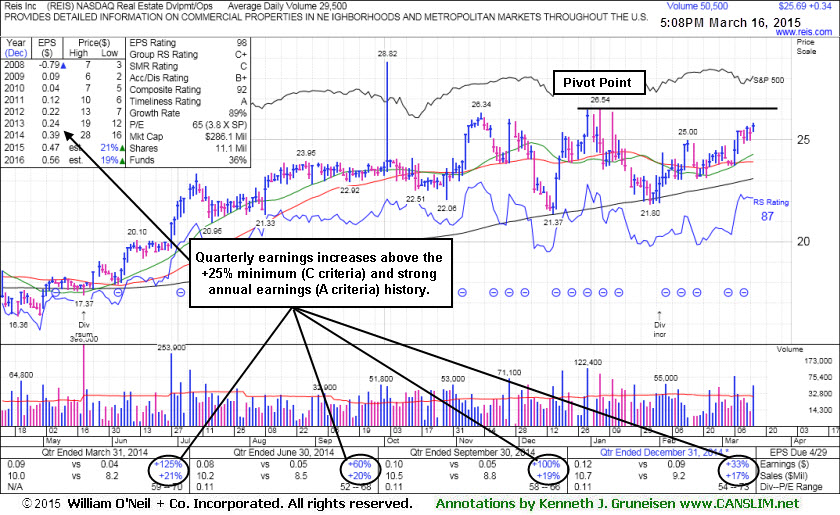
Reis Inc (REIS +$0.34 or +1.34% to $25.69) was highlighted in yellow with pivot point cited based on its 1/06/15 high plus 10 cents in the earlier mid-day (read here). Subsequent volume-driven gains above the pivot point are still needed to trigger a technical buy signal. It ended today's session with a volume-driven gain leaving it within striking distance of a best-ever close and near its 52-week high.
It found support at its 200-day moving average (DMA) line during its consolidation. It had earnings increases above the +25% minimum guideline (C criteria) and sales revenues improving in the Mar, Jun, Sep, and Dec '14 quarterly comparisons. Annual earnings (A criteria) history has been improving steadily since FY '10.
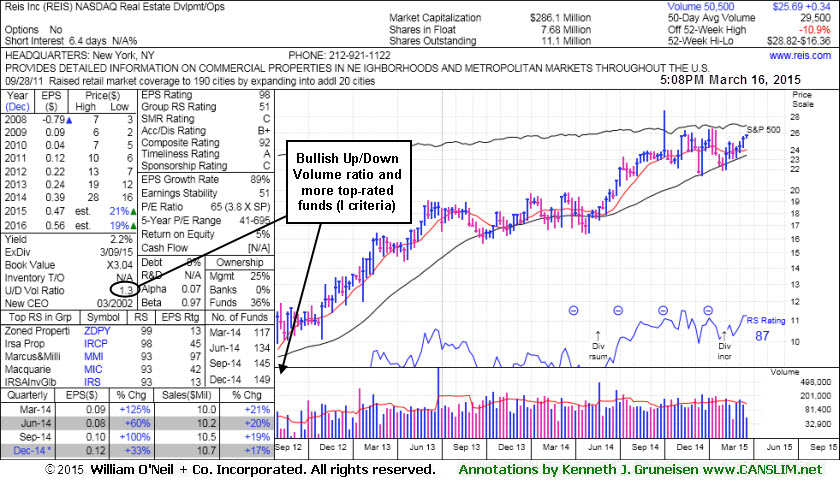
The high-ranked Real Estate Development/Operations firm has an Up/Down Volume Ratio of 1.3 which is an unbiased indication its shares have been under accumulation over the past 50 days. The number of top-rated funds owning its shares rose from 117 in Mar '14 to 149 in Dec '14, a reassuring sign concerning the I criteria.