Rackspace Hosting Inc (RAX -$0.52 or -0.69% to $75.12) is consolidating above important support at its multi-month upward trendline and its 50-day moving average (DMA) line shown virtually coinciding with each other on the annotated graph below. That defines important chart support to watch above prior highs in the $70 area, where any violations may trigger technical sell signals. Experienced investors know that volume and volatility often increase near earnings news. It was recently noted with caution - "It is extended from the previously noted base. Company will announce its fourth quarter 2012 financial results on Tuesday, February 12, 2013 after the close."
RAX tallied an additional volume-driven gain for a new high two days after it was last shown in this FSU section with an annotated graph on 1/22/13 under the headline, "Pulled Back After Getting Extended Following Technical Breakout". It reported earnings +36% on +27% sales revenues for the quarter ended September 30, 2012 versus the year ago period and its fundamentals remain strong. The past 11 quarterly earnings comparisons have shown better than +25% increases (C criteria). Its annual earnings history (A criteria) since trading began in 2008 has been good. Increasing institutional ownership (I criteria) is a reassuring sign, as the number of top-rated funds owning its shares rose from 408 in Dec '10 to 656 in Dec '12.

Rackspace Hosting Inc (RAX -$1.22 or -1.57% to $76.56) pulled back today with higher volume but not heavy volume, retreating from its all-time high. It is extended from its prior base, and it was previously noted "Prior highs in the $70 area define initial support to watch." It was last shown in this FSU section on 1/08/12 with an annotated graph under the headline, "Unhindered by Overhead Supply, But Extended From Prior Base", as we reminded members - "Disciplined investors avoid chasing extended stocks more than +5% above their pivot point. Making sloppy buy decisions by chasing extended stocks invites a much greater chance that an ordinary consolidation might prompt investors to invoke the investment system's strict loss-limiting sell rule after a pullback of -7% or more from their purchase price."
It reported earnings +36% on +27% sales revenues for the quarter ended September 30, 2012 versus the year ago period and its fundamentals remain strong. The past 11 quarterly earnings comparisons have shown better than +25% increases (C criteria). Its annual earnings history (A criteria) since trading began in 2008 has been good. Increasing institutional ownership (I criteria) is a reassuring sign, as the number of top-rated funds owning its shares rose from 408 in Dec '10 to 653 in Dec '12.
Rackspace Hosting Inc (RAX +$3.89 or +5.67% to $72.44) finished at the session high and an all-time high with today's gain on average volume. It is extended from its prior base, meanwhile prior highs in the $70 area define initial support to watch. Disciplined investors avoid chasing extended stocks more than +5% above their pivot point. Making sloppy buy decisions by chasing extended stocks invites a much greater chance that an ordinary consolidation might prompt investors to invoke the investment system's strict loss-limiting sell rule after a pullback of -7% or more from their purchase price.
It reported earnings +36% on +27% sales revenues for the quarter ended September 30, 2012 versus the year ago period and its fundamentals remain strong. The past 11 quarterly earnings comparisons have shown better than +25% increases (C criteria). Its annual earnings history (A criteria) since trading began in 2008 has been good. Increasing institutional ownership (I criteria) is a reassuring sign, as the number of top-rated funds owning its shares rose from 408 in Dec '10 to 651 in Dec '12.
RAX has rallied unhindered by resistance due to overhead supply since last shown in this FSU section on 12/18/12 with an annotated graph under the headline, "Volume-Driven Gain Above New Pivot Point Triggered Technical Buy Signal". It had hit a new 52-week high with a solid gain backed by +142% above average volume. Its strong close above the new pivot point cited based on its 11/29/12 high plus 10 cents clinched a new (or add-on) technical buy signal as we observed - "There is no assurance that it will go on to produce great gains now, but the volume-driven gain above the latest pivot is a convincing sign that it may be capable of a more substantial rally in the weeks and months ahead."
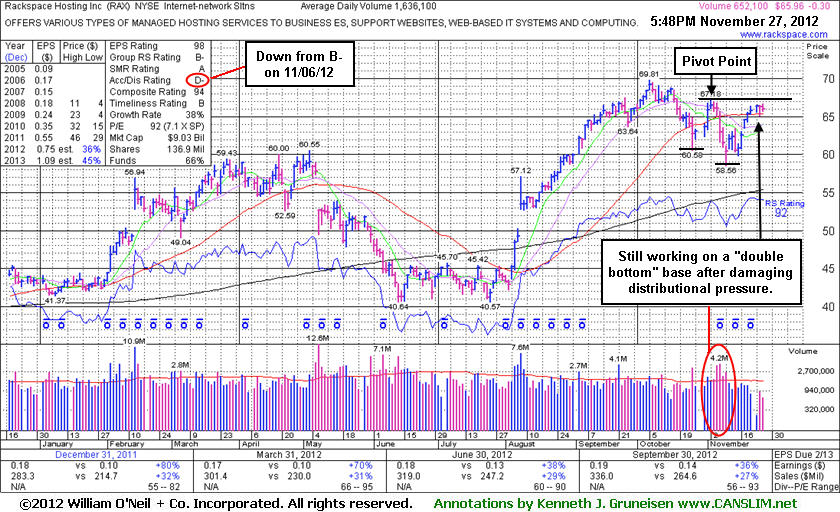
It was last shown in this FSU section on 11/27/12 with an annotated graph under the headline, "Set-Up Awaiting Confirming Gains Above New Pivot Point", while quietly consolidating after rebounding just above its 50-day moving average (DMA) line and working on a "double bottom" base. A recent streak of 10 consecutive weekly gains had helped it rebound impressively from below its 200 DMA line following a deep consolidation since dropped from the Featured Stocks list on 5/14/12. Subsequent gains above its pivot point did not have the necessary volume to trigger a new technical buy signal, however, as prior coverage cautioned members - "It makes sense to wait and watch for proof of fresh institutional buying demand to trigger a proper technical buy signal rather than jumping in early."
It reported earnings +36% on +27% sales revenues for the quarter ended September 30, 2012 versus the year ago period and its fundamentals remain strong. The past 11 quarterly earnings comparisons have shown better than +25% increases. Its annual earnings history (A criteria) since trading began in 2008 has been good. Increasing institutional ownership (I criteria) is a reassuring sign, as the number of top-rated funds owning its shares rose from 408 in Dec '10 to 652 in Sep '12.
RAX found support near prior highs in the $60 area recently after undercutting its 50 DMA line more substantially. It reported earnings +36% on +27% sales revenues for the quarter ended September 30, 2012 versus the year ago period and its fundamentals remain strong. The past 11 quarterly earnings comparisons have shown better than +25% increases. Its annual earnings history (A criteria) since trading began in 2008 has been good. Increasing institutional ownership (I criteria) is a reassuring sign, as the number of top-rated funds owning its shares rose from 408 in Dec '10 to 634 in Sep '12. A recent streak of 10 consecutive weekly gains helped it rebound impressively from below its 200 DMA line following a deep consolidation since dropped from the Featured Stocks list on 5/14/12.
Often, when a leading stock is setting up with a solid base it is highlighted in CANSLIM.net's Mid-Day Breakouts Report. The most relevant factors are noted in the report which alerts prudent CANSLIM oriented investors. After doing any necessary backup research, the investor is prepared to act after the stock triggers a technical buy signal (breaks above its pivot point on more than +50% average turnover) but before it gets too extended from a sound base. Disciplined investors know to buy as near as possible to the pivot point and avoid chasing stocks after they have rallied more than +5% above their pivot point. It is crucial to always limit losses whenever any stock heads the wrong direction, and disciplined investors sell if a struggling stock ever falls more than -7% from their purchase price. In the event the stock fails to trigger a technical buy signal no harm is done, and it would simply be dropped from investors' watchlists.
Rackspace Hosting Inc (RAX -$0.03 or -0.05% to $66.08) was highlighted in yellow with new pivot point cited based on its 10/05/12 high plus 10 cents in the mid-day report (read
here) as it was noted - "A volume-driven gain above its pivot point may trigger a new technical buy signal. Found support near prior highs in the $60 area recently after briefly undercutting its 50 DMA line. Fundamentals (C and A criteria) remain strong. A recent streak of 10 consecutive weekly gains helped it rebound impressively from below its 200 DMA line following a deep consolidation since dropped from the Featured Stocks list on 5/14/12. " After the close it reported earnings +36% on +27% sales revenues for the quarter ended September 30, 2012 versus the year ago period. Volume and volatility often increase near earnings news.Its last appearance in this FSU section was on 4/10/12 with an annotated graph under the headline, "Consolidating Above 50-Day Moving Average Line ". Damaging losses afterward had triggered technical sell signals, however it eventually rebounded and strength returned allowing it to rally back into new high territory. The past 11 quarterly earnings comparisons through September '12 have shown better than +25% increases. Its annual earnings history (A criteria) since trading began in 2008 has been good. Increasing institutional ownership (I criteria) is a reassuring sign, as the number of top-rated funds owning its shares rose from 408 in Dec '10 to 609 in Sep '12. Keep in mind that currently the M criteria is an overriding concern, until at least one of the major averages produces a solid follow-through day confirming a new rally for the broader market.
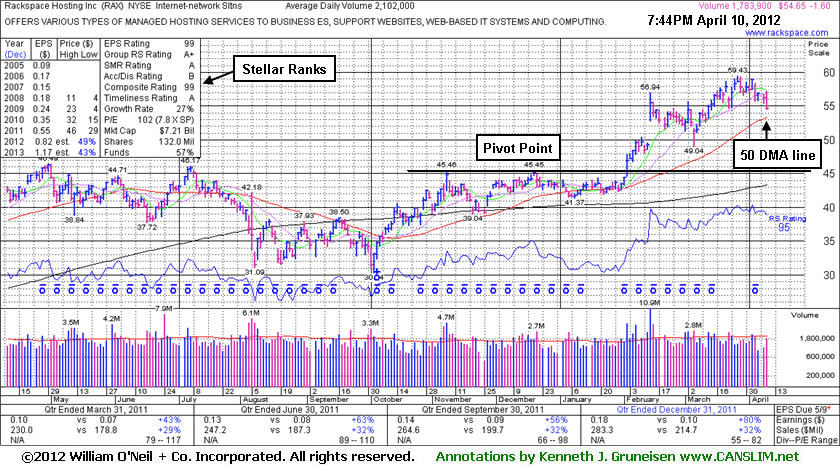
Rackspace Hosting Inc (RAX -$1.60 or -2.84% to $54.65) pulled back again today with higher (near average) volume. It remains extended from its prior base. Its 50-day moving average (DMA) line ($53.37) defines important near-term support to watch. Stocks that stay above their 50 DMA line while consolidating are considered to be in healthy shape. When that short-term average is violated, concerns grow greater that the institutional crowd is selling, rather than accumulating, the stock in question. More damaging losses may trigger technical sell signals. Patient investors may still watch for secondary buy points to possibly develop and be noted. Meanwhile, disciplined investors know to avoid chasing extended stocks.
Its last appearance in this FSU section was on 2/16/12 with an annotated graph under the headline, "Strong Earnings Increase Led to Bullish Gap Up Gain", as it was holding its ground, extended from the previously noted base. There was a considerable gap up gain with very heavy volume on 2/14/12 for a new all-time high after it reported earnings +80% on +32% sales revenues for the quarter ended December 31, 2011 versus the year ago period. In more recent weeks it "wedged" to new high territory without great volume conviction behind its gains.
The past 8 quarterly earnings comparisons through December '11 have shown better than +25% increases. Its annual earnings history (A criteria) since trading began in 2008 has been good. Increasing institutional ownership (I criteria) is a reassuring sign, as the number of top-rated funds owning its shares rose from 408 in Dec '10 to 520 in Dec '11.
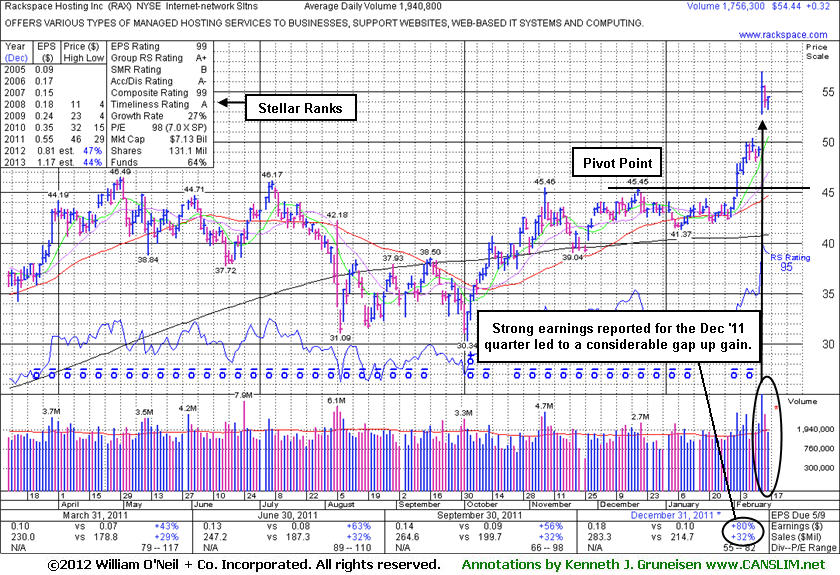
Rackspace Hosting Inc (RAX +$0.32 or +0.59% to $54.44) is holding its ground, extended from the previously noted base. There was a considerable gap up gain with very heavy volume on 2/14/12 for a new all-time high after it reported earnings +80% on +32% sales revenues for the quarter ended December 31, 2011 versus the year ago period. Patient investors may watch for secondary buy points to possibly develop and be noted. Meanwhile, disciplined investors know to avoid chasing extended stocks. The nearest chart support is defined by its prior highs and its 50-day moving average (DMA) line.
After its last appearance in this FSU section on 1/05/12 with an annotated graph under the headline, "Sell Signal Triggered by Violation of 50-Day Average on Higher Volume", it continued to consolidate in the neighborhood of its 50-day moving average (DMA) line. Cautionary comments had warned members - "Disciplined investors should watch for it to first prove that there is truly strong buying demand lurking from institutional investors, otherwise a sustained and meaningful advance is considered unlikely." It eventually cleared a new pivot point cited on 2/02/12 as it gapped up and technically broke out of a flat base pattern. The past 8 quarterly earnings comparisons through December '11 have shown better than +25% increases. Its annual earnings history (A criteria) since trading began in 2008 has been good. Increasing institutional ownership (I criteria) is a reassuring sign, as the number of top-rated funds owning its shares rose from 408 in Dec '10 to 520 in Dec '11.
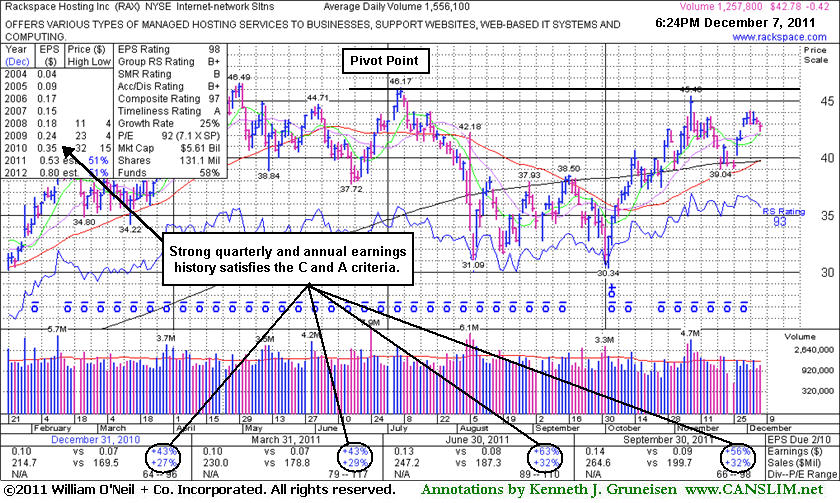
Following its last appearance in this FSU section was on 12/07/11 with an annotated weekly graph under the headline, "Little Resistance Remains But Proof of Fresh Demand is Needed", it wedged higher without especially great volume conviction and it challenged previously stubborn resistance. However, it failed to attract heavy buying demand while perched within close striking distance of its 52-week and all-time high. Obviously, a volume-driven gain did not trigger a technical buy signal. Cautionary comments had warned members - "Disciplined investors should watch for it to first prove that there is truly strong buying demand lurking from institutional investors, otherwise a sustained and meaningful advance is considered unlikely."
The past 7 quarterly earnings comparisons through September '11 have shown better than +25% increases. Its annual earnings history (A criteria) since trading began in 2008 has been good. Increasing institutional ownership (I criteria) is a reassuring sign, as the number of top-rated funds owning its shares rose from 408 in Dec '10 to 479 in Sep '11.
A prompt repair of its 50 DMA violation would help its outlook, meanwhile the path of least resistance could lead it toward its 200 DMA line and prior chart lows which define the next near-term support areas to watch.
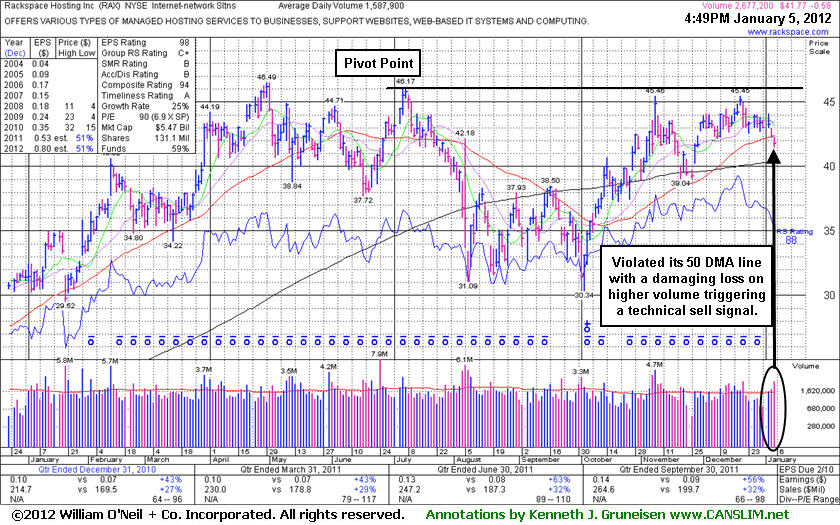
Rackspace Hosting Inc (RAX -$0.42 or -0.97% to $42.78) is quietly perched within close striking distance of its 52-week and all-time high. A volume-driven breakout may trigger a new technical buy signal. It found support near its closely coinciding 50-day and 200-day moving average (DMA) lines since its last appearance in this FSU section on 11/10/11 with an annotated weekly graph under the headline, "Encountering Distributional Pressure After 19-Week Cup Shaped Base ." Subsequent violations would trigger damaging technical sell signals. Little resistance remains due to overhead supply. Still, disciplined investors should watch for it to first prove that there is truly strong buying demand lurking from institutional investors, otherwise a sustained and meaningful advance is considered unlikely.
The past 4 quarterly earnings comparisons showed better than +25% increases. Its annual earnings history (A criteria) since trading began in 2008 has been good. Increasing institutional ownership (I criteria) is a reassuring sign, as the number of top-rated funds owning its shares rose from 407 in Dec '10 to 477 in Sep '11.
RAX traded up as much as +103.5% within 8 months of when it was featured in yellow in the 9/21/10 mid-day report (read here) when noted - "Trading pennies from its 52-week high, with no overhead supply remaining to hinder its progress. A solid gain on the prior session reconfirmed a recent technical breakout above prior chart highs. Subsequent gains into new high territory with volume conviction could signal the beginning of a meaningful price advance."
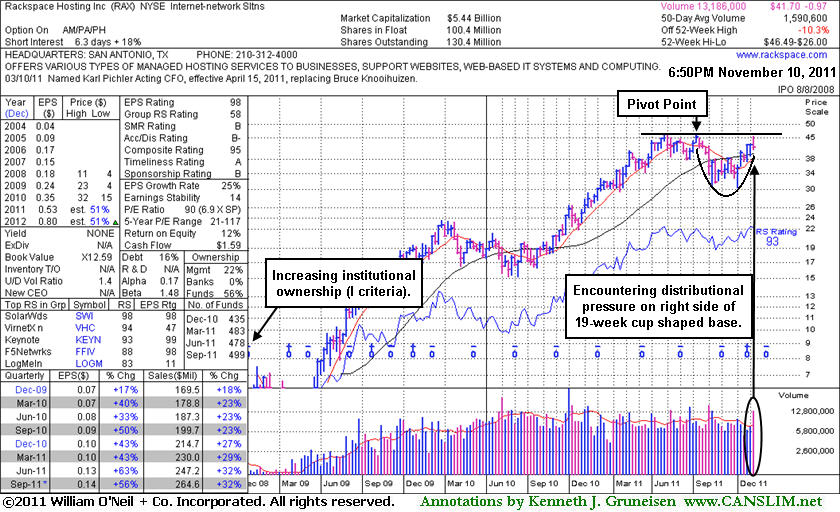
Rackspace Hosting Inc (RAX -$0.68 or -1.60% to $41.70) suffered a 3rd loss on above average volume in the span of 4 sessions. It was featured again in yellow in the 11/08/11 mid-day report (read here) with a pivot point based on its 7/07/11 high plus 10 cents. It was noted - "Volume-driven gains into new high ground may trigger a new technical buy signal. After dropped from the Featured Stocks list on 6/16/11 it rebounded near its 52-week high then slumped well below its 200 DMA line during a much deeper consolidation before rebounding again. It is now working on the right side of a 19-week cup shaped base with little overhead supply remaining to act as resistance." More damaging losses would raise greater concerns, of course. Meanwhile it has some additional work to do, and disciplined investors should watch for it to first prove that there is truly strong buying demand lurking from institutional investors, otherwise a sustained and meaningful advance is considered unlikely.
The past 4 quarterly earnings comparisons showed better than +25% increases. Its annual earnings history (A criteria) since trading began in 2008 has been good. Increasing institutional ownership (I criteria) is a reassuring sign, as the number of top-rated funds owning its shares rose from 435 in Dec '10 to 499 in Sep '11. Its last appearance in this FSU section was on 6/14/11 with an annotated graph under the headline, "Gains Lacking Volume Following 50 DMA Violation", and soon afterward on 6/16/11 it was noted - "Damaging loss today on above average volume violated the previously noted chart low ($38.84 on 5/12/11) triggering a more worrisome technical sell signal. Only a rebound above its 50 DMA line would help its outlook improve, technically. Based on its deterioration it will be dropped from the Featured Stocks list tonight." Then it rebounded to challenge its 52-week high before going through a much deeper correction below its 200-day moving average (DMA) line. In recent weeks it managed an impressive rebound and there is little resistance remaining due to overhead supply.
RAX traded up as much as +103.5% within 8 months of when it was featured in yellow in the 9/21/10 mid-day report (read here) when noted - "Trading pennies from its 52-week high, with no overhead supply remaining to hinder its progress. A solid gain on the prior session reconfirmed a recent technical breakout above prior chart highs. Subsequent gains into new high territory with volume conviction could signal the beginning of a meaningful price advance."
More damaging losses would raise greater concerns, meanwhile it has not formed a sound new base. The past 4 quarterly earnings comparisons showed better than +25% increases. Its annual earnings history (A criteria) since trading began in 2008 has been good. Increasing institutional ownership (I criteria) is a reassuring sign, as the number of top-rated funds owning its shares rose from 317 in Mar '10 to 480 in Mar '11. RAX traded up as much as +103.5% within 8 months of when it was featured in yellow in the 9/21/10 mid-day report (read here) when noted - "Trading pennies from its 52-week high, with no overhead supply remaining to hinder its progress. A solid gain on the prior session reconfirmed a recent technical breakout above prior chart highs. Subsequent gains into new high territory with volume conviction could signal the beginning of a meaningful price advance."
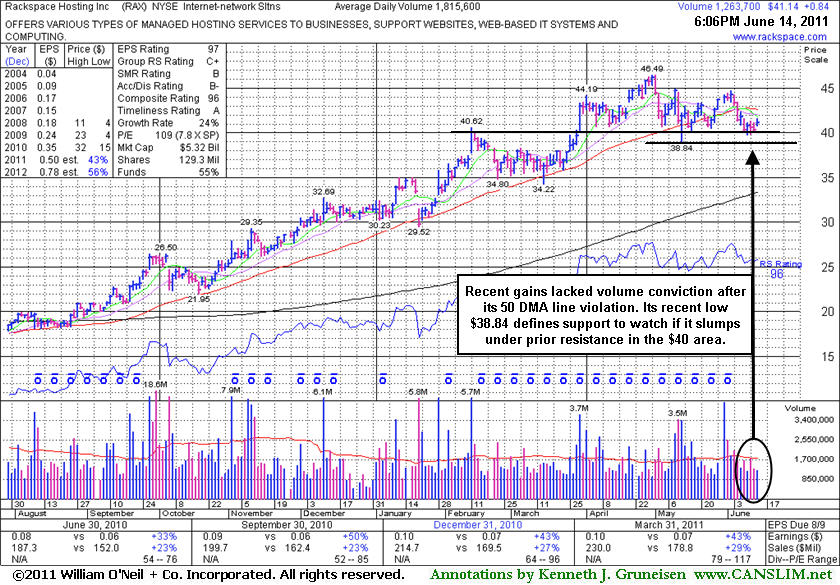
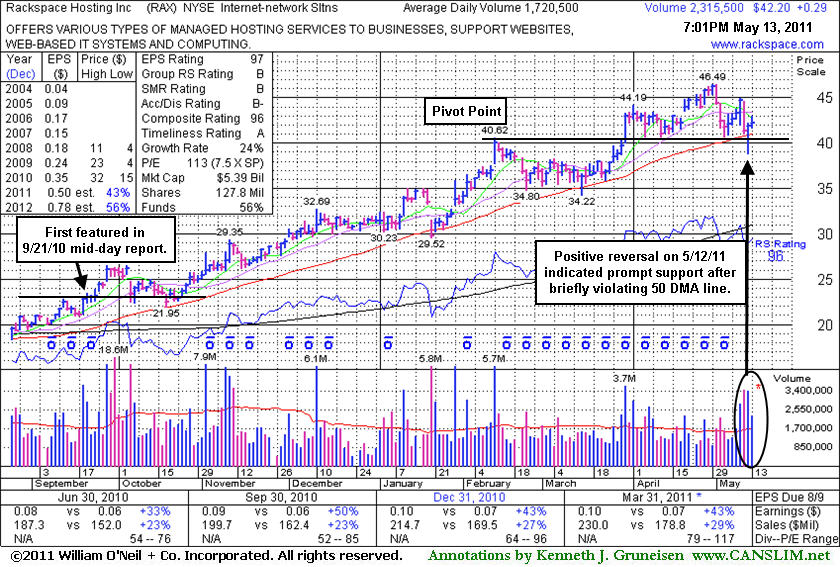
Rackspace Hosting Inc (RAX +$0.29 or +0.69% to $42.20) found prompt support and managed an impressive positive reversal on 5/12/11 after violating its 50-day moving average (DMA) line and undercutting prior highs near $40 with its early loss. More damaging losses would raise greater concerns, meanwhile it has not formed a sound new base. Since its last appearance in this FSU section on 4/18/11 under the headline, "High-Ranked Internet-Networking Solutions Firm Racked Up Big Gains", this high-ranked Internet-Networking Solutions firm had rallied to a new all-time high and then encountered distributional pressure. The above mentioned article noted - "The investment system permits investors to accumulate shares on light volume pullbacks, but research has proven that odds are best for a successful trade when buying is done as a stock is moving up in price rather than pulling back."
The past 4 quarterly earnings comparisons showed better than +25% increases. Its annual earnings history (A criteria) since trading began in 2008 has been good. Increasing institutional ownership (I criteria) is a reassuring sign, as the number of top-rated funds owning its shares rose from 317 in Mar '10 to 463 in Mar '11. RAX has traded up as much as +103.5% since first featured in yellow less than 8 months ago in the 9/21/10 mid-day report (read here) when noted - "Trading pennies from its 52-week high, with no overhead supply remaining to hinder its progress. A solid gain on the prior session reconfirmed a recent technical breakout above prior chart highs. Subsequent gains into new high territory with volume conviction could signal the beginning of a meaningful price advance."
This high-ranked Internet-Networking Solutions firm has earned very high ranks, and the past 4 quarterly earnings comparisons showed better than +25% increases. Its annual earnings history (A criteria) since trading began in 2008 has been good. Increasing institutional ownership (I criteria) is a reassuring sign, as the number of top-rated funds owning its shares rose from 317 in Mar '10 to 455 in Mar '11.
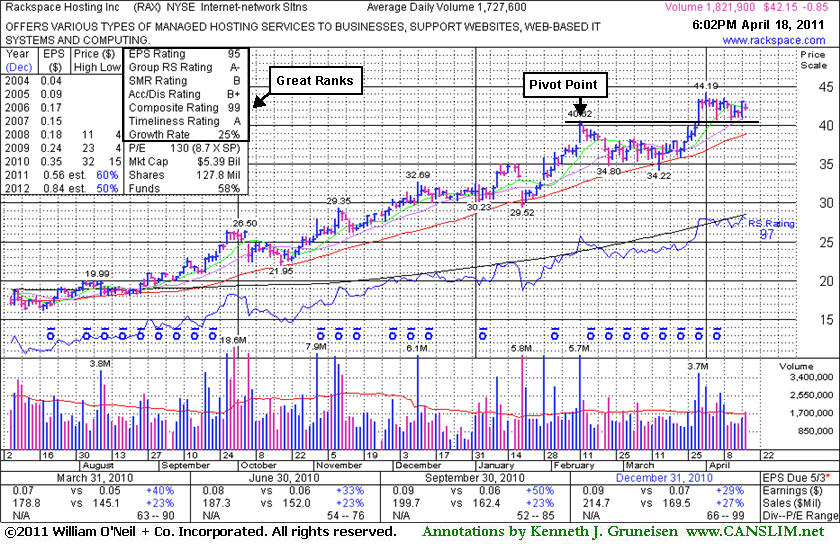
Rackspace Hosting Inc's (RAX -$0.85 or -1.98% to $42.15) volume totals were below average in the past week while consolidating above prior highs near $40 defining important chart support to watch above its 50-day moving average (DMA) line. The investment system permits investors to accumulate shares on light volume pullbacks, but research has proven that odds are best for a successful trade when buying is done as a stock is moving up in price rather than pulling back. Since its last appearance in this FSU section on 3/16/11 under the headline, "
New Flat Base Formed; Worst Concern Is Difficult Market Environment", it broke out with a powerful volume driven gain on 3/30/11 and has been consolidating in a healthy fashion.It has traded up as much as +93.5% since first featured in yellow in the 9/21/10 mid-day report (read here) when noted - "Trading pennies from its 52-week high, with no overhead supply remaining to hinder its progress. A solid gain on the prior session reconfirmed a recent technical breakout above prior chart highs. Subsequent gains into new high territory with volume conviction could signal the beginning of a meaningful price advance."
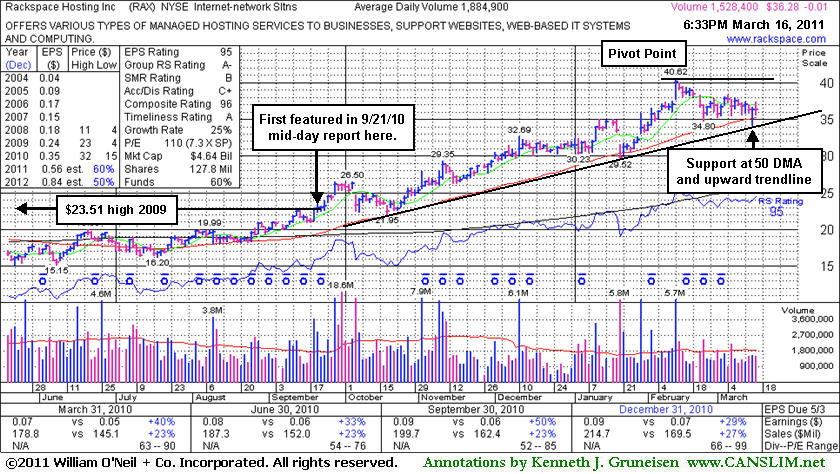
Rackspace Hosting Inc (RAX -$0.01 or -0.03% to $36.28) is consolidating above its 50-day moving average line amid widespread market weakness. Its upward trendline connecting its past October, January and March lows defines another technical support level to watch where violations may raise concerns and trigger technical sell signals. It has recently been noted while testing and its 50-day moving average (DMA) line defining chart support to watch closely coinciding with prior highs near $35. Since its last appearance in this FSU section on 2/09/11 under the headline "Weekly Graph Shows Stock Extended From Sound Base" it has been building a new base. As previously explained, it broke out on 1/11/11, triggering a new (or add-on) buy signal, however a damaging gap down on 1/20/11 likely forced disciplined investors to limit losses (per the sell rules at -7% from your purchase price) on any recent purchases.
Perched -10.7% below its all-time high now, some resistance remains due to recent overhead supply. Keep in mind that the M criteria of the fact-based investment system argues against new buying efforts until a new confirmed rally with a follow-through day from at least one of the major averages occurs. Meanwhile, it should remain on investors' watchlists as an ideal candidate for future consideration if it breaks out again with great volume conviction over the new pivot point being cited. It has traded up as much as +77.8% since first featured in yellow in the 9/21/10 mid-day report (read here) when noted - "Trading pennies from its 52-week high, with no overhead supply remaining to hinder its progress. A solid gain on the prior session reconfirmed a recent technical breakout above prior chart highs. Subsequent gains into new high territory with volume conviction could signal the beginning of a meaningful price advance."
This high-ranked Internet-Networking Solutions firm has earned very high ranks, and the past 4 quarterly earnings comparisons showed better than +25% increases. Its annual earnings history (A criteria) since trading began in 2008 has been good. Increasing institutional ownership (I criteria) is a reassuring sign, as the number of top-rated funds owning its shares rose from 317 in Mar '10 to 437 in Dec '10.
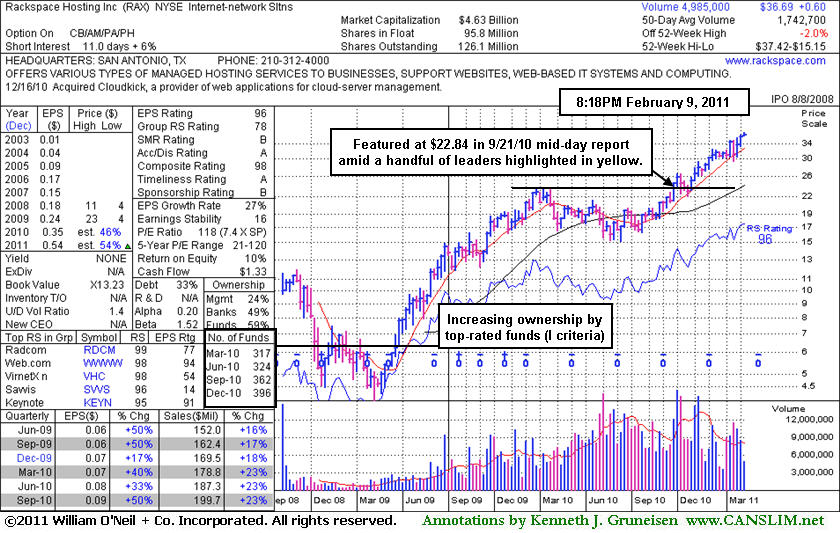
Perched near its all-time high, no resistance remains due to overhead supply, but it is extended from any sound base. It has traded up as much as +63.8% since first featured in yellow in the 9/21/10 mid-day report (read here). This high-ranked Internet-Networking Solutions firm has earned very high ranks, and the past 3 quarterly earnings comparisons showed better than +25% increases. Its annual earnings history (A criteria) since trading began in 2008 has been good. Increasing institutional ownership (I criteria) is a reassuring sign, as the number of top-rated funds owning its shares rose from 317 in Mar '10 to 396 in Dec '10.
Rackspace Hosting Inc (RAX +$0.04 or +0.11% to $36.69) posted a small gain on average volume today. It is extended from any sound base. Since last appearing in this FSU section on 12/31/10 with an annotated graph under the headline "Consolidating After +43% Rally From September Breakout" a new pivot point was cited on 1/10/11 and it broke out on 1/11/11, triggering a new (or add-on) buy signal. However a damaging gap down on 1/20/11 likely forced disciplined investors to limit losses (per the sell rules at -7% from your purchase price) on any recent purchases before it found prompt support near its 50-day moving average (DMA) line and subsequently rallied to new all-time highs with above average volume behind its gains.
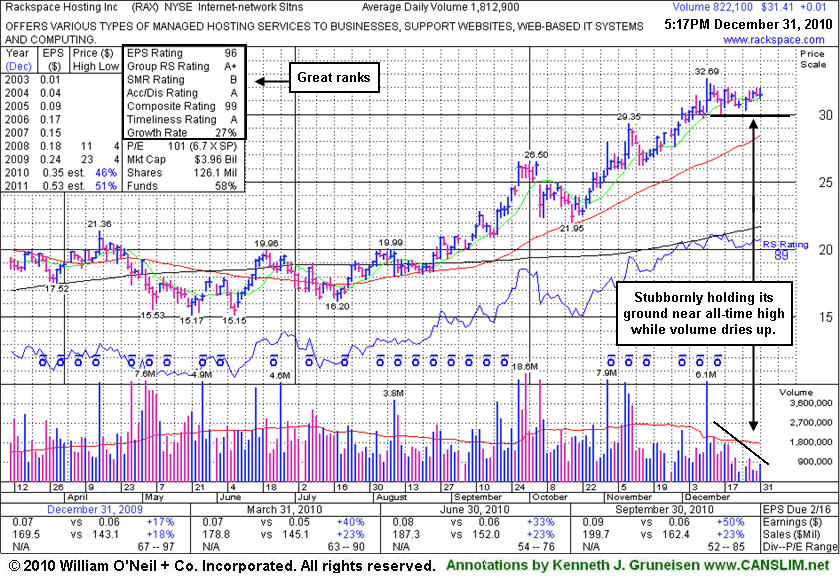
Rackspace Hosting Inc (RAX +$0.01 or +0.03% to $31.41) ended little changed after a small gap up today. Volume totals have been quiet while stubbornly holding its ground since hitting its 12/10/10 all-time high. No resistance remains due to overhead supply, but it is extended from any sound base. It made steady progress since it was last analyzed in this FSU section on 11/17/10 with an annotated graph under the headline "High-Ranked Networking Firm In Sinking Broader Market" and it has traded up as much as +43% since first featured in yellow in the 9/21/10 mid-day report (read here). No overhead supply remains to hinder its progress. This high-ranked Internet-Networking Solutions firm has earned very high ranks, and the past 3 quarterly earnings comparisons showed better than +25% increases. Its annual earnings history (A criteria) since trading began in 2008 has been good.
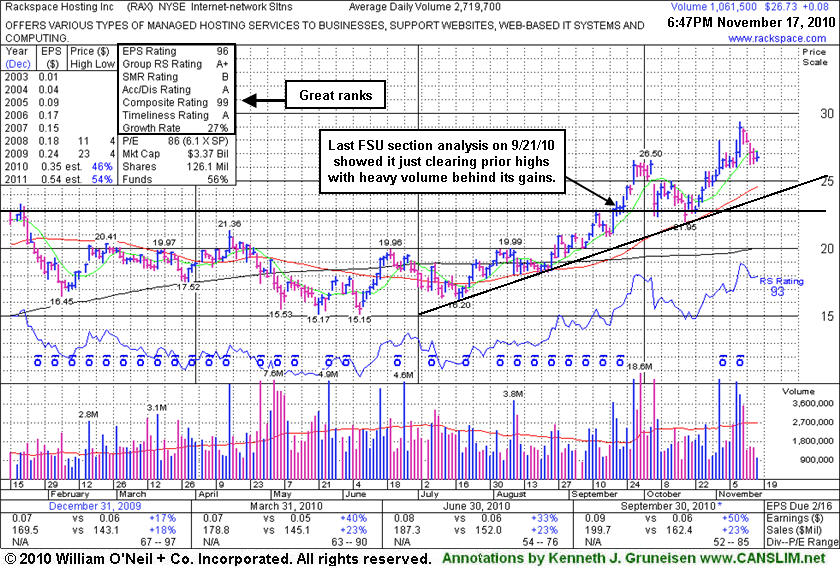
Rackspace Hosting Inc (RAX +$0.08 or +0.30% to $26.73) edged higher today on light volume. Weakness after a gap down on Monday has it slumping toward prior highs near $26 that define initial chart support above its 50-day moving average (DMA) line and an upward trendline connecting its July-October lows. This high-ranked Internet - Network Solutions firm is -8.9% from last week's all-time highs. Since it was last analyzed in this FSU section on 9/21/10 with an annotated graph under the headline "No Overhead Supply Left To Act As Resistance" it made quick progress, then found support near its old chart highs while going through a choppy consolidation. A subsequent rally to new highs was marked by heavy volume again, and now the volume totals have been cooling while it is consolidating, but it is extended from a proper base. Additionally, the M criteria is arguing against new buying efforts again based on recently noted deterioration in the major average and a sudden evaporation of leadership (new highs) since November 4th when new highs totals on the exchanges recently peaked.
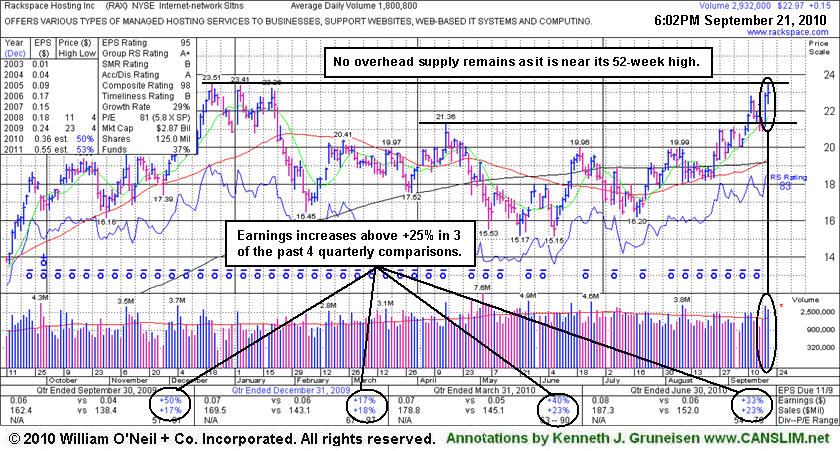
No overhead supply remains to hinder its progress. This high-ranked Internet-Networking Solutions firm has earned very high ranks, and 3 of the past 4 quarterly earnings comparisons showed better than +25% increases. Its annual earnings history (A criteria) since trading began in 2008 has been good.
In recent weeks an increasing number of leading stocks setting up and breaking of solid bases have been highlighted in the CANSLIM.net Mid-Day Breakouts Report. The most relevant factors are briefly noted in the report which allows disciplined investors to place the issue in their custom watch list and receive subsequent notes directly via email immediately when they are published (click the "Alert me of new notes" link). More detailed analysis is published soon after a stock's initial appearance in yellow once any new candidates are added to the Featured Stocks list. Letter-by-letter details concerning strengths or shortcomings of the company in respect to key fundamental criteria of the investment system appear along with annotated datagraphs highlighting technical chart patterns in the Featured Stock Update (FSU) section included in the CANSLIM.net After Market Update each day.
Rackspace Hosting Inc (RAX +$0.15 or +0.66% to $22.97) posted a gain today and was highlighted in yellow in the mid-day report (read here) as it was trading pennies from its 52-week high. No overhead supply remains to hinder its progress. A solid gain on the prior session reconfirmed a recent technical breakout above prior chart highs. Subsequent gains into new high territory with volume conviction could signal the beginning of a meaningful price advance. This high-ranked Internet-Networking Solutions firm has earned very high ranks, and 3 of the past 4 quarterly earnings comparisons showed better than +25% increases. Its annual earnings history (A criteria) since trading began in 2008 has been good.
