Former Favorite Paused At All-Time High - Wednesday, July 06, 2011
Quality Systems Inc (QSII -$0.02 or -0.02% to $90.40) hit a new all-time high today with its 7th consecutive gain after a lopsided 9-week cup shaped base without a handle. It was featured in today's mid-day report with an annotated daily graph (read here) as its color code was changed to yellow. A volume-driven gain above its pivot point still is needed to trigger a new technical buy signal.This long-ago featured Computer Software - Medical firm had encountered prompt distributional pressure after reaching new multi-year highs when it last appeared in this FSU section on 9/15/08 under the headline, "Negative Reversal on Weekly Chart Raised Concerns". Its reversal and gaps down were noted in CANSLIM.net's ongoing coverage as weak technical action raised concerns, It had been highlighted in yellow in the 09/09/2008 Mid-Day Breakouts Report. It was first featured on Monday, January 31, 2005 in the CANSLIM.net Mid Day Breakouts Report (read here).
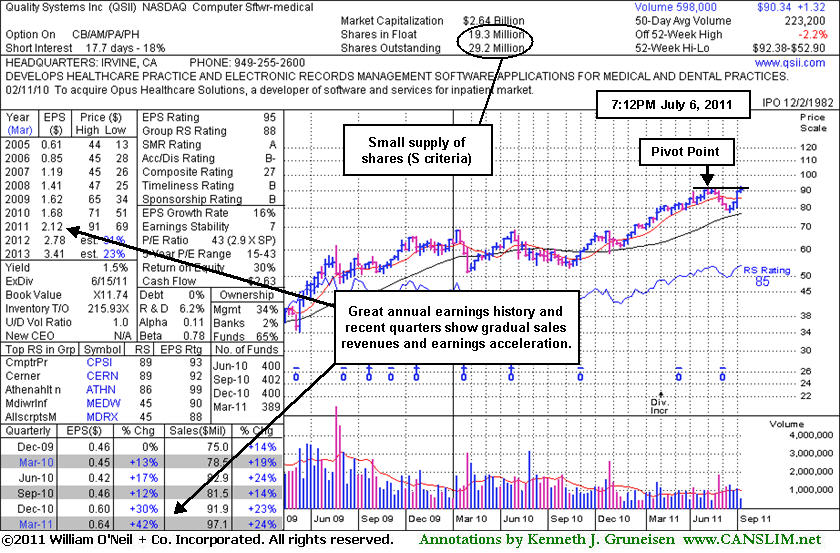
It is worth noting that the company has maintained a steady annual earnings history (good A criteria). Its 2 latest quarterly comparisons also showed better than the minimum +25% earnings per share increases and there has also been gradual sales revenues acceleration in recent comparisons. The small supply of shares in circulation (the S criteria) could contribute to greater volatility, especially if the institutional crowd rushes in or out. The number of top-rated funds owning its shares slipped from 400 in Dec '10 to 389 in Mar '11, raising minor concerns with respect to the I criteria. That is all the more reason for disciplined investors to watch for convincing proof of heavy accumulation by the institutional crowd before taking any action, resisting the temptation to get in "early" before a technical breakout.
Negative Reversal on Weekly Chart Raised Concerns - Monday, September 15, 2008
After a stock breaks out, it is imperative to continue monitoring its daily and weekly price and volume patterns for any possible ailments that may develop. Every so often, there are a few ominous technical signals that emerge. Prudent investors have learned to identify them due to the fact that they tend to lead to lower prices. One of these disconcerting technical signals is called a negative reversal. A negative reversal occurs when a stock opens up the session heading higher but then reverses and ultimately closes lower. Reversals are often considered more severe if the stock's initial gains lift it to a new high, but it then reverses and closes for a loss on heavier than average volume and ends near the session's utmost lows. Negative reversals can occur on a daily, weekly and monthly chart. In general, the longer the time frame involved, the more concern is prompted by the severity of the reversal. Volume is directly correlated with the severity as well.
Quality Systems Inc (QSII -$2.29 or -6.20% to $39.22) has pulled back to its 10-week average line, an important support level. Last week's loss created a negative reversal on its weekly chart as it encountered prompt distributional pressure after reaching new multi-year highs. Its reversal and gaps down were noted in CANSLIM.net's ongoing coverage as the weak technical action raised concerns, hurting its outlook. This high-ranked leader from the Computer Software - Medical group was featured again in yellow in the 09/09/2008 Mid-Day Breakouts Report. It was first featured on Monday, January 31, 2005 in the CANSLIM.net Mid Day Breakouts Report (read here). After making great progress; later, weak action resulted in its removal from the Featured Stocks list. However, it is worth noting that in the interim the company has maintained a steady annual earnings history (good A criteria). Its 2 latest quarterly comparisons also showed better than the minimum +25% earnings per share increases. The small supply of shares in circulation (the S criteria) could contribute to greater volatility, especially if the institutional crowd rushes in or out.
C A N S L I M | StockTalk | News | Chart | SEC | Zacks Reports | ![]()
![]()
![]()

View all notes | Alert me of new notes | CANSLIM.net Company Profile
Fresh Breakouts Confirm Rally - Monday, November 14, 2005
