Streak of Gains Leaves Leader Extended From Base - Wednesday, September 14, 2011
Smart Investors May Reconsider Rallying Retailer - Tuesday, August 30, 2011
Detailed Analysis of Advanced Chart Pattern - Friday, July 22, 2011
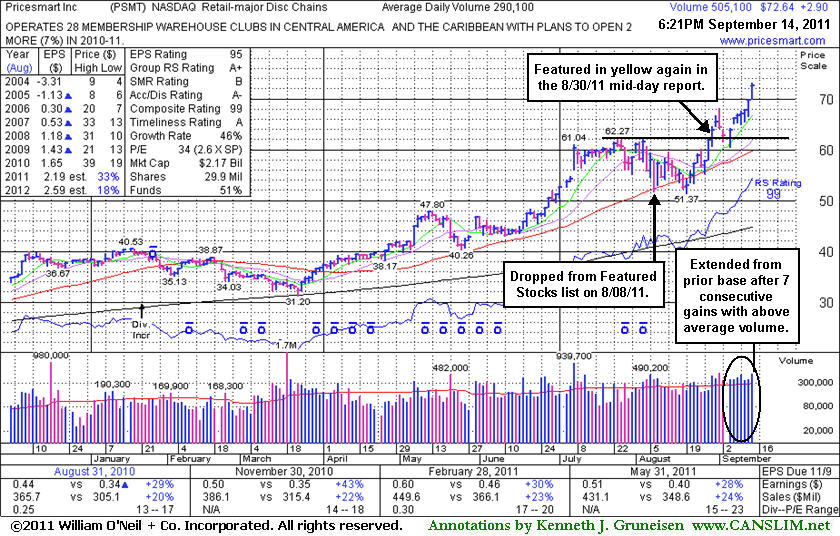
Streak of Gains Leaves Leader Extended From Base - Wednesday, September 14, 2011
Pricesmart Inc (PSMT +$2.90 or +4.16% to $72.64) rallied even higher today, getting more extended from its prior base. Before its impressive streak of 7 consecutive gains backed by above average volume, prior chart highs had acted as a support level on a brief pullback. Typically about 40% of breakouts pull back and find support near their prior highs before continuing higher.
This high-ranked leader in the Retail - Major Discount Chains group's last appearance in this FSU section was on 8/30/11, as it hit a new 52-week high with a 3rd consecutive gain, and an annotated weekly graph was included under the headline, "Smart Investors May Reconsider Rallying Retailer". Its strong finish with +79% above average volume then helped it clear a "square box" base formed over the prior 5 weeks. Its resilience and renewed strength had prompted its return to the Featured Stocks list, while it had been slumping below its 50-day moving average (DMA) line when last noted on 8/08/11 as it was dropped from the Featured Stocks list. Not long before then, in the 7/29/11 mid-day report (read here) it was first highlighted in yellow because of an advanced "3-weeks tight" type pattern.
PSMT now faces no resistance due to overhead supply. Its small supply (S criteria) of only 17.9 million shares in the publicly traded float can contribute to greater volatility in the event of institutional buying or selling. Disciplined investors avoid chasing stocks extended more than +5% above prior chart highs, and they always limit losses by selling if any stock falls more than -7% from their purchase price.
The number of top-rated funds owning its shares rose from 199 in Sept '10 to 236 in Jun '11, which is a reassuring sign concerning the I criteria of the fact-based investment system. Recent quarterly comparisons (C criteria) show earnings increases above the +25% guideline versus the year earlier and slow sequential acceleration in its sales revenues increases. Its annual earnings (A criteria) growth rate has been strong and steady. Regular readers may have seen prior reference to blue triangles beside the yearly earnings numbers in each year from 2005-2009 on the chart below which indicate pre-tax, non-recurring items were included (where possible, such items are normally removed to provide data better suited for comparison).
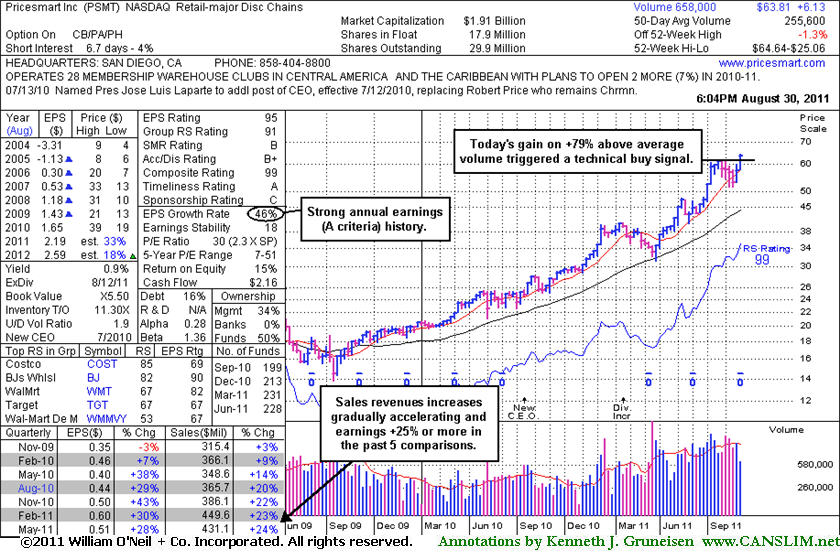
Smart Investors May Reconsider Rallying Retailer - Tuesday, August 30, 2011
Pricesmart Inc (PSMT +$2.01 or +3.25% to $63.81) hit a new 52-week high with today's 3rd consecutive gain. Its color code was changed to yellow and a new pivot point was cited in the mid-day report, and its strong finish with +79% above average volume helped it clear a "square box" base formed over the past 5 weeks. The weekly graph below shows that this high-ranked leader in the Retail - Major Discount Chains group rebounded promptly after undercutting prior chart lows and slumping below its 50-day moving average (DMA) line when last noted on 8/08/11 as it was dropped from the Featured Stocks list. Recent resilience and renewed strength has prompted its return to the Featured Stocks list.
The volume-driven gain above its pivot point confirmed a new technical buy signal, and it now faces no resistance due to overhead supply. Its small supply (S criteria) of only 17.9 million shares in the publicly traded float can contribute to greater volatility in the event of institutional buying or selling. Disciplined investors avoid chasing stocks extended more than +5% above prior chart highs, and they always limit losses by selling if any stock falls more than -7% from their purchase price. The number of top-rated funds owning its shares rose from 199 in Sept '10 to 228 in Jun '11, which is a reassuring sign concerning the I criteria of the fact-based investment system.
Recent quarterly comparisons (C criteria) show earnings increases above the +25% guideline versus the year earlier and slow sequential acceleration in its sales revenues increases. Its annual earnings (A criteria) growth rate has been strong and steady. Regular readers may have seen prior reference to blue triangles beside the yearly earnings numbers in each year from 2005-2009 on the chart below which indicate pre-tax, non-recurring items were included (where possible, such items are normally removed to provide data better suited for comparison).
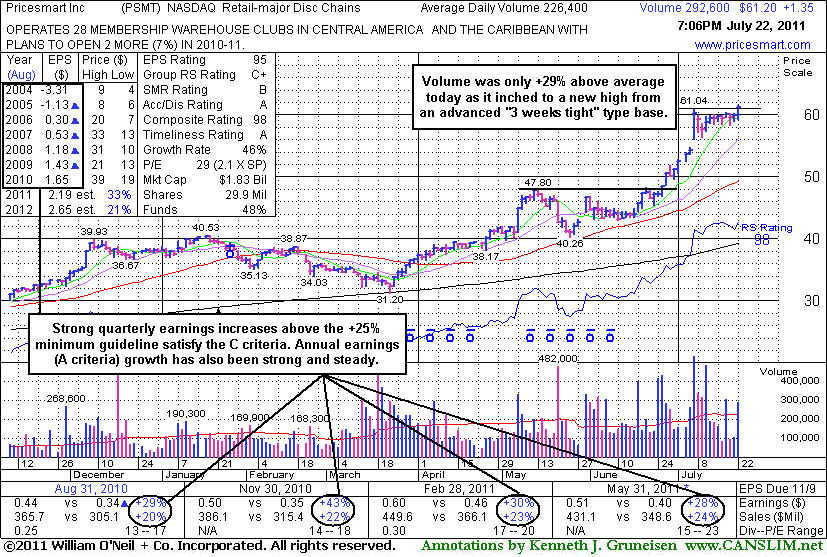
Detailed Analysis of Advanced Chart Pattern - Friday, July 22, 2011
Pricesmart Inc (PSMT +$1.35 or +2.26% to $61.20) finished the session with a gain on +29% above average volume. The minimum volume threshold for a stock to trigger a technical buy signal is +40-50% above average. Most of the market's biggest winners have broken out with big gains on very heavy volume, they did not limp over their pivot points without great volume conviction. This high-ranked leader in the Retail - Major Discount Chains group had seen its volume totals cooling in recent weeks while staying confined to a tight range near its 52-week high, stubbornly holding its ground after an impressive spurt of volume-driven gains. In today's mid-day report (read here) it was highlighted because of an advanced "3-weeks tight" type pattern, and its color code was changed to yellow with pivot point cited based on its 52-week high plus 10 cents.
Volume-driven gains above its pivot point may confirm and trigger a new (or add-on) technical buy signal, however its weekly winning streak is already up to 6 weeks, and it looks like a 3rd stage base. Some breakouts from late-stage bases work, but they are considered riskier and more failure prone. Bullish action has continued since noted in the 6/27/11 mid-day report after rising from a 7-week base-on-base type pattern with no resistance due to overhead supply. Its small supply (S criteria) of only 17.9 million shares in the publicly traded float can contribute to greater volatility in the event of institutional buying or selling. The number of top-rated funds owning its shares rose from 199 in Sept '10 to 224 in Jun '11, which is a reassuring sign concerning the I criteria of the fact-based investment system.
It found support above its 50 DMA line and prior highs in the $40 area during prior consolidations. Recent quarterly comparisons (C criteria) show earnings increases above the +25% guideline versus the year earlier and slow sequential acceleration in its sales revenues increases. Its annual earnings (A criteria) growth has been strong and steady. Regular readers may have seen prior reference to blue triangles beside the yearly earnings numbers in each year from 2005-2009 on the chart below which indicate pre-tax, non-recurring items were included (where possible, such items are normally removed to provide data better suited for comparison).