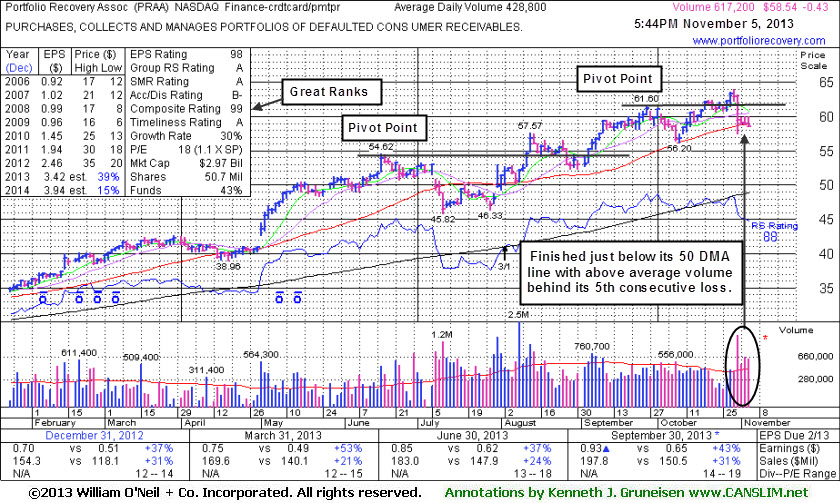
Near 50-Day Moving Average Enduring Distributional Pressure - Tuesday, November 05, 2013
Portfolio Recovery Assoc (PRAA -$0.43 or -0.73% to $58.54) was down today for a 5th consecutive loss with above average volume, slumping below prior highs and finishing below its 50-day moving average (DMA) line, raising concerns. Volume-driven gains did not trigger a proper new (or add-on) technical buy signal after a new pivot point was recently cited. Great volume conviction is a critical element to any proper buy signal as it shows that heavy institutional buying demand is lurking, but when PRAA hit a new high last week it was lacking volume behind the gain. More damaging losses below its prior low ($56.20 on 10/09/13) would raise more serious concerns and trigger more worrisome technical sell signals.
This high-ranked leader from the Finance - Credit Card/Payment Processing industry group has strong fundamentals and has earned great ranks. The number of top-rated funds owning its shares rose from 308 in Jun '12 to 431 in Sep '13, a reassuring sign concerning the I criteria. It recently reported earnings +43% on +31% sales revenues for the Sep '13 quarter, continuing its track record of strong earnings increases above the +25% minimum guideline (C criteria). It found support at its 50-day moving average (DMA) line during its consolidation after last shown in this FSU section with an annotated graph on 9/26/13 under the headline, "Wedging to New Highs With Gains Lacking Volume Conviction". A 3:1 share split impacted prices on 8/02/13.
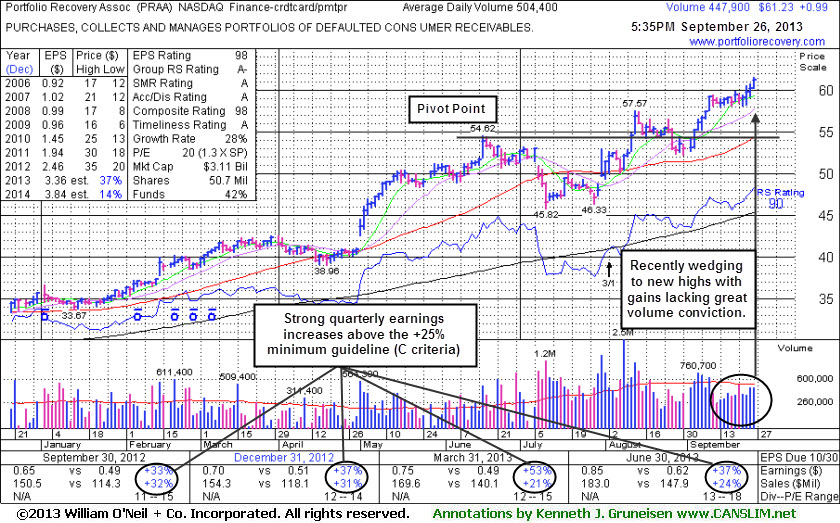
Wedging to New Highs With Gains Lacking Volume Conviction - Thursday, September 26, 2013
Portfolio Recovery Assoc (PRAA +$0.99 or +1.64% to $61.23) hit a new 52-week high with today's 4th consecutive gain on light volume, wedging higher and getting more extended from its prior base. It found support above its 50-day moving average (DMA) line during the latest consolidation after briefly undercutting prior highs in the $54 area. It found prompt support and proved its resilience, as bullish action has followed since it was last shown in this FSU section with an annotated graph on 8/28/13 under the headline "Slump Into Prior Base During Market Correction Negated Breakout". It had slumped below its old high close ($53.86 on 6/17/13), and the deterioration completely negated the prior technical breakout. Disciplined investors may have been prompted to limit losses if it fell more than -7% from their purchase price. Remember, any stock which is sold can be bought back again later if strength returns, but limiting losses while they are small is "Rule #1" and can be critical to investors' success.
Do not be confused by 3:1 share split impacting prices on 8/02/13. Strong earnings +37% on +24% sales revenues for the Jun '13 quarter continued its track record of strong earnings increases above the +25% minimum guideline (C criteria). This high-ranked leader from the Finance - Credit Card/Payment Processing industry group has strong fundamentals and has earned great ranks. The number of top-rated funds owning its shares rose from 308 in Jun '12 to 417 in Jun '13, a reassuring sign concerning the I criteria. Its current Up/Down Volume Ratio of 2.0 is also an unbiased indication its shares have been under accumulation over the past 50 days.
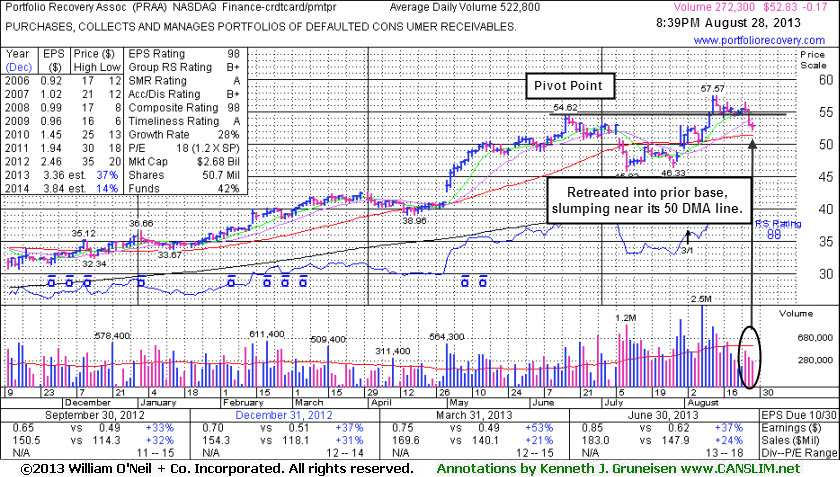
Slump Into Prior Base During Market Correction Negated Breakout - Wednesday, August 28, 2013
Portfolio Recovery Assoc (PRAA -$0.17 or -0.32% to $52.83) has seen light volume behind losses while it slumped below its old high close ($53.86 on 6/17/13) previously noted. The deterioration has completely negated the recent technical breakout, raising concerns. Disciplined investors always limit losses if any stock falls more than -7% from their purchase price.PRAA triggered a technical buy signal with volume driven gains since last shown in this FSU section with an annotated graph on 8/02/13 under the headline, "Facing Some Resistance While Rallying With Volume". Keep in mind that the broader market's (M criteria) ongoing correction (noted regularly in the Market Commentary) is an overriding concern arguing against any new buying efforts because as 3 out of 4 stocks typically move in the same direction as the major averages.
Do not be confused by 3:1 share split impacting prices on 8/02/13. Strong earnings +37% on +24% sales revenues for the Jun '13 quarter continued its track record of strong earnings increases above the +25% minimum guideline (C criteria). This high-ranked leader from the Finance - Credit Card/Payment Processing industry group has strong fundamentals and has earned great ranks. The number of top-rated funds owning its shares rose from 308 in Jun '12 to 424 in Jun '13, a reassuring sign concerning the I criteria.
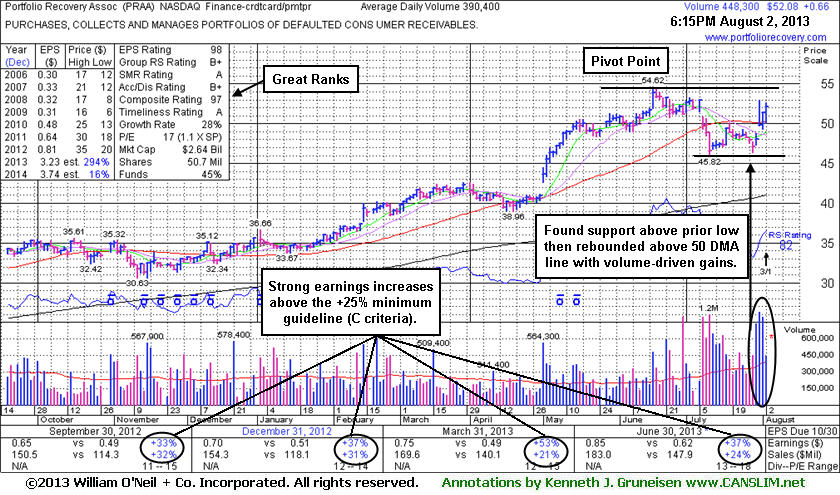
Facing Some Resistance While Rallying With Volume - Friday, August 02, 2013
Portfolio Recovery Assoc (PRAA +$0.65 or +1.27% to $52.08) edged higher and rallied further above its 50-day moving average (DMA) line with volume-driven gains but disciplined investors will note that it has not triggered a proper technical buy signal since returning to the Featured Stocks list. It was highlighted in yellow with new pivot point cited based on its 6/17/13 high plus 10 cents in Wednesday's mid-day report (read here) yet noted with caution - "It faces some resistance and needs additional volume-driven gains to trigger a proper new technical buy signal."
Do not be confused by 3:1 share split impacting prices today (pivot point, max buy price have been adjusted accordingly). Recently it reported earnings +37% on +24% sales revenues for the Jun '13 quarter, continuing its record of strong earnings increases above the +25% minimum guideline (C criteria). It halted its slide above prior lows and showed resilience since dropped from the Featured Stocks list on 7/10/13 due to technical weakness. Disciplined investors always limit losses if any stock falls more than -7% from their purchase price. Patient investors know that if or when strength returns any previously sold stock can always be bought back. Members are often alerted to continue watching high-ranked leaders for a new base or secondary buy point to possibly develop and be noted in the weeks ahead.
This high-ranked leader from the Finance - Credit Card/Payment Processing industry group has strong fundamentals and has earned great ranks. The number of top-rated funds owning its shares rose from 308 in Jun '12 to 420 in Jun '13, a reassuring sign concerning the I criteria.
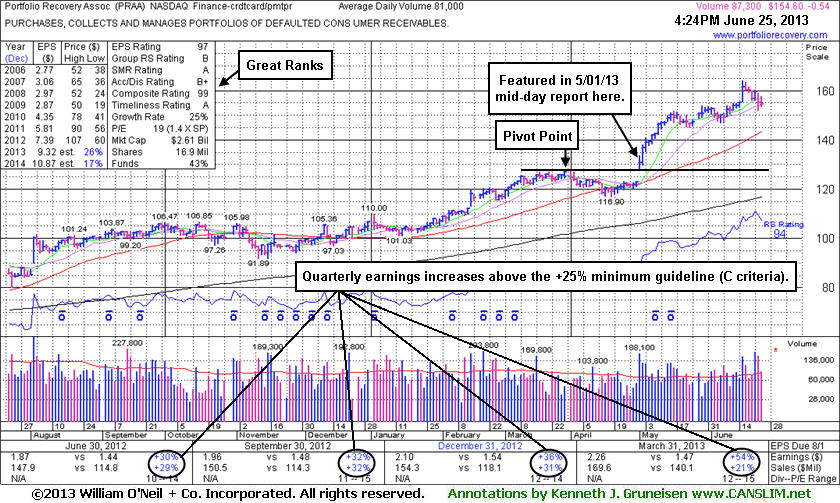
Extended From Base After Rallying With No Overhead Supply - Tuesday, June 25, 2013
Portfolio Recovery Assoc (PRAA -$0.54 or -0.35% to $154.60) is consolidating near its all-time high, extended from any sound base. It rallied into new high territory in recent weeks with no resistance due to overhead supply. Its 50-day moving average (DMA) line defines important near-term chart support to watch on pullbacks. Patient investors may continue watching for a new base or secondary buy point to possibly develop and be noted in the weeks ahead. Since highlighted in the 5/01/13 mid-day report (read here) after its "breakaway gap" it has shown bullish action and traded up as much as +25.3%.Its last appearance in this FSU section was on 6/10/13 with an annotated graph under the headline, "Perched Near High After Mild Distributional Pressure". The high-ranked leader from the Finance - Credit Card/Payment Processing industry group has strong fundamentals. It reported earnings +54% on +21% sales revenues for the Mar '13 quarter, continuing its record of strong earnings increases above the +25% minimum guideline (C criteria). The number of top-rated funds owning its shares rose from 308 in Jun '12 to 384 in Mar '13, a reassuring sign concerning the I criteria. Its Up/Down Volume Ratio is currently at 2.1, an unbiased indication that its shares have been under accumulation over the past 50 days.
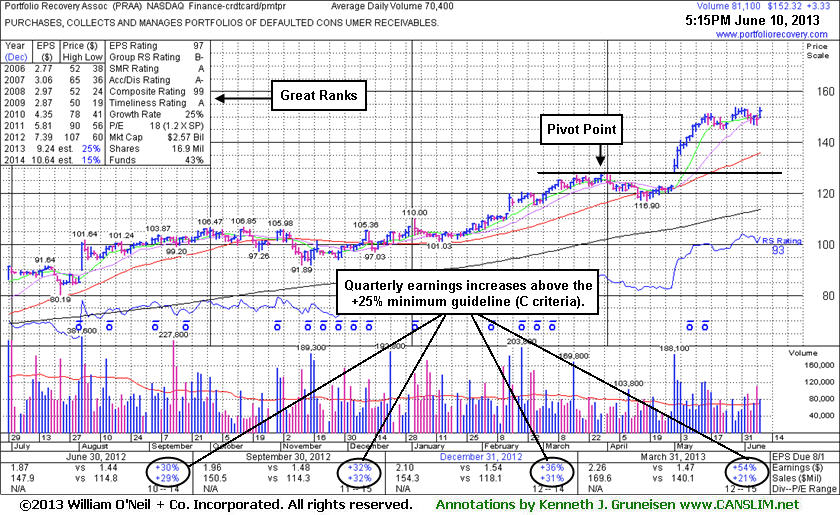
Perched Near High After Mild Distributional Pressure - Monday, June 10, 2013
Portfolio Recovery Assoc (PRAA +$3.33 or +2.24% to $152.32) endured mild distributional pressure last week as indicated by the couple of down days marked by above average volume. The high-ranked leader from the Finance - Credit Card/Payment Processing industry group is still holding its ground stubbornly near its all-time high with no resistance remaining due to overhead supply. It is very extended from prior highs in the $127 area and well above its 50-day moving average (DMA) line defining important chart support levels to watch on pullbacks.
Its last appearance in this FSU section was on 5/22/13 with an annotated graph under the headline, "Extended From Base After Streak of Gains for New Highs", consolidating near its high after an impressive streak of 13 consecutive gains into new high territory. Patient investors may watch for a new base or secondary buy point to possibly develop and be noted in the weeks ahead. Since highlighted in the 5/01/13 mid-day report (read here) after its "breakaway gap" it has shown bullish action. Its fundamentals remain strong, as it reported earnings +54% on +21% sales revenues for the Mar '13 quarter, continuing its record of strong earnings increases above the +25% minimum guideline (C criteria). The number of top-rated funds owning its shares rose from 308 in Jun '12 to 385 in Mar '13, a reassuring sign concerning the I criteria.
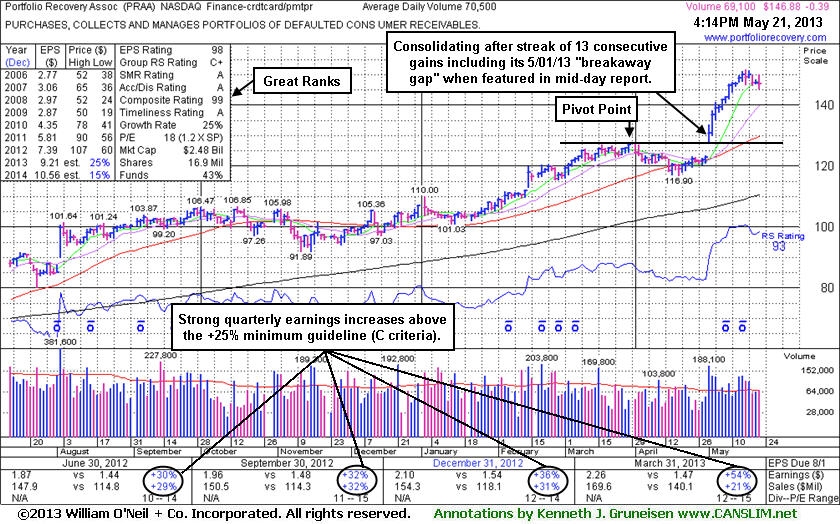
Extended From Base After Streak of Gains for New Highs - Wednesday, May 22, 2013
Portfolio Recovery Assoc (PRAA +$8.13 or +6.62% to $130.88) has been consolidating near its high after an impressive streak of 13 consecutive gains into new high territory. It is very extended from prior highs in the $127 area coinciding with its 50-day moving average (DMA) line defining important chart support. Patient investors may watch for a new base or secondary buy point to possibly develop and be noted in the weeks ahead. It recently reported earnings +54% on +21% sales revenues for the Mar '13 quarter, continuing its record of strong earnings increases above the +25% minimum guideline (C criteria). The number of top-rated funds owning its shares rose to 384 in Mar '13, providing additional reassurance concerning the I criteria (see earlier totals noted below). Its last appearance in this FSU section was on 5/01/13 with an annotated graph under the headline, "Volume-Driven Gap Up Gain Triggered Technical Buy Signal", after highlighted in yellow with new pivot point cited based on its 3/28/13 high plus 10 cents in the earlier mid-day report (read here). Its "breakaway gap" and considerable gain that day was backed by +127% above average volume clinching a technical buy signal.The high-ranked leader from the Finance - Credit Card/Payment Processing industry group held its ground near its 50-day moving average (DMA) line during the consolidation from new highs hit since last noted with caution in the 2/20/13 mid-day report - "No overhead supply remains to act as resistance. Reported earnings +36% on +31% sales revenues for the Dec '12 quarter. The number of top-rated funds owning its shares rose from 302 in Mar '12 to 361 in Dec '12, a reassuring sign concerning the I criteria. Its Mar '12 results marked its only comparison with an earnings increase below the +25% minimum guideline in more than 2 years. Previously noted downturn in FY '08 and FY '09 earnings (A criteria) is a flaw in its annual earnings history." As of Mar '13 the number of top-rated funds owning its shares rose to 370, more reassuring news concerning the I criteria.
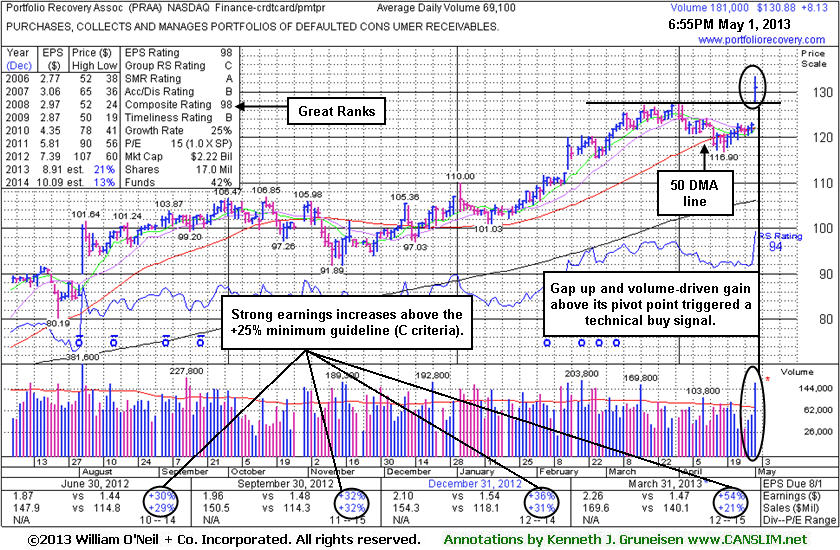
Volume-Driven Gap Up Gain Triggered Technical Buy Signal - Wednesday, May 01, 2013
Often, when a leading stock is setting up to breakout of a solid base it is highlighted in CANSLIM.net's Mid-Day Breakouts Report. The most relevant factors are noted in the report which alerts prudent CANSLIM oriented investors to place the issue in their watch list. After doing any necessary backup research, the investor is prepared to act after the stock triggers a technical buy signal (breaks above its pivot point on more than +50% average turnover) but before it gets too extended from a sound base. In the event the stock fails to trigger a technical buy signal and its price declines then it will simply be removed from the watch list. Disciplined investors know to buy as near as possible to the pivot point and avoid chasing stocks after they have rallied more than +5% above their pivot point. It is crucial to always limit losses whenever any stock heads the wrong direction, and disciplined investors sell if a struggling stock ever falls more than -7% from their purchase price.
Portfolio Recovery Assoc (PRAA +$8.13 or +6.62% to $130.88) finished in the upper half of its intra-day range today after highlighted in yellow with new pivot point cited based on its 3/28/13 high plus 10 cents in today's earlier mid-day report (read here). It hit a new 52-week high after a "breakaway gap" and the considerable gain was backed by +127% above average volume clinching a technical buy signal. The high-ranked leader from the Finance - Credit Card/Payment Processing industry group reported earnings +54% on +21% sales revenues for the Mar '13 quarter. It held its ground near its 50-day moving average (DMA) line during the latest consolidation from new highs hit since last noted with caution in the 2/20/13 mid-day report - "No overhead supply remains to act as resistance. Reported earnings +36% on +31% sales revenues for the Dec '12 quarter. The number of top-rated funds owning its shares rose from 302 in Mar '12 to 361 in Dec '12, a reassuring sign concerning the I criteria. Its Mar '12 results marked its only comparison with an earnings increase below the +25% minimum guideline in more than 2 years. Previously noted downturn in FY '08 and FY '09 earnings (A criteria) is a flaw in its annual earnings history." As of Mar '13 the number of top-rated funds owning its shares rose to 370, more reassuring news concerning the I criteria.
It undercut its 200 DMA line during a deep consolidation during the 2007-09 Bear Market period yet survived and then rebounded and rallied into new high territory in recent years since dropped from then Featured Stocks list on 8/26/05. Its last appearance in this FSU section was on 7/27/05 with an annotated graph under the headline, "Leader Sells Off On Earnings News, Closes in Upper Half of Range". Remember, stocks that are dropped from the Featured Stocks list can return again later if strength returns and fundamentals remain strong with respect to the fact-based investment system's guideline.
Leader Sells Off On Earnings News, Closes in Upper Half of Range - Wednesday, July 27, 2005
Portfolio Recovery Associates Inc (PRAA -$1.42 or -3.26% to $42.12) plunged today on above average volume, slicing through its 50-day moving average after announcing second-quarter 2005 earnings per share growth of +30% from the same period a year earlier. This concerns the "C" in CANSLIM where one would compare a company's quarterly earrings to the same quarter a year ago and look for a minimum +25% improvement. It meets the guideline in that department. However, earning announcements are often the cause of excessive volatility and increaes trading volume in stocks, and companies will often see their shares sell off even though the announcement appears to be a positive one.
This high-ranked Financial Services - Misc group leader was featured on July 11th in the CANSLIM.net Mid-Day BreakOuts Report (read here). It only made minimal gains after that appearance. Today's reversal from earlier lows to close in the upper half of the day's trading range, and the stock's ability to fight back for a close above its Dec '04 and Feb '05 high closes, may serve as slight reassurances for any members who may be holding shares of PRAA. It is always considered crucial that a prompt and almost immediate show of support lead to a speedy repair of any technical violations.
