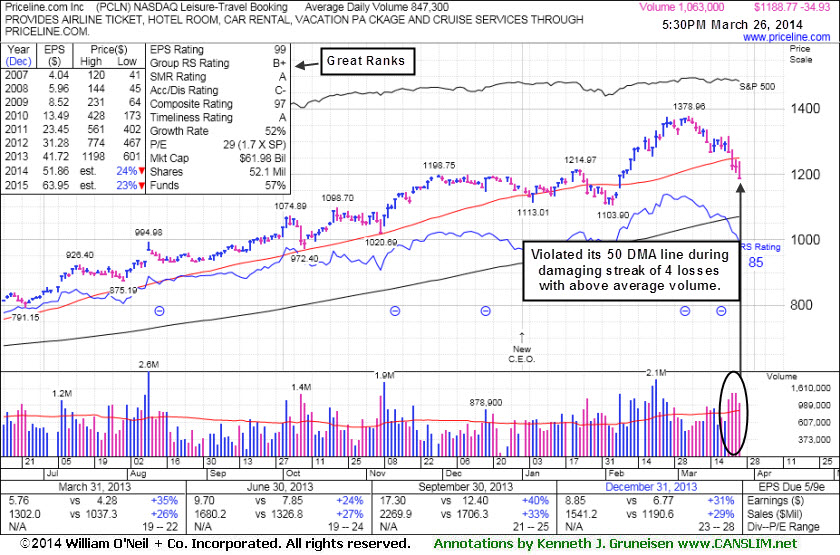
Technical Deterioration Raised Concerns - Wednesday, March 26, 2014
Priceline.com Inc (PCLN -$34.93 or -2.85% to $1,188.77) has seen its technical stance deteriorating quickly as during its streak of 4 consecutive losses with above average volume violated its 50-day moving average (DMA) line. The weak action has been indicative of distributional pressure. Its small supply of only 52.1 million outstanding shares (S criteria) can contribute to price volatility in the event of institutional buying or selling. Disciplined investors avoid chasing extended stocks and always sell if any stock falls more than -7% from their purchase price. PCLN was last shown in this FSU section on 3/10/14 with annotated graphs under the headline, "Perched At Highs With Volume Totals Cooling", while stubbornly holding its ground.A prompt rebound above the 50 DMA line is needed to help its stance improve. Meanwhile, the stock faces resistance due to overhead supply up through the $1,378 level now if attempting to rebound or ever resume the prior rally. Fresh breakouts make superior buy candidates because they can rally unhindered by overhead supply.
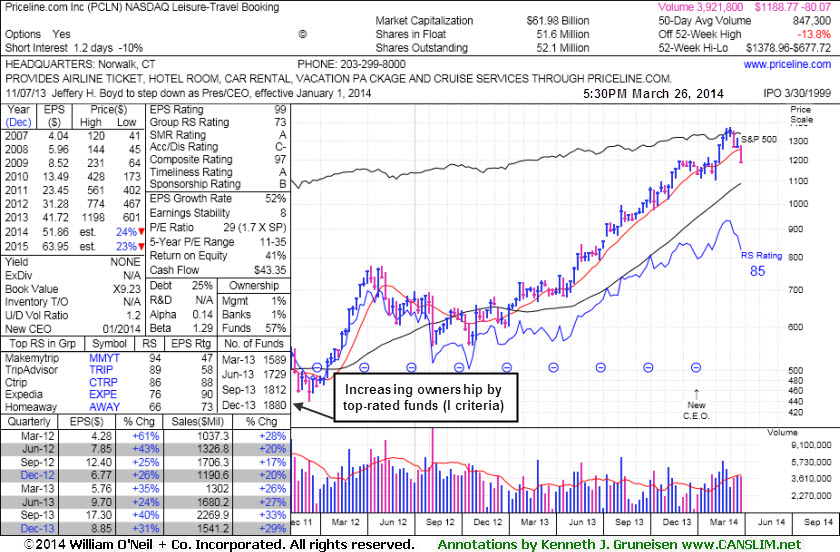
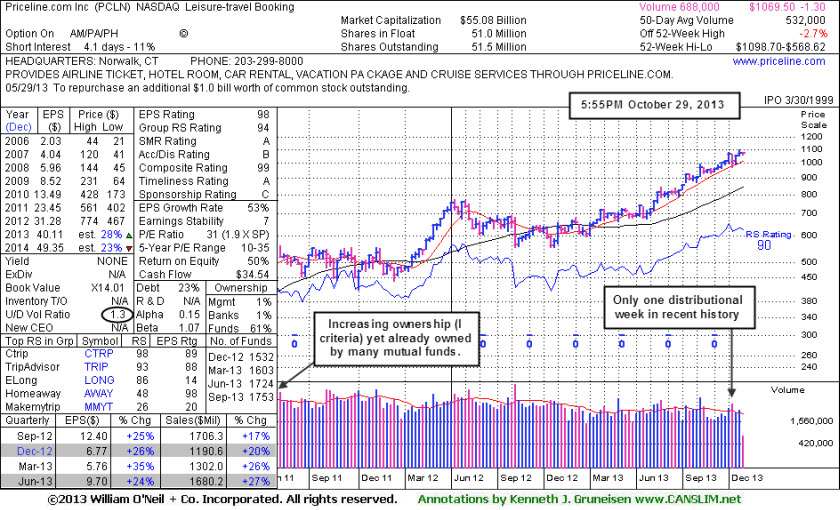
The Leisure - Travel Booking firm has earned great ranks, including the highest possible rating of 99 for earnings Per Share (EPS). Its strong annual earnings history satisfies the A criteria. PCLN reported earnings +31% on +29% sales revenues for the quarter ended December 31, 2013, a 2nd quarterly earnings comparison above the +25% minimum earnings guideline (C criteria) after a slightly sub par Jun '13 report. Keep in mind, the investment system's biggest winning models were typically held by at least a few mutual funds and attracting many others. However, once a stock is very heavily owned by a long list of mutual funds, as is now the case with PCLN, investors should be especially cautious and alert for any technical sell signals or fundamental disappointments which could prompt a rush for the exits. The number of top-rated funds owning its shares rose from 1,594 in Mar '13 to 1,880 in Dec '13, and increasing interest is an encouraging sign concerning the I criteria.
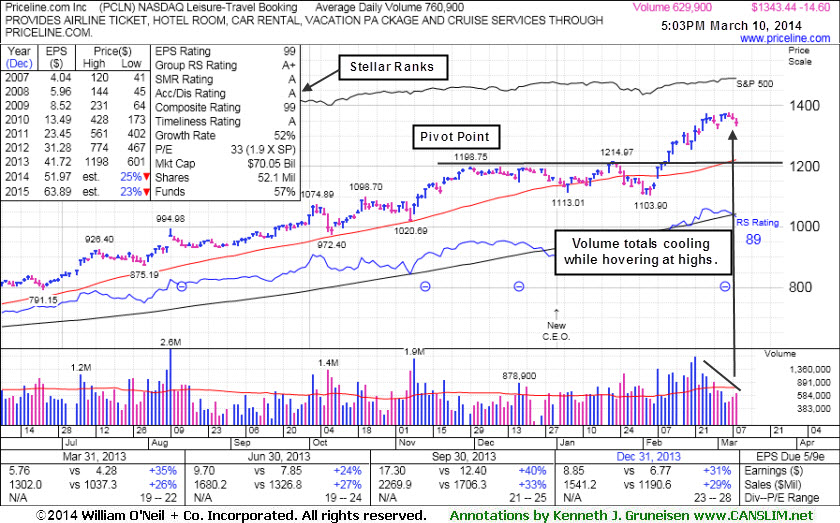
Perched At Highs With Volume Totals Cooling - Monday, March 10, 2014
Priceline.com Inc (PCLN -$14.60 or -1.08% to $1,343.44) is perched near its 52-week high with volume totals cooling while stubbornly holding its ground. That is a sign that few investors have been headed for the exit. Its current Up/Down Volume Ratio of 1.5 is an unbiased indication its shares have been under accumulation over the past 50 days.
It was last shown in this FSU section on 2/13/14 with annotated graphs under the headline, "Extended From Prior Highs After 6th Straight Gain", yet rallied further into new high territory with above average volume behind its gains, getting more extended from any sound base. Disciplined investors may watch for a new base or secondary buy point to possibly develop and be noted in the weeks ahead.
The stock has faced no resistance due to overhead supply while rallying well above its prior highs and above the "max buy" level cited in prior reports. The Leisure - Travel Booking firm has earned great ranks, including the highest possible rating of 99 for earnings Per Share (EPS). Its strong annual earnings history satisfies the A criteria.
PCLN reported earnings +31% on +29% sales revenues for the quarter ended December 31, 2013, a 2nd quarterly earnings comparison above the +25% minimum earnings guideline (C criteria) after a slightly sub par Jun '13 report. Its small supply of only 52.1 million outstanding shares (S criteria) can contribute to price volatility in the event of institutional buying or selling.
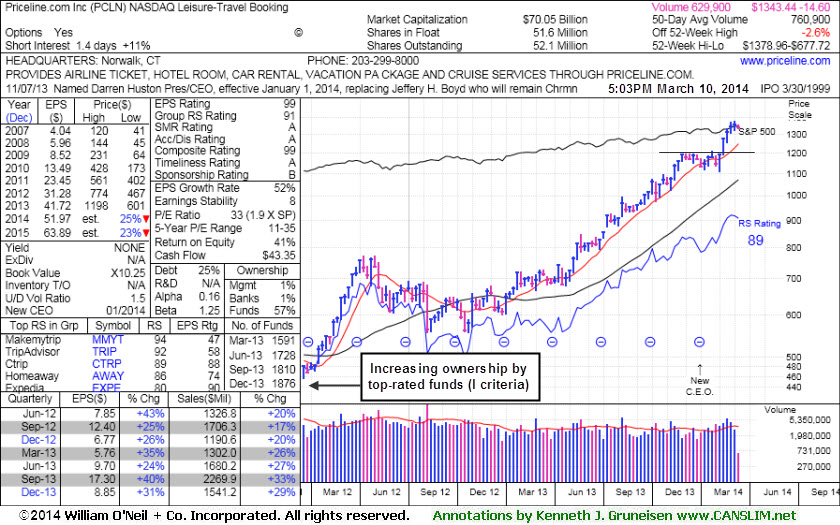
Keep in mind, the investment system's biggest winning models were typically held by at least a few mutual funds and attracting many others. However, once a stock is very heavily owned by a long list of mutual funds, as is now the case with PCLN, investors should be especially cautious and alert for any technical sell signals or fundamental disappointments which could prompt a rush for the exits. The number of top-rated funds owning its shares rose from 1,594 in Mar '13 to 1,876 in Dec '13, and increasing interest is an encouraging sign concerning the I criteria.
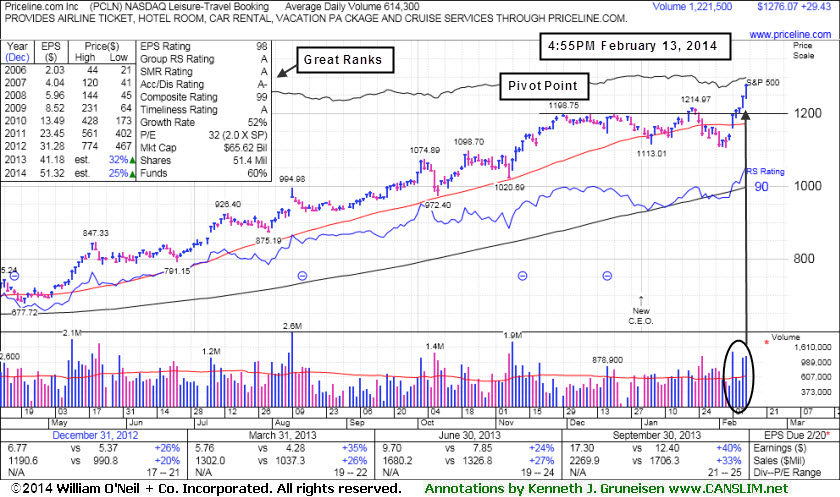
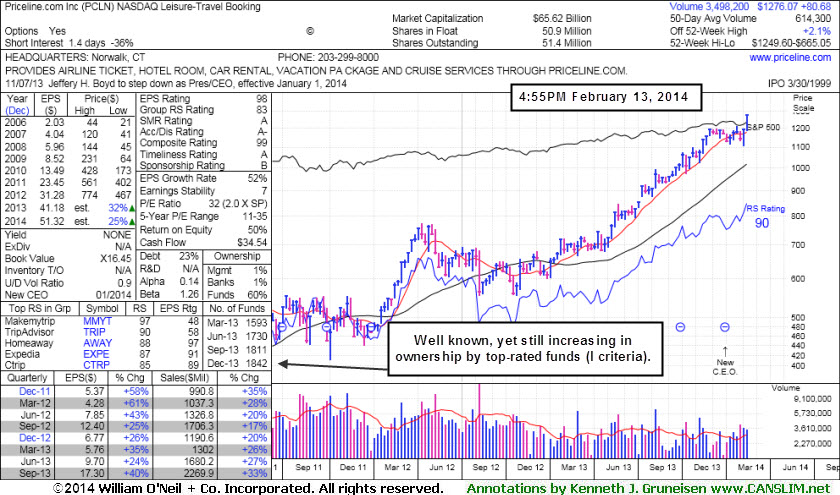
Extended From Prior Highs After 6th Straight Gain - Thursday, February 13, 2014
Priceline.com Inc (PCLN +$29.43 or +2.36% to $1,276.07) rallied to yet another new 52-week high with above average volume behind today's gain, getting extended from any sound base. It finished near the session high after tallying its 6th consecutive gain. The stock has faced no resistance due to overhead supply while rallying well above its prior highs and above the "max buy" level cited in prior reports. The Leisure - Travel Booking firm has earned great ranks, including the highest possible rating of 98 for earnings Per Share (EPS). Its strong annual earnings history satisfies the A criteria.PCLN was last shown in this FSU section on 1/29/14 with annotated graphs under the headline, "Violation of 50-Day Average After Failing to Trigger New Buy Signal", slumping below its 50-day moving average (DMA) line after volume-driven losses raised concerns. The subsequent violation of the prior low ($1,113.01 on 1/06/14) raised greater concerns and triggered a more worrisome technical sell signal.
Disciplined investors watch for a proper technical buy signal before taking action and always limit losses if any stock falls more than -7% from their buy point. Any stock which is sold can always be bought back again if strength returns. In this case, strength returned and the stock was noted on 2/07/14 12:40:56 PM while rebounding above its 50 DMA line with a gap up and considerable volume-driven gain - "Color code is changed to yellow after proving resilient, but no new pivot point is being cited."
Another big factor making buy decisions difficult was the broader market (M criteria) environment in recent weeks. Concerns or questions regarding the M may have also argued all the more in favor of investors employing a tactic called "pyramiding" to allow a stock's price action dictate how heavily to accumulate any new positions. Pyramiding is taught in the Certification. The link above directs members to an example worth reviewing.
PCLN is due to report earnings for the quarter ended December 31, 2013 on February 20th. Keep in mind that volume and volatility often increase near earnings news. Its small supply of only 51.4 million outstanding shares (S criteria) can contribute to price volatility in the event of institutional buying or selling. Earnings rose +40% on +33% sales revenues for the Sep '13 quarter versus the year-ago period, above the +25% minimum earnings guideline (C criteria) and improving after a slightly sub par Jun '13 report.
Keep in mind, the investment system's biggest winning models were typically held by at least a few mutual funds and attracting many others. However, once a stock is very heavily owned by a long list of mutual funds, as is now the case with PCLN, investors should be especially cautious and alert for any technical sell signals or fundamental disappointments which could prompt a rush for the exits. The number of top-rated funds owning its shares rose from 1,594 in Mar '13 to 1,842 in Dec '13, and increasing interest is an encouraging sign concerning the I criteria.
Below is a summary of recent notes which alerted members. Remember that your upgraded membership allows you to chose the "Set NEW NOTE alert" link for any stocks you wish closely monitor, then you will automatically receive new notes from our experts directly via email as soon as they are published, keeping you informed ahead of the subsequently published reports. All prior notes on stocks can be reviewed via the "View all notes" links and via the Company Profile pages members can go back and review all Featured Articles & Daily Graphs annotated in prior reports.
2/13/2014 12:57:34 PM - G - Hitting yet another new 52-week high with today's 6th consecutive gain, rallying with no resistance remaining due to overhead supply. Color code is changed to green after rallying above its "max buy" level.
2/12/2014 12:40:07 PM - Y - Hitting a new 52-week high with today's 5th consecutive gain and no resistance remains due to overhead supply. Color code was changed to yellow after proving resilient and rebounding above its 50 DMA line, but no new pivot point was cited.
2/7/2014 12:40:56 PM - Y - Rebounding above its 50 DMA line today with a gap up and considerable volume-driven gain. Color code is changed to yellow after proving resilient, but no new pivot point is being cited. Recent low ($1,103.90 on 2/05/14) defines near-term support to watch where further deterioration would raise greater concerns.
2/6/2014 5:59:06 PM - G - The longer it lingers below its 50 DMA line the worse its outlook gets. Recent low ($1,103.90 on 2/05/14) defines near-term support to watch where further deterioration would raise greater concerns.
1/29/2014 5:57:38 PM - G - Slumped further below its 50 DMA line today with slightly higher volume. Prior low ($1,113.01 on 1/06/13) defines near-term support to watch. See the latest FSU analysis for more details and new annotated graphs.
1/27/2014 12:50:20 PM - G - Slumping below its 50 DMA line today with a 3rd consecutive loss raising concerns. Its color code is changed to green, and the prior low ($1,113.01 on 1/06/13) defines near-term support to watch. Did not trigger a technical buy signal since recently featured in yellow.
1/24/2014 4:18:43 PM - Y - Consolidating above its 50 DMA line which recently acted as support. A volume-driven gain above its pivot point may trigger a technical buy signal, meanwhile, its 50 DMA line and prior low ($1,113.01 on 1/06/13) define near-term support to watch.
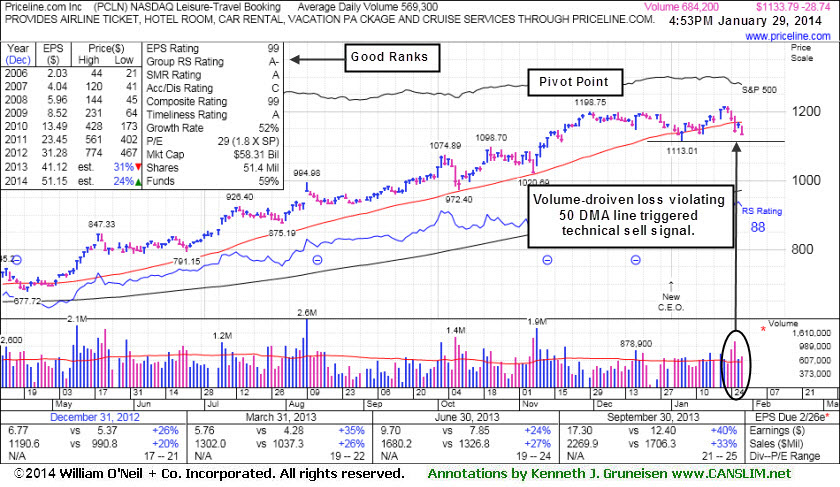
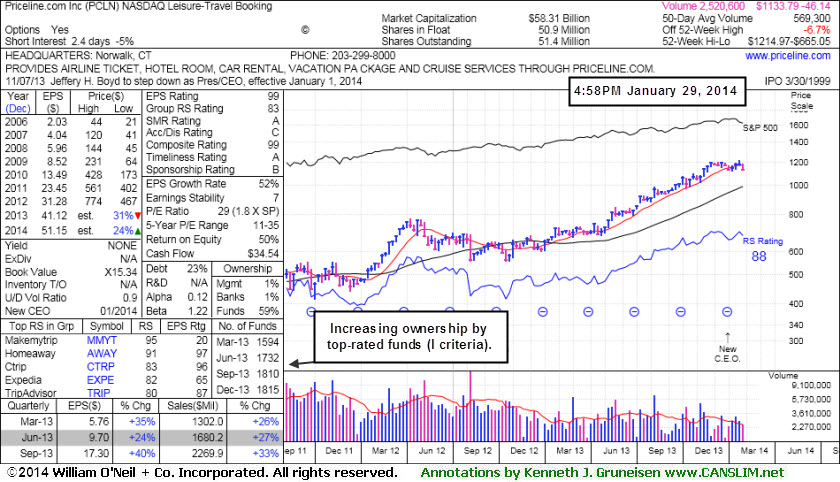
Violation of 50-Day Average After Failing to Trigger New Buy Signal - Wednesday, January 29, 2014
Priceline.com Inc (PCLN -$28.74 or -2.47% to $1,133.79) slumped further below its 50-day moving average (DMA) line today after volume-driven losses raised recent concerns. Its color code was changed to green and PCLN did not trigger a technical buy signal since recently featured in yellow. A subsequent violation of the prior low ($1,113.01 on 1/06/14) would raise greater concerns and may trigger a more worrisome technical sell signal. Disciplined investors watch for a proper technical buy signal before taking action and always limit losses if any stock falls more than -7% from their buy point.
PCLN reported earnings +40% on +33% sales revenues for the Sep '13 quarter versus the year-ago period, above the +25% minimum earnings guideline (C criteria) and improving after a slightly sub par Jun '13 report. The Leisure - Travel Booking firm has earned great ranks, including the highest possible rating of 99 for earnings Per Share (EPS). Its strong annual earnings history satisfies the A criteria.
Keep in mind, the investment system's biggest winning models were typically held by at least a few mutual funds and attracting many others. However, once a stock is very heavily owned by a long list of mutual funds, as is now the case with PCLN, investors should be especially cautious and alert for any technical sell signals or fundamental disappointments which could prompt a rush for the exits. The number of top-rated funds owning its shares rose from 1,594 in Mar '13 to 1,815 in Dec '13, and increasing interest is an encouraging sign concerning the I criteria.
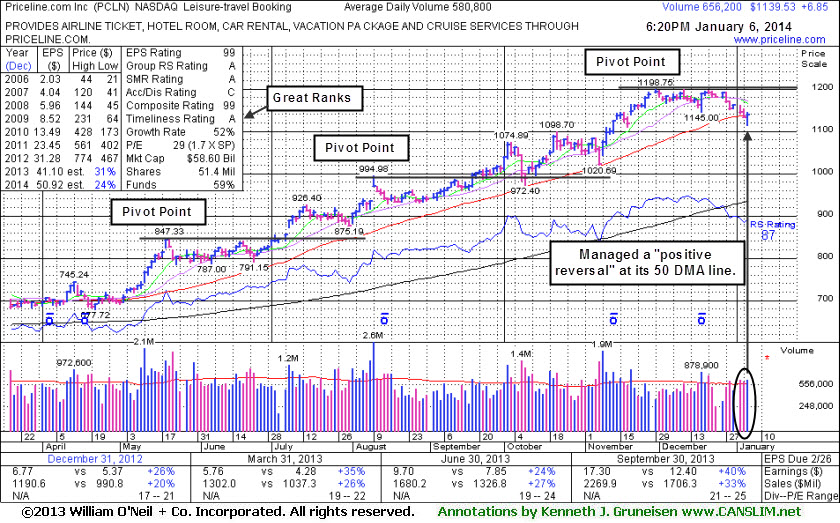
Managed Positive Reversal at 50-Day Moving Average Line - Monday, January 06, 2014
Priceline.com Inc. (PCLN +$6.85 or +0.60% to $1,139.53) managed a positive reversal today, finding support at its 50-day moving average (DMA) line. A subsequent violation of the session's low ($1,113.01) would raise greater concerns and may trigger a more worrisome technical sell signal. Volume-driven gains above the pivot point have not shown up since recently highlighted. Disciplined investors watch for a proper technical buy signal before taking action and always limit losses if any stock falls more than -7% from their buy point.
PCLN reported earnings +40% on +33% sales revenues for the Sep '13 quarter versus the year-ago period, above the +25% minimum earnings guideline (C criteria) and improving after a slightly sub par Jun '13 report. The Leisure - Travel Booking firm has earned great ranks, including the highest possible rating of 99 for earnings Per Share (EPS). Its strong annual earnings history satisfies the A criteria.
Keep in mind, the investment system's biggest winning models were typically held by at least a few mutual funds and attracting many others. However, once a stock is very heavily owned by a long list of mutual funds, as is now the case with PCLN, investors should be especially cautious and alert for any technical sell signals or fundamental disappointments which could prompt a rush for the exits. The number of top-rated funds owning its shares rose from 1,594 in Mar '13 to 1,783 in Dec '13, and increasing interest is an encouraging sign concerning the I criteria.
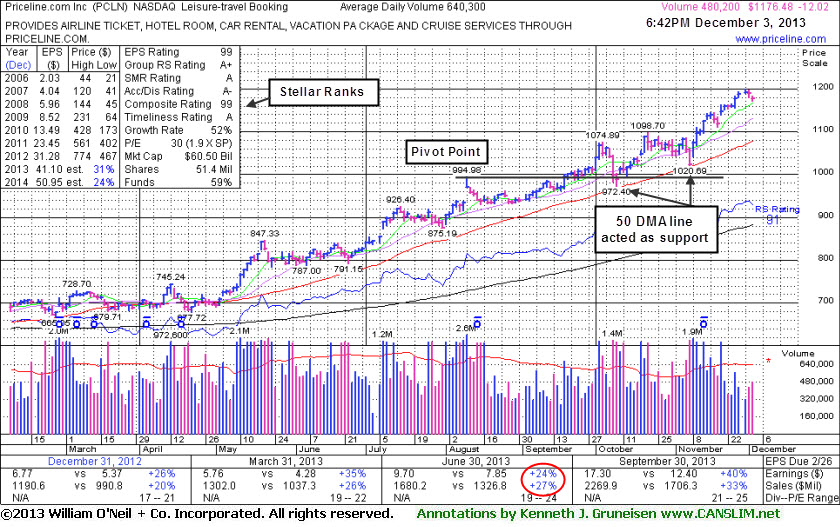
Extended From Any Sound Base Pattern - Tuesday, December 03, 2013
Priceline.com Inc. (PCLN -$12.02 or -1.01% to $1,176.48) pulled back today on below average volume. It wedged to new 52-week highs with recent gains during the Thanksgiving holiday-shortened week backed by below average volume. It found support at its 50-day moving average (DMA) line again on the last pullback, then rallied to new highs with a spurt of volume-driven gains without spending sufficient time consolidating to form a sound base pattern.
PCLN reported earnings +40% on +33% sales revenues for the Sep '13 quarter versus the year-ago period, improving after a slightly sub par Jun '13 report. When last shown in the FSU section on 9/19/13 with an annotated graph under the headline, "Rallied to New Highs Following Pullback to 50-day Average ", it was extended from any sound base. Earnings increased by +24% on +27% sales revenues for the Jun '13 quarter, just under the +25% minimum earnings guideline (C criteria). The Leisure - Travel Booking firm has earned great ranks, including the highest possible rating of 99 for earnings Per Share (EPS). Its strong annual earnings history satisfies the A criteria.
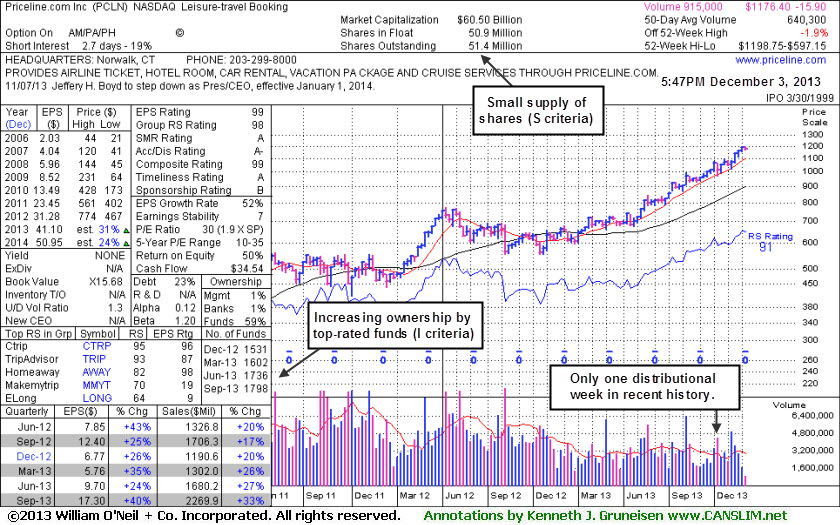
Keep in mind, the investment system's biggest winning models were typically held by at least a few mutual funds and attracting many others. However, once a stock is very heavily owned by a long list of mutual funds, as is now the case with PCLN, investors should be especially cautious and alert for any technical sell signals or fundamental disappointments which could prompt a rush for the exits. The number of top-rated funds owning its shares rose from 1,528 in Sep '12 to 1,798 in Sep '13, and increasing interest is an encouraging sign concerning the I criteria. Its current Up/Down Volume Ratio of 1.3 is an unbiased indication its shares have been under accumulation over the past 50 days.
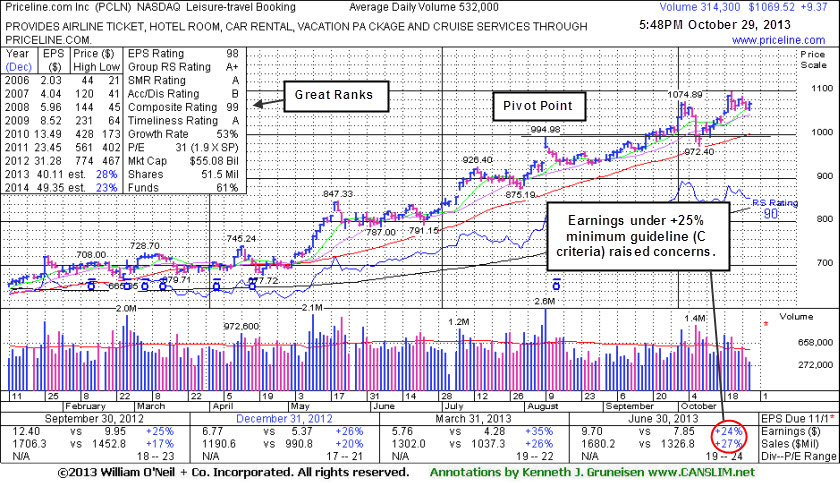
Rallied to New Highs Following Pullback to 50-day Average - Tuesday, October 29, 2013
Priceline.com Inc. (PCLN +$9.37 or +0.88% to $1,069.52) is hovering -2.7% off its 52-week high, holding its ground while extended from any sound base. PCLN was last shown in the FSU section on 9/19/13 with an annotated graph under the headline, "Wedging to New Highs With Gains Lacking Volume Conviction". Volume-driven gains came later, then it found support near its 50-day moving average (DMA) line on a pullback and subsequently rallied again to new highs with additional volume-driven gains.It is due to report its 3rd quarter 2013 financial results on November 7. It reported earnings +24% on +27% sales revenues for the Jun '13 quarter, just under the +25% minimum earnings guideline (C criteria), raising fundamental concerns. The Leisure - Travel Booking firm has earned great ranks, despite the latest slightly sub par results. Its strong annual earnings history satisfies the A criteria.
Keep in mind, the investment system's biggest winning models were typically held by at least a few mutual funds and attracting many others. However, once a stock is very heavily owned by a long list of mutual funds, as is now the case with PCLN, investors should be especially cautious and alert for any technical sell signals or fundamental disappointments which could prompt a rush for the exits. The number of top-rated funds owning its shares rose from 1,528 in Sep '12 to 1,753 in Sep '13, and increasing interest is an encouraging sign concerning the I criteria. Its current Up/Down Volume Ratio of 1.3 is an unbiased indication its shares have been under accumulation over the past 50 days.
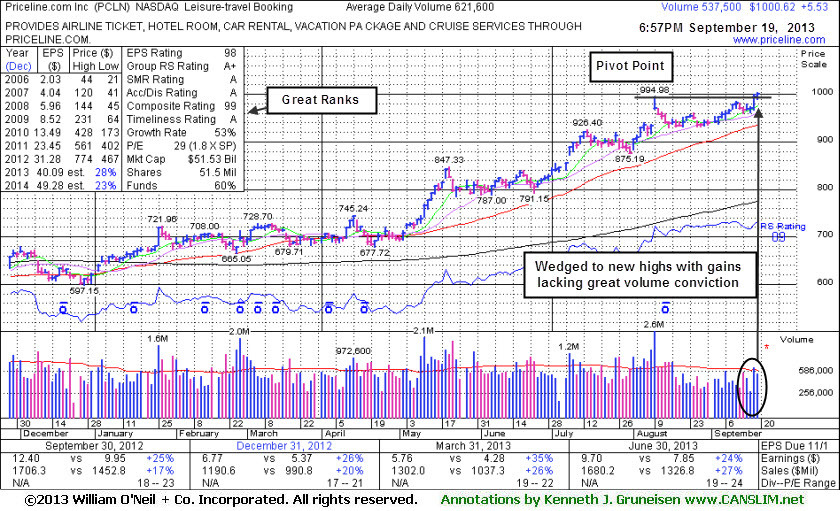
Wedging to New Highs With Gains Lacking Volume Conviction - Thursday, September 19, 2013
Priceline.com Inc. (PCLN +$5.53 or +0.56% to $1,000.62) wedged to a new high with today's gain backed by below average volume. Its pivot point cited was based on its 8/09/13 high plus 10 cents. To trigger a proper technical buy signal the volume must be at least +40% above average behind a stock's gains above its pivot point. Subsequent volume-driven gains may help to clinch a proper a new (or add-on) technical buy signal.PCLN was last shown in the FSU section on 8/19/13 with an annotated graph under the headline, " Following Slightly Sub Par Earnings Market Slump Also Raised Concerns". Not long ago it reported earnings +24% on +27% sales revenues for the Jun '13 quarter, just under the +25% minimum earnings guideline (C criteria), raising fundamental concerns. The Leisure - Travel Booking firm has earned stellar ranks, despite the latest quarter's slightly sub par results. Its strong annual earnings history satisfies the A criteria.
Keep in mind, the investment system's biggest winning models were typically held by at least a few mutual funds and attracting many others. However, once a stock is very heavily owned by a long list of mutual funds, as is now the case with PCLN, investors should be especially cautious and alert for any technical sell signals or fundamental disappointments which could prompt a rush for the exits. The number of top-rated funds owning its shares rose from 1,528 in Sep '12 to 1,717 in Jun '13, and increasing interest is an encouraging sign concerning the I criteria. Its current Up/Down Volume Ratio of 1.3 is an unbiased indication its shares have been under accumulation over the past 50 days.
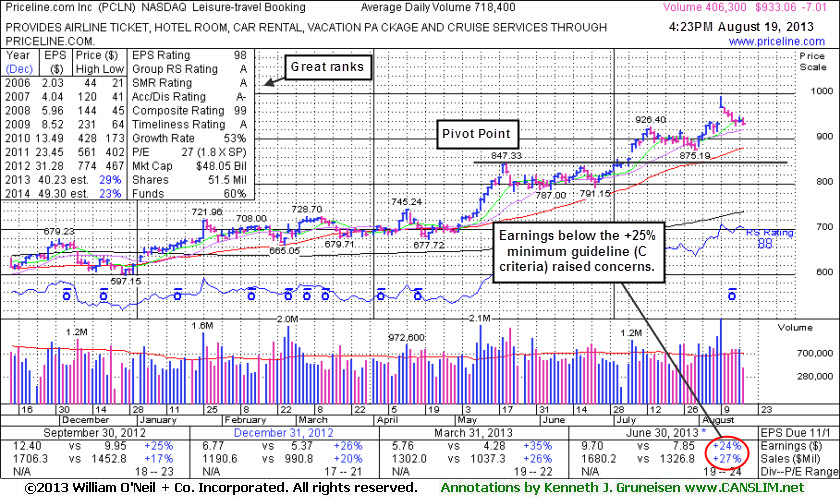
Following Slightly Sub Par Earnings Market Slump Also Raised Concerns - Monday, August 19, 2013
Priceline.com Inc. (PCLN -$6.94 or -0.74% to $933.13) is consolidating -6.2% off its 52-week high, trading above prior highs in the $926 area that define initial support to watch on pullbacks. Not long ago it reported earnings +24% on +27% sales revenues for the Jun '13 quarter, just under the +25% minimum earnings guideline (C criteria), raising fundamental concerns. Broader market conditions (M criteria) also have recently deteriorated, as noted in the market commentary since last Thursday,hurting the outlook for all stocks.
PCLN was last shown in the FSU section on 7/25/13 with an annotated graph under the headline, "Still Consolidating Well Above Prior Highs". The Leisure - Travel Booking firm has earned stellar ranks, despite the latest quarter's slightly sub par results. Its strong annual earnings history satisfies the A criteria.
Keep in mind, the investment system's biggest winning models were typically held by at least a few mutual funds and attracting many others. However, once a stock is very heavily owned by a long list of mutual funds, as is now the case with PCLN, investors should be especially cautious and alert for any technical sell signals or fundamental disappointments which could prompt a rush for the exits. The number of top-rated funds owning its shares rose from 1,528 in Sep '12 to 1,684 in Jun '13, and increasing interest is an encouraging sign concerning the I criteria. Its current Up/Down Volume Ratio of 1.4 is an unbiased indication its shares have been under accumulation over the past 50 days.
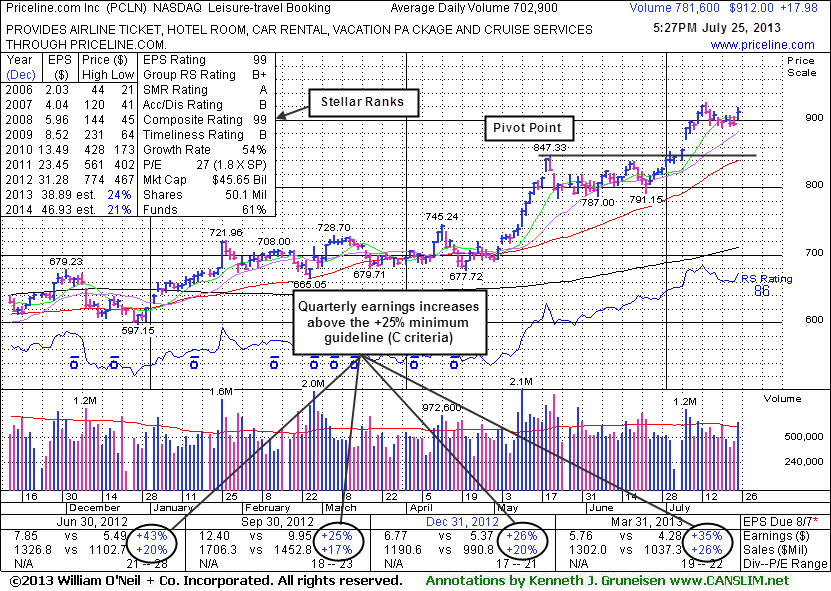
Still Consolidating Well Above Prior Highs - Thursday, July 25, 2013
Priceline.com Inc. (PCLN +$17.98 or +2.01% to $912.00) posted a gain today with above average volume. It has been consolidating in a tight range well above prior highs in the $847 area which define initial support to watch on pullbacks. PCLN was last shown in the FSU section on 7/09/13 with an annotated graph under the headline, "Posted 10th Consecutive Gain, Getting Extended From Base", as it rallied above its "max buy" level to new 52-week and all-time highs.The Leisure - Travel Booking firm has earned stellar ranks. Keep in mind that it is due to report earnings on August 8th. Volume and volatility often increase near earnings news. The company reported earnings +35% on +26% sales revenues for the latest quarter ended March 31, 2013 versus the year ago period, maintaining a strong earnings history that satisfies both the C and A criteria.
Keep in mind, the investment system's biggest winning models were typically held by at least a few mutual funds and attracting many others. However, once a stock is very heavily owned by a long list of mutual funds, as is now the case with PCLN, investors should be especially cautious and alert for any technical sell signals or fundamental disappointments which could prompt a rush for the exits. The number of top-rated funds owning its shares rose from 1,528 in Sep '12 to 1,639 in Jun '13, and increasing interest is an encouraging sign concerning the I criteria.
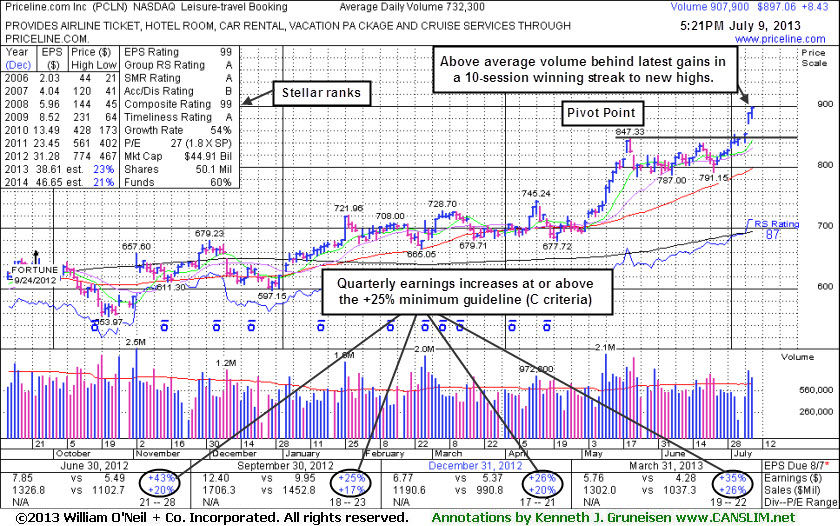
Posted 10th Consecutive Gain, Getting Extended From Base - Tuesday, July 09, 2013
Priceline.com Inc. (PCLN +$8.43 or +0.95% to $897.06) rallied above its "max buy" level and further with above average volume behind its 10th consecutive gain while hitting new 52-week and all-time highs. On the prior session it finished strong with a gain backed by +61% above average volume triggering a technical buy signal after highlighted in yellow with pivot point cited based on its 5/21/13 high plus 10 cents in the earlier mid-day report (read here). Prior to that it wedged higher with gains lacking great volume conviction while rising from an orderly base formed after clearing its 2012 highs with a streak of volume-driven gains in May. The Leisure - Travel Booking firm has earned stellar ranks. The company reported earnings +35% on +26% sales revenues for the latest quarter ended March 31, 2013 versus the year ago period, maintaining a strong earnings history that satisfies both the C and A criteria.PCLN had been dropped from the Featured Stocks list on 5/14/12 when an annotated graph was included under the headline, "Slump Created Overhead Supply That May Now Act As Resistance". Following that appearance it went through a long and deep consolidation below its 200-day moving average (DMA) line and subsequently rebounded to its prior highs one year later.
Keep in mind, the investment system's biggest winning models were typically held by at least a few mutual funds and attracting many others. However, once a stock is very heavily owned by a long list of mutual funds, as is now the case with PCLN, investors should be especially cautious and alert for any technical sell signals or fundamental disappointments which could prompt a rush for the exits. The number of top-rated funds owning its shares rose from 1,528 in Sep '12 to 1,615 in Mar '13, and increasing interest is an encouraging sign concerning the I criteria.
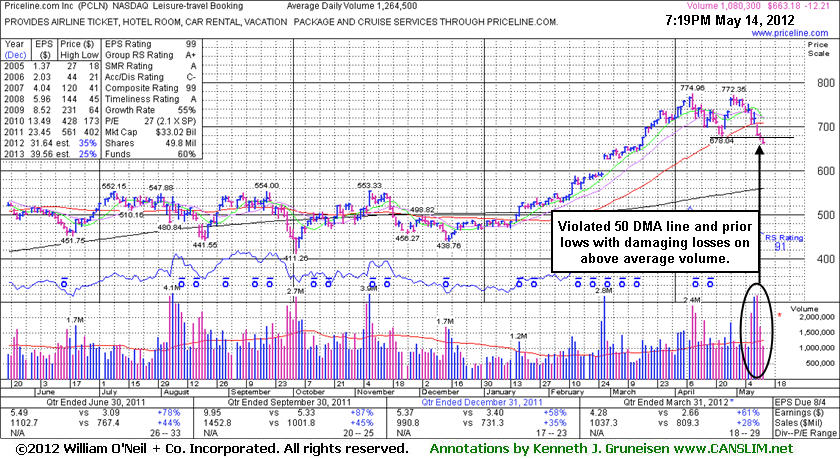
Slump Created Overhead Supply That May Now Act As Resistance - Monday, May 14, 2012
Priceline.com Inc. (PCLN -$12.21 or -1.81% to $663.18) slumped further below its 50-day moving average (DMA) line and prior low ($678.04 on 4/24/12), failing to rebound after damaging losses. Only a prompt rebound above its 50 DMA line would help its outlook, but it now faces resistance due to overhead supply up through the $774 level. Based on weak action it will be dropped from the Featured Stocks list tonight. Damaging losses amid widespread market weakness recently violated its 50-day moving average (DMA) line and raised concerns. Disciplined investors always limit losses by selling any stock if it falls more than -7% from their purchase price. Also, the M criteria may override all other promising criteria, since 3 out of 4 stocks follow the direction of the major averages.
PCLN announced earnings +61% on +28% sales revenues for the latest quarter ended March 31, 2012 versus the year ago period. The company has maintained a stellar earnings history that satisfies the C and A criteria. Keep in mind, the investment system's biggest winning models were typically held by at least a few mutual funds and attracting many others. However, once a stock is very heavily owned by a long list of mutual funds, as is now the case with PCLN, investors should be especially cautious and alert for any technical sell signals or fundamental disappointments which could prompt a rush for the exits. The number of top-rated funds owning its shares rose from 1,451 in Jun '11 to 1,470 in Mar '12, and increasing interest is an encouraging sign concerning the I criteria.
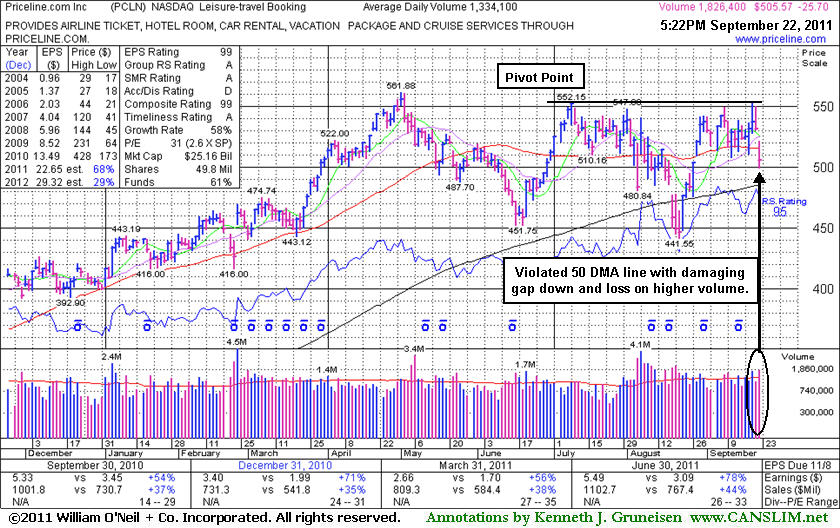
Gap Down Under 50-Day Average After No New Technical Buy Signal - Thursday, September 22, 2011
Priceline.com Inc. (PCLN -$25.70 or -4.84% to $505.57) gapped down today for a damaging loss amid widespread market weakness, violating its 50-day moving average (DMA) line and raising concerns while trading near recent lows. It was highlighted in the 9/20/11 mid-day report (read here) in yellow with pivot point cited based on its 7/08/11 high plus 10 cents. A volume-driven gain did not yet trigger a proper technical buy signal. It remains a worthy candidate for investors' watchlists. Meanwhile, the 200 DMA line and recent chart lows define the next important support to watch.
PCLN rebounded after a brief violation of its 200 DMA line during its choppy consolidation since it was dropped from the Featured Stocks list on 8/18/11. Its last appearance in this FSU section was on 8/12/11 under the headline, "Overhead Supply May Act As Resistance". It announced earnings +78% on +44% sales revenues (an impressive sequential acceleration) for the latest quarter ended June 30, 2011 versus the year ago period. The company has maintained a stellar earnings history that satisfies the C and A criteria.
Keep in mind, the investment system's biggest winning models were typically held by at least a few mutual funds and attracting many others. However, once a stock is very heavily owned by a long list of mutual funds, as is now the case with PCLN, investors should be especially cautious and alert for any technical sell signals or fundamental disappointments which could prompt a rush for the exits. The number of top-rated funds owning its shares rose from 1,354 in Sep '10 to 1,631 in June '11, and increasing interest is an encouraging sign concerning the I criteria.
Eventually a convincing volume-driven breakout could trigger a fresh new (or add-on) technical buy signal, but for now it needs to work its way up through overhead supply into the $550 area again. Also, the M criteria may override all other promising criteria, since 3 out of 4 stocks follow the direction of the major averages.
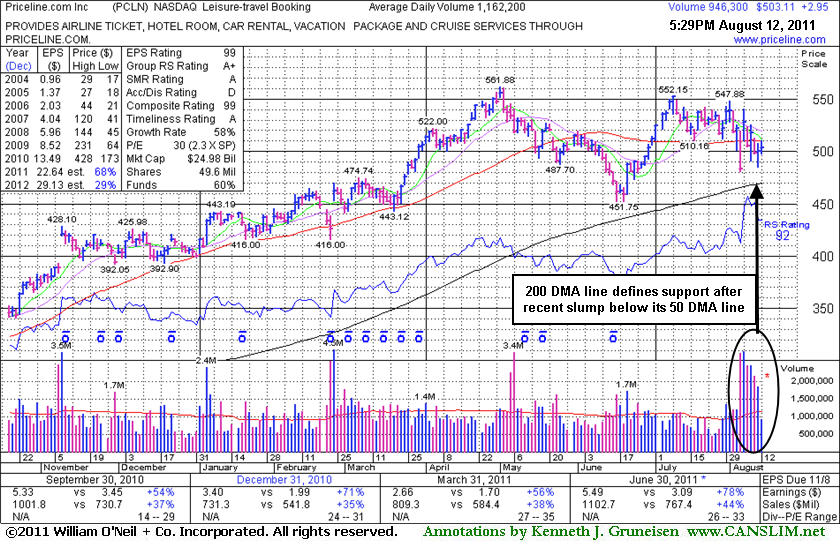
Overhead Supply May Act As Resistance - Friday, August 12, 2011
Priceline.com Inc. (PCLN +$2.95 or +0.59% to $503.11) remains under its 50-day moving average (DMA) line and has been unable to make headway above that important short-term average this week. In the 7/29/11 mid-day report its color code was changed to yellow with pivot point cited based on its 7/08/11 high ($552.15). Now it is consolidating -10.5% off its 52-week high, and yet it remains a worthy candidate for investors' watchlists. Meanwhile, the 200 DMA line and recent chart lows define the next important support to watch. Following its last appearance in this FSU section on 8/01/11 under the headline, "Strong Leisure - Travel Booking Firm Due to Report Earnings", it announced earnings +78% on +44% sales revenues (an impressive sequential acceleration) for the latest quarter ended June 30, 2011 versus the year ago period. That marked a
The company has maintained a stellar earnings history that satisfies the C and A criteria. Keep in mind, the investment system's biggest winning models were typically held by at least a few mutual funds and attracting many others. However, once a stock is very heavily owned by a long list of mutual funds, as is now the case with PCLN, investors should be especially cautious and alert for any technical sell signals or fundamental disappointments which could prompt a rush for the exits. The number of top-rated funds owning its shares rose from 1,351 in Sep '10 to 1,596 in June '11, and increasing interest is an encouraging sign concerning the I criteria.
Eventually a convincing volume-driven breakout could trigger a fresh new (or add-on) technical buy signal, but for now it needs to work its way up through overhead supply into the $550 area. Also, the M criteria may override all other promising criteria, since 3 out of 4 stocks follow the direction of the major averages.
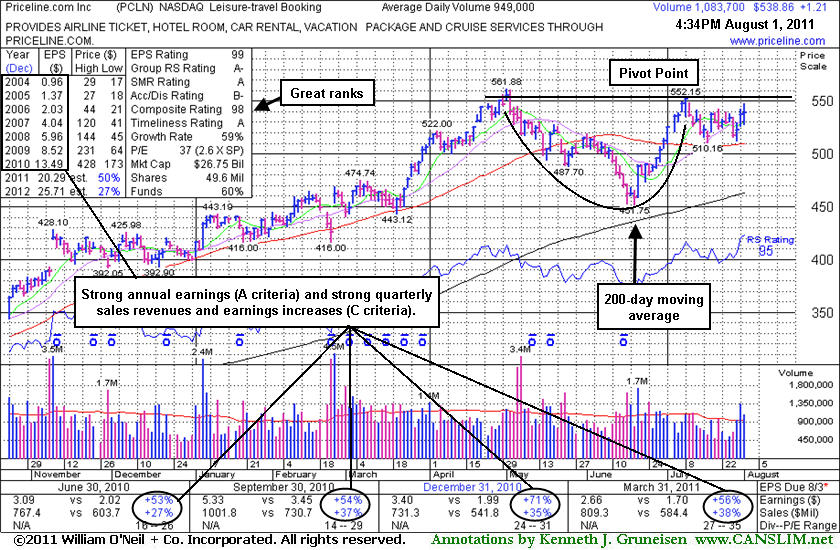
Strong Leisure - Travel Booking Firm Due to Report Earnings - Monday, August 01, 2011
Priceline.com Inc. (PCLN +$1.21 or +0.23% to $538.86) finished the session -4.1% off its 52-week high. In the 7/29/11 mid-day report its color code was changed to yellow with pivot point cited based on its 7/08/11 high. The company has maintained a stellar earnings history that satisfies the C and A criteria. It is due to report earnings for the quarter ended June 30, 2011 on August 3rd, and volume and volatility often increase near earnings news. Keep in mind, the investment system's biggest winning models were typically held by at least a few mutual funds and attracting many others. However, once a stock is very heavily owned by a long list of mutual funds, as is now the case with PCLN, investors should be especially cautious and alert for any technical sell signals or fundamental disappointments which could prompt a rush for the exits. The number of top-rated funds owning its shares rose from 1,351 in Sep '10 to 1,599 in June '11, and increasing interest is an encouraging sign concerning the I criteria.
Its last appearance in this FSU section with an annotated graph was on 5/19/11 under the headline, "50-Day Moving Average Line Tested This Week", as it was finding support at its 50-day moving average (DMA) line. That short-term average had been a reliable support level, but soon thereafter, a 50 DMA line violation and slump under a previously noted chart low ($493.67 on 5/17/11) raised more serious concerns and triggered worrisome technical sell signals. During its consolidation since dropped from the Featured Stocks list on 6/15/11 it found support well above its 200-day moving average (DMA) line, and its rebound above its 50 DMA line subsequently helped its outlook improve. A convincing volume-driven breakout could trigger a fresh new (or add-on) technical buy signal, but keep in mind that the M criteria may override all other promising criteria, since 3 out of 4 stocks follow the direction of the major averages.
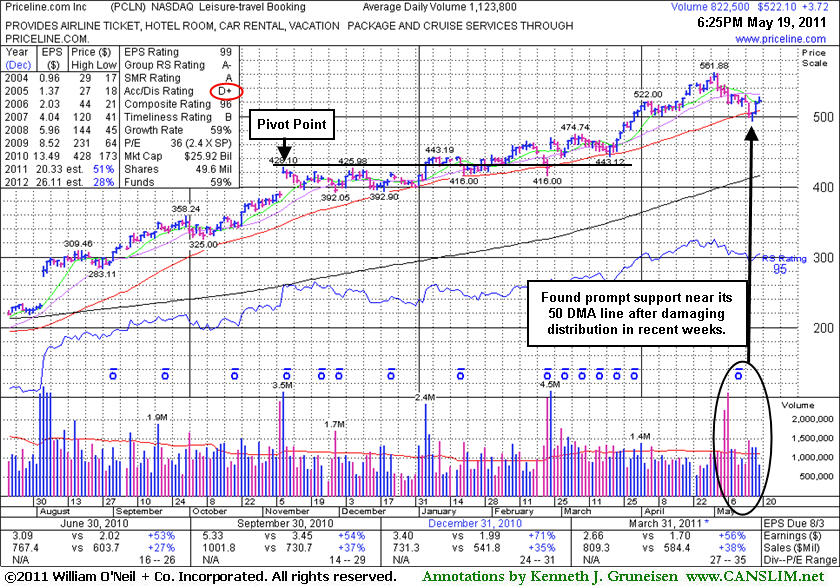
50-Day Moving Average Line Tested This Week - Thursday, May 19, 2011
Priceline.com Inc. (PCLN +$3.72 or +0.72% to $522.10) posted a small gain today on light volume. Technically, it found support at its 50-day moving average (DMA) line this week and posted gains with slightly above average volume. That short-term average has been a reliable support level this year. It is now -7.1% off its 52-week high, and any subsequent violation of the recent chart low ($493.67 on 5/17/11) would raise more serious concerns and trigger a worrisome technical sell signal. It could go on to produce more climactic gains, but disciplined investors know that it is usually best to avoid chasing extended stocks and watch for a sound base pattern and convincing technical buy signal. Patient investors may watch for a subsequent base to possibly form and be noted in the weeks ahead. If so, it will be noted and its color code will be changed to yellow again when a new pivot point is cited.
Distributional pressure in recent weeks ate into the gains it had tallied since its last appearance in this FSU section with an annotated graph on 4/20/11 under the headline, "Extended Leader Already Familiar Among Institutional Crowd", when it went on and rallied as high as $561.88. Keep in mind, the investment system's biggest winning models were typically held by at least a few mutual funds and attracting many others. However, once a stock is very heavily owned by a long list of mutual funds, as is now the case with PCLN, investors should be especially cautious and alert for any technical sell signals or fundamental disappointments which could prompt a rush for the exits. The number of top-rated funds owning its shares rose from 1,348 in Sep '10 to 1,523 in Mar '11, and increasing interest is an encouraging sign concerning the I criteria.
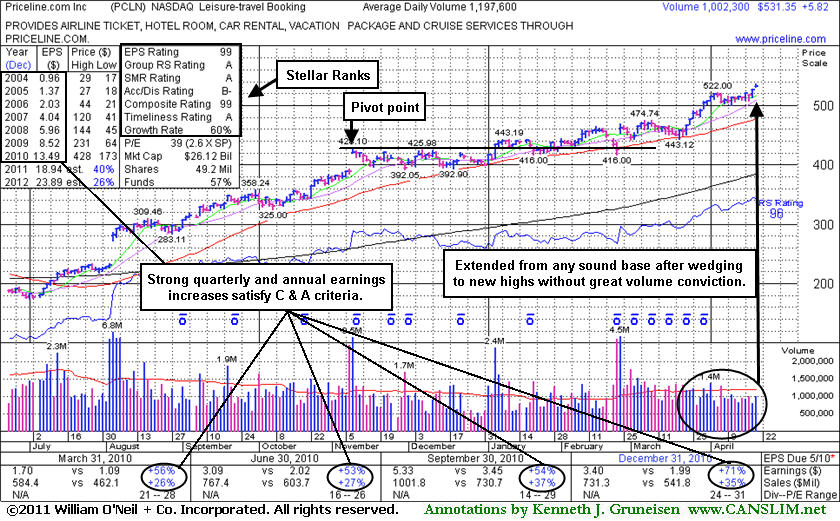
Extended Leader Already Familiar Among Institutional Crowd - Wednesday, April 20, 2011
Priceline.com Inc. (PCLN +$5.82 or +1.11% to $531.35) gapped up today for a new 52-week high, rallying or "wedging" higher without great volume conviction. It could go on to produce more climactic gains, but disciplined investors know that it is usually best to avoid chasing extended stocks. It has been repeatedly noted - "Extended from any sound base pattern. Its 50 DMA line has defined support throughout its advance." Since its last appearance in this FSU section with an annotated graph on 3/21/11 under the headline, "Positive Reversal For Small Gain Today Right at 50-Day Average", it found support its 50-day moving average (DMA) line. Most of its gains in the interim have come with near average or lighter than average volume. It also has not encountered any recent distributional pressure.
The number of top-rated funds owning its shares rose from 1,350 in Sep '10 to 1,491 in Mar '11, and increasing interest is an encouraging sign concerning the I criteria. The investment system's biggest winning models were typically held by at least a few mutual funds and attracting many others. However, once a stock is very heavily owned by a long list of mutual funds, as is now the case with PCLN, investors should be especially cautious and alert for any technical sell signals or fundamental disappointments which could prompt a rush for the exits.
Positive Reversal For Small Gain Today Right at 50-Day Average - Monday, March 21, 2011
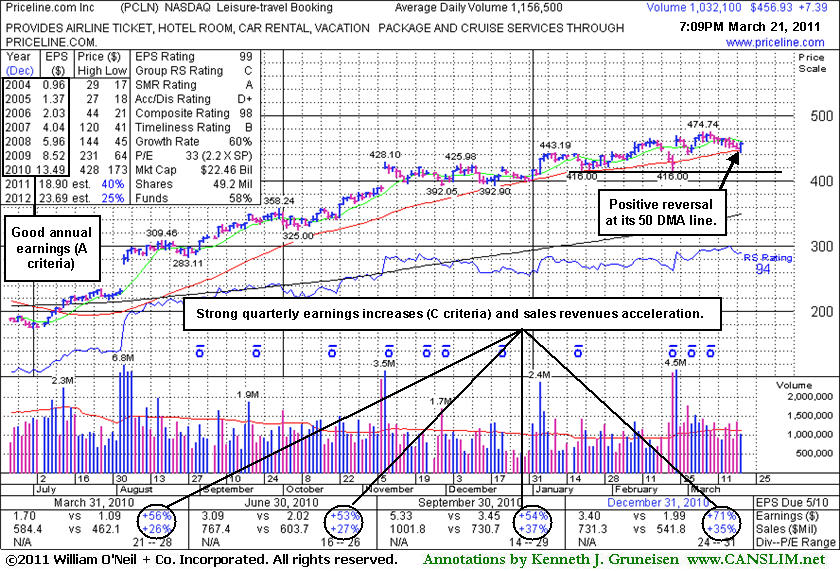
For now it deserves the bullish benefit of the doubt, however, disciplined investors avoid chasing extended stocks and might wait in the meanwhile for a sound new base of sufficient length to be noted. The M criteria is a critical factor to consider, as 3 out of 4 stocks will tend to go in the direction of the major averages. This stock has maintained a strong and steady annual earnings (A criteria) history. Fundamentally, its earnings increases have been impressive in the 8 most recent quarterly comparisons, solidly above the +25% guideline (C criteria), and recent comparisons showed earnings and sales acceleration. Return On Equity is reported at 44%, well above the 17% minimum guideline. Its relatively small supply of only 49.2 million shares (S criteria) can lead to great price volatility in the event of institutional accumulation or distribution. With respect to the investment system's I criteria, the number of top-rated funds owning its shares increased from 1,351 in Sep '10 to 1,473 in Dec '10.
Priceline.com Inc. (PCLN +$7.39 or +1.64% to $456.93) overcame early weakness after dipping below its 50-day moving average (DMA) line today, positively reversing near that important short-term average. It is perched only -3.8% off its 52-week high, but it has not built a sound new base pattern. Since its last appearance in this FSU section with an annotated graph on 2/14/11 under the headline, "Gains Helped Stock Gradually Get Extended", it endured heavy distributional pressure on February 23rd but halted its slide right at an earlier chart low $116.00 previously noted as a support level to watch below its 50 DMA line. It found prompt support near its short-term average and then blasted to a new high with heavy volume behind its subsequent gain on strong earnings news. However, this high-ranked Norwalk, CT-based firm in the strong-performing Leisure - Travel Booking industry did not make a lot of significant progress above prior highs, and it has been enduring mild distributional pressure in recent weeks.
Gains Helped Stock Gradually Get Extended - Monday, February 14, 2011
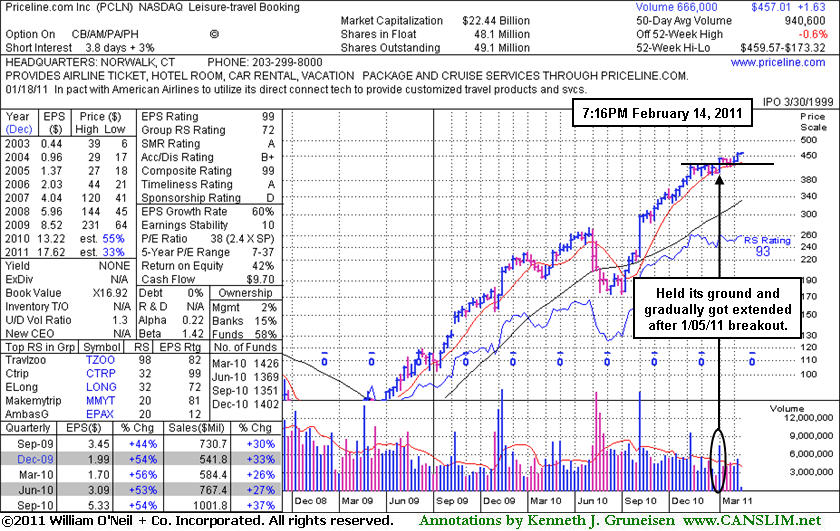
Priceline.com Inc. (PCLN +$1.63 or +0.36% to $457.01) is a high-ranked Norwalk, CT-based firm in the strong-performing Leisure - Travel Booking industry. It fared well following an 8/04/10 "breakaway gap" after a deep consolidation below its 200-day moving (DMA) line during the market's correction from the April 2010 highs. Shortly after it was summarized in detail in the January 2011 issue of CANSLIM.net News under the headline "Priceline Negotiating Late-Stage Base" it rallied from the riskier "late stage" base on 1/05/11 with a gain backed by +134% above average volume for a new all-time high, confirming a technical buy signal. It held its ground and gradually got extended, and is fair to say it built a solid base-on-base type pattern before its gain on 2/09/11 with +45% above average volume again helped it stair-step its way higher. The stock faces no resistance because there is no overhead supply,so it could then easily rise unhindered for more climactic gains. For now it deserves the bullish benefit of the doubt, however, disciplined investors avoid chasing extended stocks. What is of concern is that each meaningful new leg up has started with less conviction, and it has been a while since it endured a deeper or longer period of consolidation.
It has maintained a strong and steady annual earnings (A criteria) history. Fundamentally, its sales revenues and earnings increases have been impressive in the 4 most recent quarterly comparisons, solidly above the +25% guideline (C criteria). Return On Equity is reported at 42%, well above the 17% minimum guideline.Its relatively small supply of only 49.1 million shares (S criteria) can lead to great price volatility in the event of institutional accumulation or distribution. With respect to the investment system's I criteria is that the number of top-rated funds owning its shares increased from 1,351 in Sep '10 to 1,402 in Dec '10.
Priceline Negotiating Late-Stage Base - Sunday, January 02, 2011
| Priceline.com Inc. |
CLICK HERE to see the Profile Page for this stock with current details and historic information | |
|
Ticker Symbol: PCLN (NASDAQ) |
Industry Group: Leisure - Travel Booking |
Shares Outstanding: 49,100,000 |
|
Price: $399.55 1/02/2011 |
Day's Volume: 584,800 12/31/2010 |
Shares in Float: 48,100,000 |
|
52 Week High: $428.10 11/09/2010 |
50-Day Average Volume: 1,034,300 |
Up/Down Volume Ratio: 1.1 |
|
Pivot Point: $428.20 11/09/2010 high plus 10 cents |
Pivot Point +5% = Max Buy Price: $449.72 |
Web Address: http://www.priceline.com/ |

CANSLIM.net Profile: Priceline.com Inc. is a high-ranked Norwalk, CT-based firm in the strong-performing Leisure - Travel Booking industry. It has maintained a strong and steady annual earnings (A criteria) history. Fundamentally, its sales revenues and earnings increases have been impressive in the 4 most recent quarterly comparisons, solidly above the +25% guideline (C criteria). Return On Equity is reported at 42%, well above the 17% minimum guideline.
What to Look For and What to Look Out For: Gains above its pivot point with at least +50% above average volume would confirm a proper technical buy signal. One discouraging sign with respect to the investment system's I criteria is that the number of top-rated funds owning its shares decreased from 1,425 in Dec '09 to 1,347 in Sept '10. That gives investors a good reason to watch for subsequent price/volume action that provides more convincing new proof of accumulation by institutional investors like new highs (N criteria) on heavy volume certainly would. It may not break out without a cooperative backdrop in the major averages (M criteria) in the near-term.
Technical Analysis: PCLN may be considered a riskier "late stage" setup now, having stair-stepped its way higher after an 8/04/10 "breakaway gap" following a deep consolidation below its 200 DMA line during the market's correction from the April 2010 highs. The stock is consolidating on lighter volume just above its 50-day moving average (DMA) line and recent chart lows. It faces some resistance up through the $426-428 area. Beyond that level there is no overhead supply to act as resistance, so it could then easily rise unhindered for more climactic gains. Its relatively small supply of only 49.1 million shares (S criteria) can lead to great price volatility in the event of institutional accumulation or distribution.
PCLN previously appeared in the Featured Stock Update section on 2/18/10 under the headline "Big Gap Up Gain On 4 Times Average Volume" when triggering a technical buy signal while rising from a 9-week base. It was still color coded yellow on 3/10/10 when it made a subsequent FSU section appearance under the headline "Priceline Remains Perched Near All-Time Highs Following Latest Breakout", but its color code was changed to green after blasting above its "max buy" level. When damage began to mount it was noted and very soon dropped from the Featured Stocks list after the infamous May 6th "flash crash" when we noted - "Another damaging loss today on higher volume, closing in the upper half of its range after trading near its 200 DMA line at its intra-day low. Broader market action (M criteria) is normally expected to impact 3 out of 4 stocks, and widespread losses effectively ended the latest rally."
A summary of past coverage and the stock's subsequent action was published on 11/07/08 under the headline "Multiple Sell Signals Preceded Big Price Decline." That write-up discusses the stock's weak action after it had been dropped from the Featured Stocks list after its 200 DMA violation on July 2, 2008. Keep in mind that PCLN was first featured on Friday, November 09, 2007 in the CANSLIM.net Mid Day Breakouts Report after gapping up over the $100 threshold (read here).

Priceline Perched Near 52-Week High - Wednesday, April 28, 2010
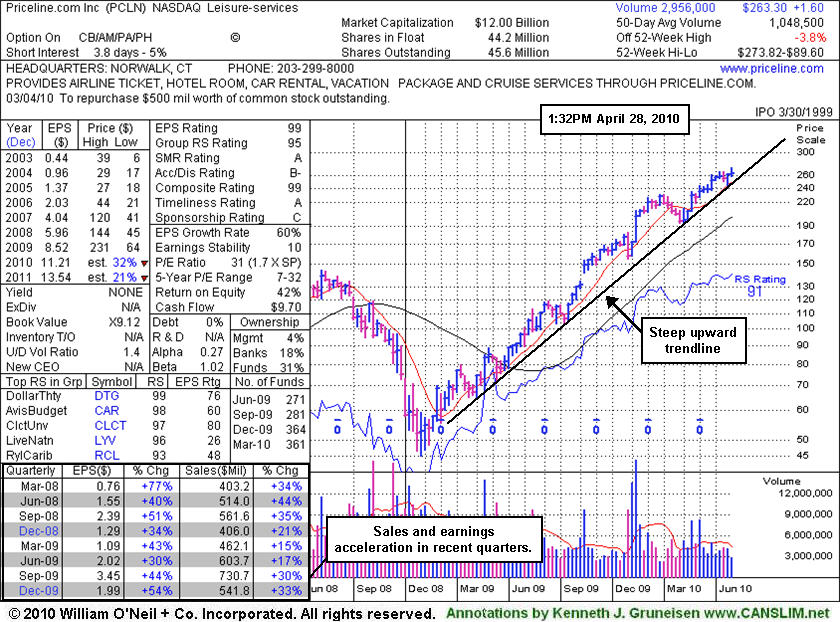
Priceline.com Inc. (PCLN -$2.52 or -0.95% to $261.78) is consolidating on lighter volume. It recently rallied for a considerable gain and new 52-week high with just above average volume following a brief consolidation above its 50-day moving average (DMA) line. It did not spend enough time consolidating to form a sound base pattern, aside from it being only a half-hearted push into new high ground. Still, this high-ranked Leisure-Services firm is has no overhead supply to act as resistance, so it can easily rise unhindered for more climactic gains. Its relatively small supply of only 45.6 million shares (S criteria) can lead to great price volatility in the event of institutional accumulation or distribution. Volume and volatility is often greater near earnings news, and the company is due to report its latest quarterly earnings on May 10th.
Disciplined investors avoid chasing stocks extended from a sound base. PCLN previously appeared in this FSU section on 2/18/10 under the headline "Big Gap Up Gain On 4 Times Average Volume" when triggering a technical buy signal while rising from a 9-week base. It was still color coded yellow on 3/10/10 when it made a subsequent FSU section appearance under the headline "Priceline Remains Perched Near All-Time Highs Following Latest Breakout", but its color code was changed to green after blasting above its "max buy" level.
A summary of past coverage and the stock's subsequent action was published on 11/07/08 under the headline "Multiple Sell Signals Preceded Big Price Decline." That write-up explained the stock's weak action after it had been dropped from the Featured Stocks list after its 200 DMA violation on July 2, 2008. Keep in mind that PCLN was first featured on Friday, November 09, 2007 in the CANSLIM.net Mid Day Breakouts Report after gapping up over the $100 threshold (read here).
New High Close With Today's Gain On Light Volume - Tuesday, March 30, 2010
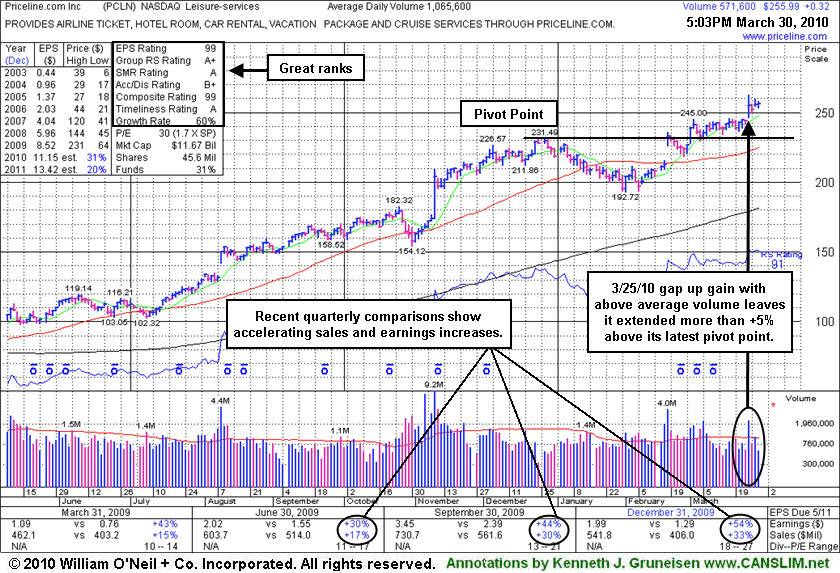
Priceline.com Inc. (PCLN +$0.32 or +0.13% to $255.99) posted a small gain today on light volume for a new high close. Its considerable gap up on 3/25/10 for a solid gain was backed by more than 2 times average volume, leaving this high-ranked Leisure-Services firm extended more than +5% above its latest pivot point. It has no resistance remaining due to overhead supply and can easily rise unhindered, but disciplined investors avoid chasing stocks outside of the investment system's guidelines. Its color code was changed to green after getting extended from its latest sound base pattern. Meanwhile, prior chart highs in the $245-246 area define an initial support level to watch above its earlier highs and its 50-day moving average (DMA) line.
PCLN previously appeared in this FSU section on 2/18/10 under the headline "Big Gap Up Gain On 4 Times Average Volume" when triggering a technical buy signal while rising from a 9-week base. It was still color coded yellow on 3/10/10 when it made a subsequent FSU section appearance under the headline "Priceline Remains Perched Near All-Time Highs Following Latest Breakout", but its color code was changed to green after blasting above its "max buy" level.
In the most current (C criteria) quarter ended December 31, 2009 its sales revenues and earnings showed impressive acceleration yet again with increases well above the +25% minimum guideline. A summary of CANSLIM.net's past coverage and the stock's subsequent action was published on 11/07/08 under the headline "Multiple Sell Signals Preceded Big Price Decline." That write-up explained the stock's weak action after it had been dropped from the Featured Stocks list after its 200 DMA violation on July 2, 2008. PCLN was first featured on Friday, November 09, 2007 in the CANSLIM.net Mid Day Breakouts Report after gapping up over the $100 threshold (read here).
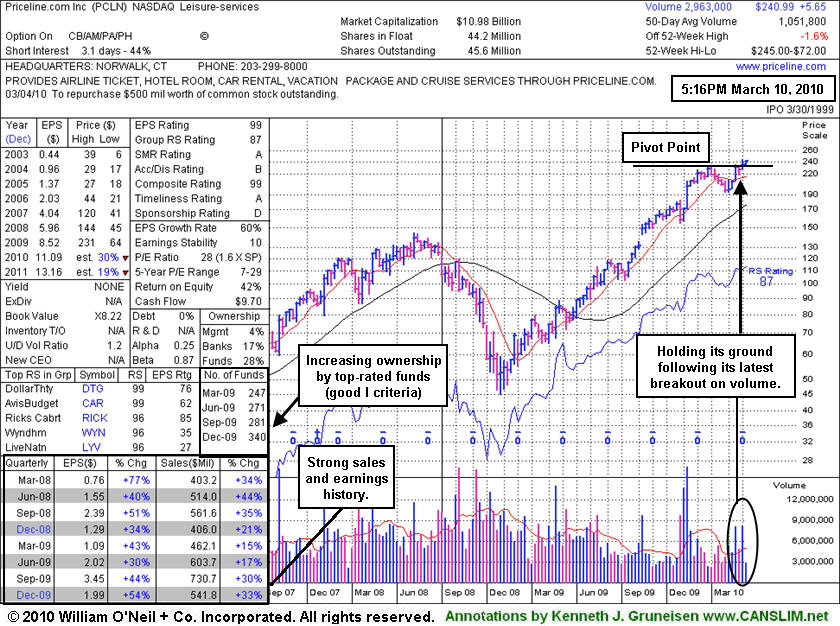
Priceline Remains Perched Near All-Time Highs Following Latest Breakout - Wednesday, March 10, 2010
Priceline.com Inc. (PCLN +$2.66 or +1.12% to $240.99) posted a small gain today with lighter than average volume. That leaves this high-ranked Leisure-Services firm perched above its pivot point but below its max buy level. No resistance remains due to overhead supply. Meanwhile, recent chart lows in the $218 area and its 50-day moving average (DMA) line are important support levels to watch on pullbacks. It has held its ground since last appearing in this FSU section on 2/18/10 under the headline "Big Gap Up Gain On 4 Times Average Volume" when triggering a technical buy signal while rising from a 9-week base.
In the most current (C criteria) quarter ended December 31, 2009 its sales revenues and earnings showed impressive acceleration yet again with increases well above the +25% minimum guideline. A summary of CANSLIM.net's past coverage and the stock's subsequent action was published on 11/07/08 under the headline "Multiple Sell Signals Preceded Big Price Decline." That write-up explained the stock's weak action after it had been dropped from the Featured Stocks list after its 200 DMA violation on July 2, 2008. PCLN was first featured on Friday, November 09, 2007 in the CANSLIM.net Mid Day Breakouts Report after gapping up over the $100 threshold (read here).
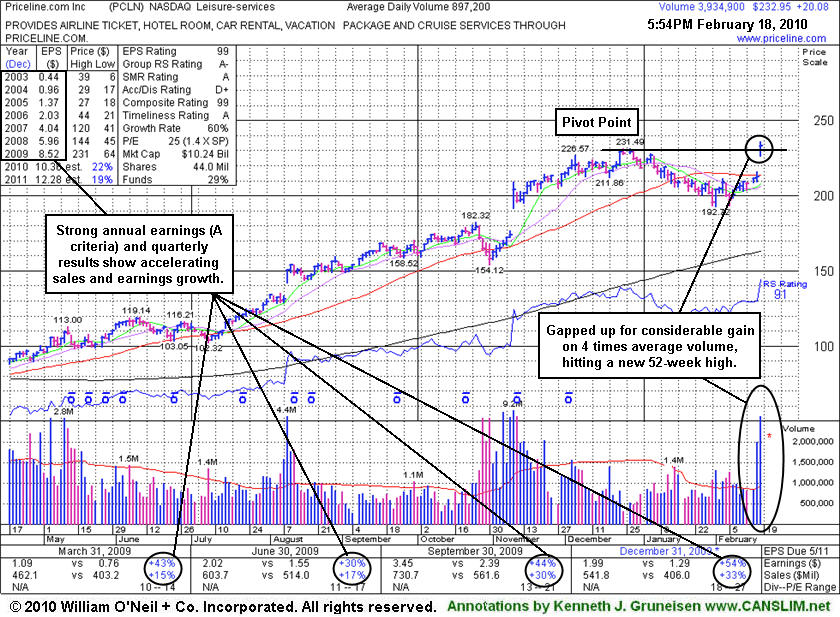
Big Gap Up Gain On 4 Times Average Volume - Thursday, February 18, 2010
Priceline.com Inc. (PCLN +$20.08 or +9.43% to $232.95) gapped up today and hit a new 52-week high, triggering a technical buy signal while rising from a 9-week base. It returned to the Featured Stocks page today and was color coded yellow with pivot point and max buy levels noted in the earlier mid-day report (read here). In the most current (C criteria) quarter ended December 31, 2009 its sales revenues and earnings showed impressive acceleration yet again with increases well above the +25% minimum guideline. It has powerfully rebounded above its 50 DMA line and is now free from resistance due to overhead supply. Annual earnings growth (the A criteria) has been strong. An overriding concern currently is the M criteria which argues against new buying efforts until a solid follow-through-day from at least one of the major averages occurs.
Now listed in the Leisure-Services group to better reflect its primarily travel-related online services, PCLN was listed in the Internet - eCommerce group in the past. A summary of CANSLIM.net's past coverage and the stock's subsequent action was published on 11/07/08 under the headline "Multiple Sell Signals Preceded Big Price Decline" . That write-up explained the stock's weak action after it had been dropped from the Featured Stocks list after its 200 DMA violation on July 2, 2008. PCLN was first featured on Friday, November 09, 2007 in the CANSLIM.net Mid Day Breakouts Report after gapping up over the $100 threshold (read here). The current action may be signalling the beginning of another considerable and sustained rally.
Multiple Sell Signals Preceded Big Price Decline - Friday, November 07, 2008
A very important technical tool that savvy investors have learned to incorporate in their technical analysis is the 200-day moving average (DMA) line. The 200 DMA line plays a pivotal role relative to a stock's price, and institutional investors (which concerns the I criteria) often support a stock they already own an interest in by buying more shares when that stock falls near its long-term average. When they do not step up and show support, a stock's deterioration below its 200 DMA can considered a technical sell signal. When a technical breakdown or violation takes place on heavy volume, it raises more serious concerns that large influential investors are rushing for the exits.
Priceline.com Inc. (PCLN +$7.50 or +15.93% to $54.57) is not a currently featured stock, however it may be worth another look at this Internet - eCommerce firm for any important lessons that can be learned from a previous market leader that has flashed multiple technical sell signals including a 200 DMA violation with losses on heavy volume. It was among the stronger performing issues in the first half of the year, however on June 9, 2008 the stock was noted in the CANSLIM.net After-Market Update as follows - "Loss today on near average volume, violating support at its 50 DMA line and an upward trendline while also falling under its pivot point, raising concerns" (read here). The stock formed a worrisome series of lower highs and on June 30, 2008 the stock was noted in the CANSLIM.net After-Market Update as follows - "Gapped down today and violated its recent chart lows in the $120 area, triggering another technical sell signal. The next key support level is its 200 DMA line (now $112.54) which closely coincides with an upward trendline" (read here). Technical sell signals were flashed again, and PCLN was dropped from the Featured Stocks list after its 200 DMA violation on July 2, 2008 (read here). It has fallen -57.93% since. PCLN was first featured on Friday, November 09, 2007 in the CANSLIM.net Mid Day Breakouts Report after gapping up over the $100 threshold (read here).
C A N S L I M | StockTalk | News | Chart | SEC | Zacks Reports | ![]()
![]()
![]()
Quiet Consolidation Continues Just Above 50-Day Moving Average Line - Monday, April 14, 2008
A very important technical tool that savvy investors have learned to incorporate in their technical analysis is the 50-day moving average (DMA) line. The 50 DMA line plays a pivotal role relative to a stock's price. If the price of a stock is above its 50 DMA then odds are that its 50 DMA will act as formidable support. Conversely, if the price is below its 50 DMA then the moving average acts as resistance. Healthy stocks sometimes trade under their 50 DMA lines briefly, but usually a strong candidate will promptly bounce and repair a 50 DMA violation. When a stock has violated its 50 DMA line and then lingers beneath it, the stock's outlook gets worse and worse as it spends a greater period of time trading under that important short-term average line. Once the 50 DMA line starts sloping downward it should also be acknowledged that the stock has been struggling for a while, and it might be time to reduce exposure and look for places to put that money to work in stronger buy candidates.
Priceline.com Inc. (-$0.02 or -0.02% to $120.10) gapped down on 4/11/08 and it has pulled back near important support at its 50 DMA line ($117.40 now) and prior chart highs. Disciplined investors would note that a proper new buy signal was not triggered by gains on volume above the latest pivot point of $129.34 cited when its color code was changed to yellow again on 3/24/08 as it appeared in the CANSLIM.net Mid-Day BreakOuts Report (read here). Volume, an important indicator of institutional action, was below average on its recent losses, which helped soften the damage. Priceline.com sports very healthy Earnings Per Share (EPS) and Relative Strength (RS) ratings, both an impressive 98. The company resides in the Internet E-commerce group which is currently ranked 79th of out the 197 Industry Groups list. That is outside of the top quartile of industry groups, and there is not a lot of other leadership in the group to help satisfy the L criteria now, which is a cause for concern. The number of top-rated funds with an ownership interest has risen from 191 funds in Jun '07 to 253 funds as of March '08, a compelling sign of increasing institutional interest (the I criteria). The stock is still a worthwhile buy candidate to have on investors' watch lists as long as it continues trading above its 50 DMA line. It faces limited resistance due to overhead supply and is only -8.8% below its 52-week high.
PCLN was first featured on Friday, November 9, 2007 in the CANSLIM.net Mid Day Breakouts Report (read here) with a $96.09 pivot point and a $100.89 maximum buy price. Since then, the stock went through a tough correction along with the broader market in January, yet it later rallied as much as +37% higher. Disciplined investors know to act quickly when stocks trigger technical sell signals and exhibit lackluster action.
C A N S L I M | StockTalk | News | Chart | SEC | Zacks Reports | ![]()
![]()
![]()

View all notes | Alert me of new notes | CANSLIM.net Company Profile
Leading Stock Tests Support - Monday, March 17, 2008
A very important technical tool that savvy investors have learned to incorporate in their technical analysis is the 50-day moving average (DMA) line. The 50 DMA line plays a pivotal role relative to a stock's price. If the price of a stock is above its 50 DMA then odds are that its 50 DMA will act as formidable support. Conversely, if the price is below its 50 DMA then the moving average acts as resistance. Healthy stocks sometimes trade under their 50 DMA lines briefly, but usually a strong candidate will promptly bounce and repair a 50 DMA violation. When a stock has violated its 50 DMA line and then lingers beneath it, the stock's outlook gets worse and worse as it spends a greater period of time trading under that important short-term average line. Once the 50 DMA line starts sloping downward it should also be acknowledged that the stock has been struggling for a while, and it might be time to reduce exposure and look for places to put that money to work in stronger buy candidates.
Priceline.com (PCLN -$6.55 or -6.27% to $111.08) gapped down and violated its 50 DMA line ($109.39 now) before a late day rally helped it close above that important level. Volume, an important indicator of institutional action, was only slightly above average which helped soften the damage. Priceline.com sports very healthy Earnings Per Share (EPS) and Relative Strength (RS) ratings, both an impressive 98. The company resides in the Internet E-commerce group which is currently ranked 59th of out the 197 Industry Groups list. Unfortunately, that is just outside of the top quartile of industry groups and there is not a lot of other leadership in the group to help satisfy the L criteria. The number of top-rated funds with an ownership interest has risen from 158 funds in March '07 to 235 funds as of December '07, a compelling sign of increasing institutional interest (the I criteria). Since the stock traded below its latest pivot point of $120.77 and prior chart resistance in the $120 area, its next important area of support is its 50 DMA line. The stock still deserves the benefit of the doubt due to the fact that it closed above support (its 50 DMA line) and is only -14.1% below its 52-week high. It should be noted that this stock has traded back into its prior base and below its latest pivot point which is not a healthy sign. Therefore, if PCLN closes below its 50 DMA line then a definitive technical sell signal will be triggered.
PCLN was first featured on Friday, November 9, 2007 in the CANSLIM.net Mid Day Breakouts Report (read here) with a $96.09 pivot point and a $100.89 maximum buy price. Since then, the stock has galloped a healthy +25%. Disciplined investors know to act quickly when stocks trigger technical sell signals and exhibit lackluster action.
C A N S L I M | StockTalk | News | Chart | SEC | Zacks Reports | ![]()
![]()
![]()

View all notes | Alert me of new notes | CANSLIM.net Company Profile
Solid Earnings Report Sparks High Volume Breakout - Friday, February 15, 2008
Group action plays a very important role, and experienced investors learn that they can increase their odds of picking a great winner by always focusing their buying efforts in the market's leading groups. The "L" criteria in tells us to choose leading companies in leading industry groups, thus it is suggested that investors choose from the top quartile of the 197 Industry Groups (listed in the paper most days on page B4). A classic example of the success enjoyed by many CANSLIM.net readers usually starts when an investor reads a CANSLIM.net report and buys a featured stock before it has risen above the pivot point by greater than 5%. After a stock breaks out above its pivot point, there is only a +5% window that investors have to purchase the stock under the proper guidelines. Once a stock rises above the "maximum buy price" the risk of a shake out balloons, meaning that even a normal retracement in the stock might force you to employ the 7-8% loss cutting rule. Much can be told by the stock's daily action in the weeks and months that follow a breakout. Typically, a light volume and orderly pullback suggests that the bulls remain in control. However, high volume pullbacks that violate support paint a totally different picture.
Priceline.com Inc. (PCLN +$21.63 or +21.16% to $123.86) gapped up and surged to a fresh multi-year high after the company reported their latest strong quarterly results. Volume surged by more than 5 times its average daily volume, a sign of heavy institutional buying demand that helps to satisfy the I criteria and trigger a technical buy signal. Priceline.com sports a very healthy Earnings Per Share (EPS) rating of 99 and an impressive Relative Strength (RS) rating of 97 and the company resides in the Internet E-commerce group which is currently ranked 67th of out the 197 Industry Groups list. Unfortunately, that is just outside of the top quartile of industry groups and there is not a lot of other leadership in the group to help satisfy the L criteria. The number of top-rated funds with an ownership interest has risen from 158 funds in March �07 to 233 funds as of December '07, a compelling sign of increasing institutional interest (the I criteria). The prior chart resistance in the $120 area now becomes the first area of key chart support to watch on pullbacks. Then, the next important support level is the stock's 50-day moving average (DMA) line ($107.73 now).
PCLN was first featured on Friday, November 9, 2007 in the CANSLIM.net Mid Day Breakouts Report (read here) with a $96.09 pivot point and a $100.89 maximum buy price. Since then, the stock has galloped a healthy +25% and is currently breaking out of its latest base. As a result, a new pivot point of $120.77 and new maximum buy price of $126.81 has emerged. Disciplined investors know to avoid buying stocks that reside in lackluster industry groups. However, if the group strengthens over the next few sessions and the stock does not trade above its maximum buy price it could be a strong leader worthy of consideration. In addition, as long as this breakout is not negated with a close back under prior high closes, odds favor even further gains.
C A N S L I M | StockTalk | News | Chart | SEC | Zacks Reports | ![]()
![]()
![]()

View all notes | Alert me of new notes | CANSLIM.net Company Profile
Priced Under 50 DMA Line, Encountering Resistance - Monday, February 04, 2008
A very important technical tool that savvy investors have learned to incorporate in their technical analysis is the 50-day moving average (DMA) line. The 50 DMA line plays a pivotal role relative to a stock's price. If the price of a stock is above its 50 DMA then odds are that its 50 DMA will act as formidable support. Conversely, if the price is below its 50 DMA then the moving average acts as resistance. Healthy stocks sometimes trade under their 50 DMA lines briefly, but usually a strong candidate will promptly bounce and repair a 50 DMA violation. When a stock has violated its 50 DMA line and then lingers beneath it, the stock's outlook gets worse and worse as it spends a greater period of time trading under that important short-term average line. Once the 50 DMA line starts sloping downward it should also be acknowledged that the stock has been struggling for a while, and it might be time to reduce exposure and look for places to put that money to work in stronger buy candidates.
Priceline.com Inc. (PCLN -$2.22 or -2.15% to $105.68) ended lower as this high-ranked leader continued strading under its 50 DMA line which is now acting as a resistance level. In December, PCLN reached a near term high slightly above $120 a share and then encountered heavy distribution in January which corresponded to heavy losses in the major averages. Priceline.com plunged nearly -30% before bouncing on January 22, 2008 when the Fed cut rates by -75 basis points to help stem the selling. The stock has been rebounding, but it has encountered resistance near its 50 DMA line and has struggled to close above that important threshold since its January 7th, 2008 violation of that important short term average.
Despite the broader market's weakness, PCLN still sports very healthy ranks. Both the Earnings Per Share and Relative Strength ratings for the stock are pegged at 99, the highest possible ratings. This stock was first featured on Friday, November 09, 2007 in the CANSLIM.net Mid Day Breakouts Report (read here) with a $96.09 pivot point and a $100.89 maximum buy price. The stock quickly rallied a very impressive +25% over the next few weeks before the market turned lower. The stock closed -12.4% below its 52-week high and is still within reasonable striking distance from reaching new highs. A lot will be determined when the stock reports its fourth quarter results on February 14, 2008. Until then, this high-ranked stock is a strong name that should be included on an active watchlist.
C A N S L I M | StockTalk | News | Chart | SEC | Zacks Reports | ![]()
![]()
![]()

View all notes | Alert me of new notes | CANSLIM.net Company Profile
Strong Leader Giving Reassuring Signs - Wednesday, November 21, 2007
Once again, the "L" criteria tells investors to choose leading companies in leading industry groups, and when we have identified a high-ranked leader with the proper characteristics we should wait and watch for gains on at least +50% above average volume as a confirmation that a breakout is attracting meaningful institutional sponsorship. A classic example of the success enjoyed by many CANSLIM.net readers usually starts when an investor reads a CANSLIM.net report and buys a featured stock before it has risen above the pivot point by greater than 5%. After a stock triggers a technical buy signal and is purchased, it is always important to employ the 7-8% loss cutting rule in the event of a downturn.
Priceline.com Inc. (PCLN +$1.17 or +1.14% to $103.44) edged higher on light volume, despite the broader market's negative bias, as this high-ranked leader continued consolidating its recent move. PCLN is a very strong market leader that sports very high ranks, and it hails from the Internet - eCommerce which is presently ranked 11th on the 197 Industry Groups list in the paper, satisfying the L criteria. Its Earnings Per Share (EPS) and Composite rating are both pegged at 99, the highest possible readings, and its Relative Strength (RS) rating is at a very solid 98. This stock was first featured on Friday, November 9, 2007 in the CANSLIM.net Mid Day Breakouts Report (read here) with a $96.09 pivot point and a $100.89 maximum buy price as it was triggering its latest technical buy signal. The popular travel site experienced a break-away gap after reporting a very quarterly results. The company said its earnings rose by +119% versus the third quarter of 2006 and its sales jumped by +33% vs the same period last year. After that break-away gap, the stock quickly got extended more than +5% above its pivot point, however it has recently consolidated under that "max buy" level on an intra-day basis. Keep in mind, though, that the market is presently in a correction. To satisfy the M criteria, at least one of the major averages needs to start a new confirmed rally with a follow-through day, then investors will have a green light to take action on worthy buy candidates. Meanwhile, PCLN is in healthy shape as long as it continues trading above its latest pivot point and its 50 DMA line. On the annotated graph included below, we have highlighted a recently reported instance of insider buying, after the stock charged to new highs for the year, which is a very nice reassurance. Whenever directors and people most familiar with the inner workings of a company are getting out their checkbooks and buying shares, it is considered a strong vote of confidence. Along with institutional buyers, insider buying can also be considered helpful in satisfying the I criteria of the investment system.
C A N S L I M | StockTalk | News | Chart | SEC | Zacks Reports | ![]()
![]()
![]()

View all notes | Alert me of new notes | CANSLIM.net Company Profile