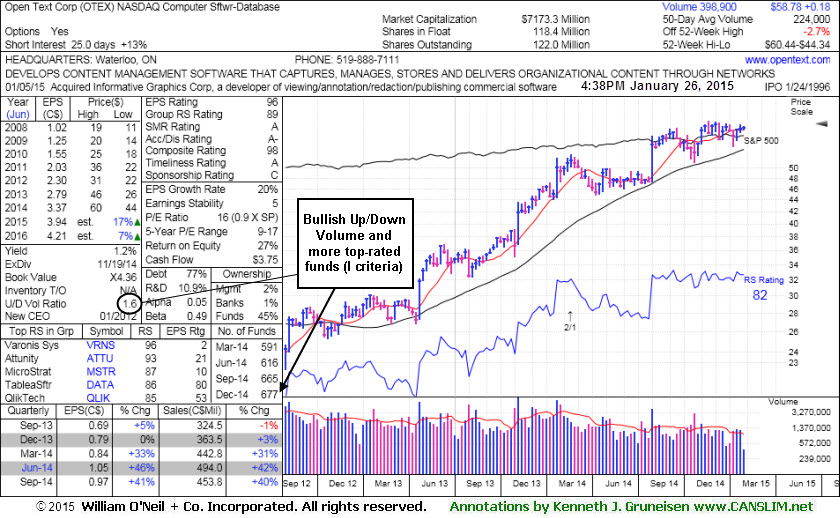
Churning Action Indicates Distributional Pressure - Monday, January 26, 2015
Open Text Corp (OTEX +$0.18 or +0.31% to $58.78) churned above average volume while tallying a negligible gain today. That is not encouraging action, and could be a sign that many willing sellers were offsetting a lot of buying efforts. It was highlighted in yellow with pivot point cited based on its 12/24/14 high in a "double bottom" base with an annotated daily graph in the mid-day report (read here).
Convincing volume-driven gains above the pivot point are needed to trigger a technical buy signal, meanwhile, disciplined investors know that patience is paramount. Very little resistance remains due to overhead supply up through the $60 level. A subsequent move into new high territory with conviction would be a sign of institutional buying demand.
This Ontario, Canada-based Computer Software - Database firm reported earnings +41% on +40% sales revenues for the Sep '14 quarter, its 3rd consecutive quarterly comparison above the +25% minimum guideline (C criteria), helping it better match the fact-based investment system's fundamental guidelines. There were some sub par quarterly comparisons since its last appearance in the FSU section on 7/20/11 with an annotated graph under the headline, "Holding Ground Since Negative Reversal Following Breakout. Its 7/13/11 gain with volume +187% above average had confirmed a technical buy signal, but it soon ran into trouble and went through a long and deep consolidation.
The number of top-rated funds owning OTEX rose from 591 in Mar '14 to 677 in Dec '14. Its current Up/Down Volume Ratio of 1.6 is another reassuring sign concerning the I criteria. It has maintained a very good annual earnings (the A criteria) history.
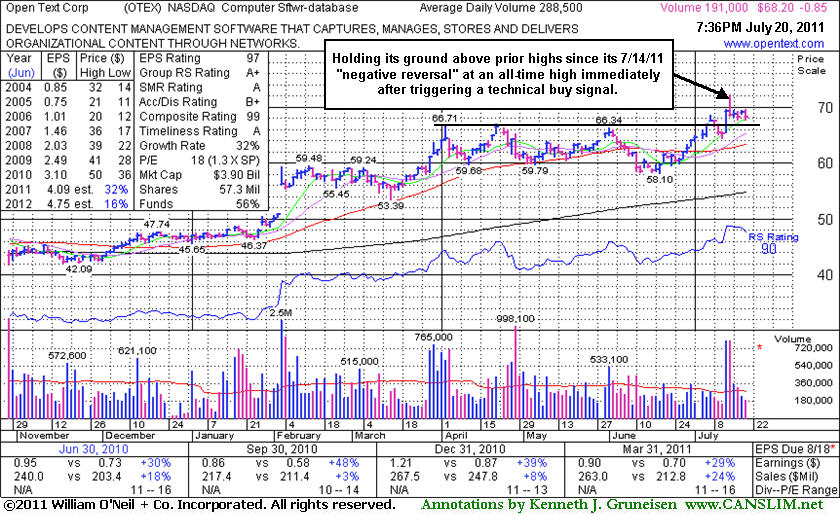
Holding Ground Since Negative Reversal Following Breakout - Wednesday, July 20, 2011
Open Text Corp (OTEX -$0.85 or -1.23% to $68.20) is holding its ground above its pivot point and prior chart highs that were a stubborn resistance level. Volume totals have been cooling since its "negative reversal" on 7/14/11 after hitting a new all-time high. Its 7/13/11 gain with volume +187% above average had confirmed a technical buy signal. Its last appearance in the FSU section was on 6/24/11 with an annotated graph under the headline, "50-Day Average Acting as Resistance", while its short-term average, the 50-day moving average (DMA) line (the red line), was acting as resistance following earlier damaging losses.
The number of top-rated funds owning its shares rose from 542 in Sep '10 to 604 in Jun '11, a reassuring sign concerning the I criteria. It has a very good annual earnings (the A criteria) history. The 4 latest quarterly earnings increases have been reported above the +25% guideline of the investment system. This Ontario, Canada-based Computer Software - Database firm's sales revenues increased by +24% in the quarter ended March 31, 2011 versus the year ago period. Sales revenues were previously noted at only in the +3-8% range in the Sep '10 and Dec '10 quarters.
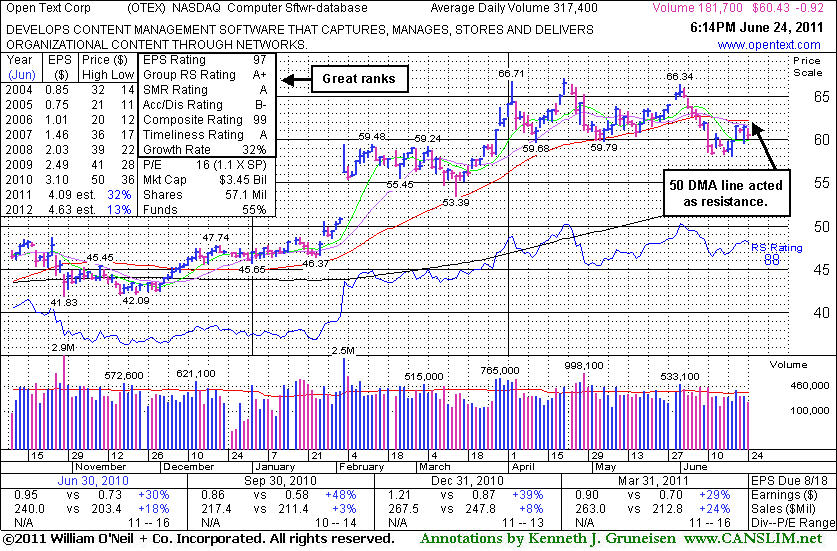
50-Day Average Acting as Resistance - Friday, June 24, 2011
Open Text Corp's (OTEX -$0.92 or -1.50% to $60.43) short-term average, the 50-day moving average (DMA) line, has acted as resistance recently. It faces overhead supply up through $66 after trading at higher levels in recent months. Gains above its 50 DMA line are needed for its outlook to improve, technically. Any deterioration under recent lows near $58 would trigger more worrisome sell signals. Its last appearance in the FSU section was on 6/02/11 with an annotated graph under the headline, "Fresh Proof of Demand is Needed to Confirm Technical Buy Signal". That analysis mentioned, "Higher than average volume without great price progress may be a sign it is encountering distributional pressure near prior resistance in the $66-67 area", and also added, "Disciplined investors will resist the urge to get in early, knowing that proof of heavy institutional buying demand driving prices to new highs is the critical technical 'buy signal' to wait for before taking action." It failed to break out, then slumped below its 50 DMA line.The number of top-rated funds owning its shares rose from 542 in Sep '10 to 581 in Mar '11, a reassuring sign concerning the I criteria. It has a very good annual earnings (the A criteria) history. The 4 latest quarterly earnings increases have been reported above the +25% guideline of the investment system. This Ontario, Canada-based Computer Software - Database firm's sales revenues increased by +24% in the quarter ended March 31, 2011 versus the year ago period. Sales revenues were previously noted at only in the +3-8% range in the Sep '10 and Dec '10 quarters."
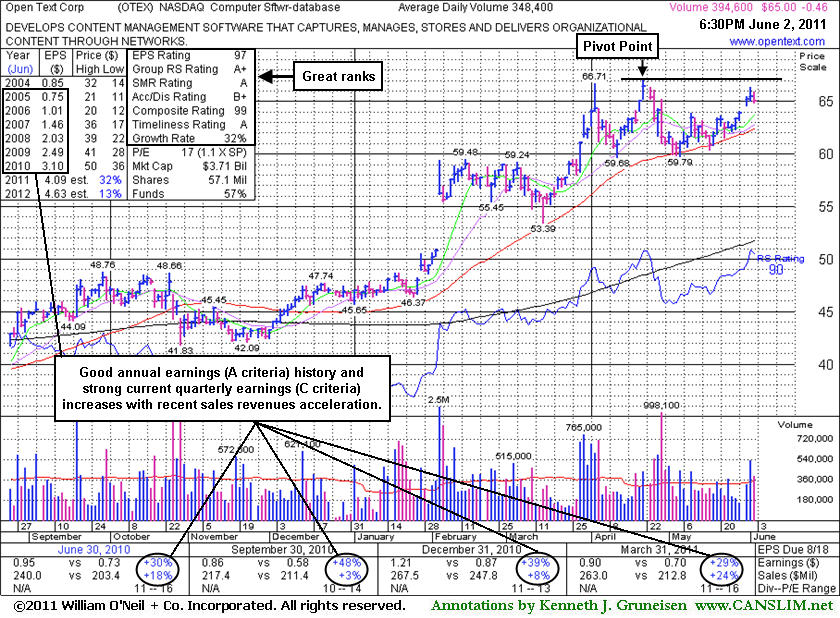
Fresh Proof of Demand is Needed to Confirm Technical Buy Signal - Thursday, June 02, 2011
Open Text Corp (OTEX -$0.46 or -0.70% to $65.00) found support near prior highs and above its 50-day moving (DMA) line during its recent consolidation. Higher than average volume without great price progress may be a sign it is encountering distributional pressure near prior resistance in the $66-67 area. The number of top-rated funds owning its shares rose from 542 in Sep '10 to 575 in Mar '11, a reassuring sign concerning the I criteria. Its Up/Down Volume Ratio of 1.7 is another unbiased indication of recent accumulation. The daily graph below illustrates the high-ranked leader's current set-up. Disciplined investors will resist the urge to get in early, knowing that proof of heavy institutional buying demand driving prices to new highs is the critical technical "buy signal" to wait for before taking action.
In the 6/01/11 mid-day report a weekly graph was included (read here) as its color code was changed to yellow and it was noted - "With pivot point cited based on its high plus 10 cents. No resistance remains from overhead supply, however a breakout on volume is still needed to confirm a proper new technical buy signal. It has a very good annual earnings (the A criteria) history. The 4 latest quarterly earnings increases have been reported above the +25% guideline of the investment system. This Ontario, Canada-based Computer Software - Database firm's sales revenues increased by +24% in the quarter ended March 31, 2011 versus the year ago period. Sales revenues were previously noted at only in the +3-8% range in the Sep '10 and Dec '10 quarters."
High Ranked Computer Sopftware Firm - Thursday, April 24, 2008
Open Text (OTEX -$0.46 or -1.41% to $33.02) has grown its earnings by above the +25% guideline in the past four quarters, satisfying the C criteria. It tested support at its 50 DMA line today, ending near the middle of its intra-day range with a 4th consecutive loss on light volume. Featured in the 4/16/08 CANSLIM.net Mid-Day BreakOuts Report (read here). It is clear of almost all overhead supply, trading near highs after a 5-month base. The high-ranked leader has been talked about as an acquisition candidate, a point noted in a 4/10/08 "New America" column in the paper (read here). Good annual and quarterly earnings increases and high ranks. Based on weak technical action it was previously dropped from the Featured Stocks list on 1/07/08. It was featured in the December 2007 CANSLIM.net News (see here), however a proper technical buy signal was not triggered after that appearance (as a set up).C A N S L I M | StockTalk | News | Chart | SEC | Zacks Reports | ![]()
![]()
![]()
View all notes | Alert me of new notes | CANSLIM.net Company Profile
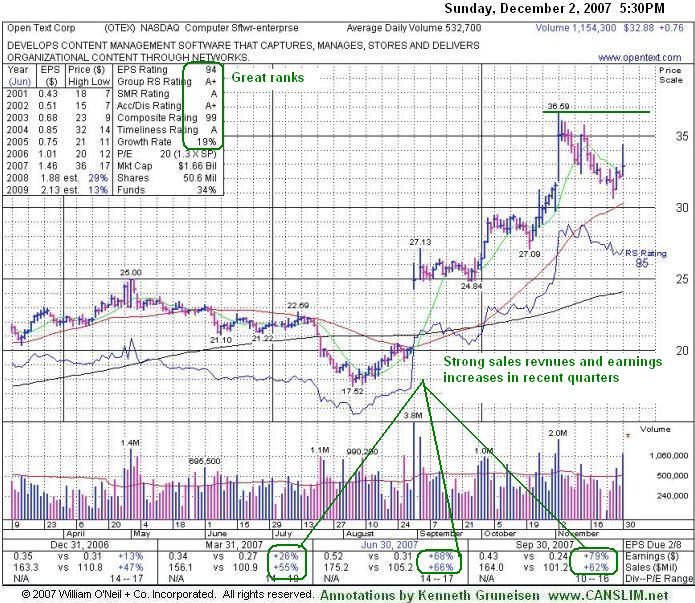
Software Firm Recently Cleared Multi-Year Highs - Sunday, December 02, 2007
|
Open Text Corporation |
||
|
Ticker Symbol: OTEX (NASDAQ) |
Industry Group: Computer Software Enterprise |
Shares Outstanding: 50,600,000 |
|
Price: $32.88 11/30/2007 |
Day's Volume: 1,154,300 11/30/2007 |
Shares in Float: 46,600,000 |
|
52 Week High: $36.59 11/2/2007 |
50-Day Average Volume: 532,700 |
Up/Down Volume Ratio: 2.0 |
|
Pivot Point: $36.69 11/2/2007 high plus $0.10 |
Pivot Point +5% = Max Buy Price: $38.52 |
Web Address: http://www.opentext.com |
C A N S L I M | StockTalk | News | Chart | SEC | Zacks Reports | ![]()
![]()
![]()
View all notes | Alert me of new notes | CANSLIM.net Company Profile
CANSLIM.net Profile: Open Text Corporation develops, markets, sells, and supports Enterprise Content Management (ECM) solutions. The company's ECM solutions help customers manage critical business content, as well as assist companies with the management of their content revisions, approvals to archiving, and compliance with regulatory requirements. Its principal product, Livelink, enables corporations to manage traditional forms of content, such as images, office documents, graphics, and drawings, as well as to manage electronic content, including Web pages, email, and video. The company has strategic alliances with Microsoft Corporation, Oracle Corporation, and SAP AG. The company was founded in 1991 and is headquartered in Waterloo, Canada. Open Text has grown its earnings and sales revenues by above the +25% guideline in the past three quarters. The company hails from the Computer Software Enterprise group which is presently ranked 9th on the 197 Industry Groups list, which places it in the much coveted top quartile of industry groups, satisfying the L criteria. The number of top-rated funds with an ownership interest has grown from 78 funds in June Ĺ07 to 84 funds as of September '07, a sign of increasing institutional interest (the I criteria).
What to Look For and What to Look Out For: Watch for a new proper technical buy signal to be triggered with convincing gains on high volume before initiating any new positions. You are wise to wait for that blast of buying as proof institutional demand is truly present and capable of leading to a sustained advance. It important to note that this could be days or even weeks away, or it might never materialize. Meanwhile, there is no way of knowing if the stock might spend a much longer time consolidating after its recent advance. As long as this issue continues trading above chart support at its 50-day moving average (DMA) line the action remains healthy. However, if the bears show up and send this issue below its 50 DMA line, then it would technically be showing signs of deterioration which could be an ominous sign. It is important to adhere to the recommended 7%-8% guideline for cutting losses properly.
Technical Analysis: This stock recently found support above its 50 DMA line and a 3 month upward trendline. In order for this stock to trigger a technical buy signal it must trade and close above its pivot point on at least +50% above average volume. Until then, this high ranked stock should remain on an active watch list. Note that it recently cleared its all-time highs in the $32 area from back in 2004, which is a long-term bullish indication.