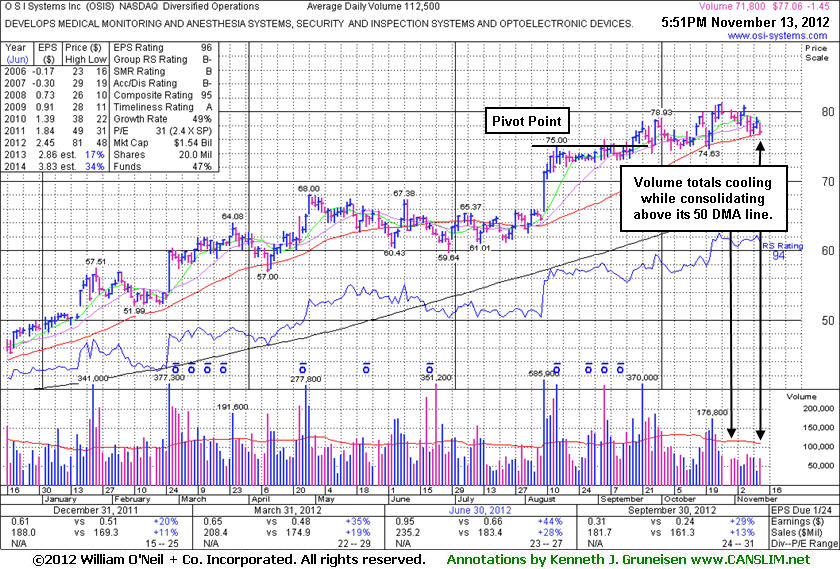
50-Day Moving Average Line Defines Important Support - Tuesday, November 13, 2012
O S I Systems Inc (OSIS -$1.45 or -1.85% to $77.06) is consolidating above its 50-day moving average (DMA) line, an important support level. A violation of that short-term average may trigger a technical sell signal. It has not formed a sound new base pattern. Its last appearance in this FSU section was on 10/18/12 with an annotated daily graph under the headline, "Few Investors Heading For Exits While Perched At High". Volume totals have been cooling in recent weeks while holding its ground, a sign that very few investors have been heading for the exits. 0It reported earnings +29% on +13% sales revenues for the quarter ended September 30, 2012 versus the year ago period, above the +25% minimum earnings guideline (C criteria) for a 3rd consecutive quarterly comparison. Its annual earnings (A criteria) growth history has also been very strong. Ownership by top-rated funds rose from 281 in Sep '11 to 314 in the Sep '12 quarter, a reassuring sign concerning the I criteria.
Few Investors Heading For Exits While Perched At High - Thursday, October 18, 2012
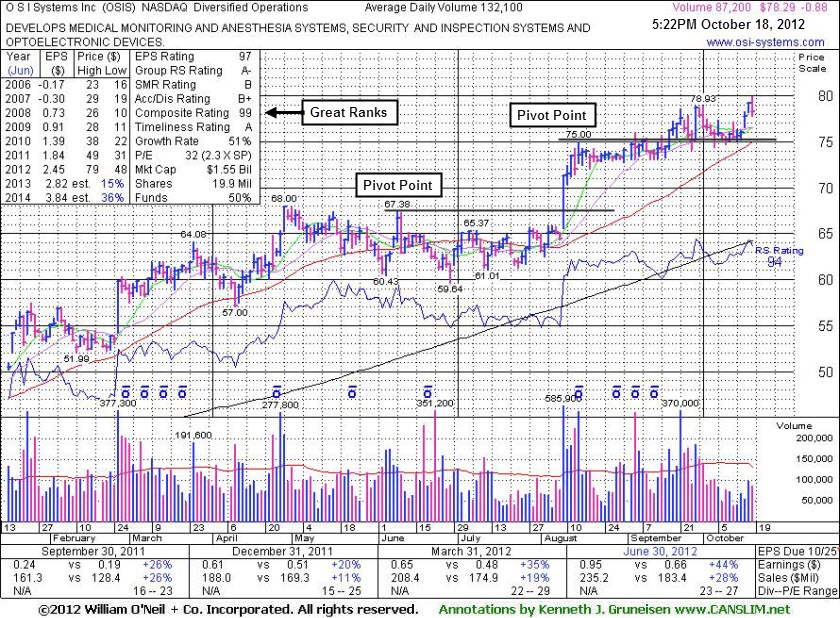
O S I Systems Inc (OSIS -$0.88 or -1.11% to $78.29) touched a new 52-week high today but reversed into the red for a small loss on below average volume. It ended just below its "max buy" level. Volume totals have been cooling in recent weeks while holding its ground, a sign that very few investors have been heading for the exits.
Its last appearance in this FSU section was on 9/14/12 with an annotated daily graph under the headline, "Encountered Mild Distributional Pressure in Tight Range Near Highs", as it encountered mild distributional pressure after a new pivot point was cited based on its 8/15/12 high plus 10 cents. Subsequent volume-driven gains clinched a new (or add-on) technical buy signal. Near term support is at its 50-day moving average (DMA) line (now $74.97).
It will hold its quarterly conference call on Tuesday, October 23, 2012 at 9:00AM PT (12:00PM ET) to discuss its results for the quarter ended September 30, 2012. It has shown sequentially stronger sales revenues increases and earnings increases in the latest quarters, including earnings +44% on +28% sales revenues for the quarter ended June 30, 2012 versus the year ago period. Improving from earnings +20% on +11% sales revenues for the quarter ended December 31, 2011. Such acceleration in its growth rate was previously noted as a very encouraging sign. Its annual earnings (A criteria) growth history has also been very strong.
Ownership by top-rated funds rose from 281 in Sep '11 to 314 in the Sep '12 quarter, a reassuring sign concerning the I criteria. As always, limit losses if any stock ever falls more than -7% from the purchase price. Its current Up/Down Volume Ratio of 1.5 is an unbiased indication that its shares have been under accumulation during the past 50 days.
Encountered Mild Distributional Pressure in Tight Range Near Highs - Friday, September 14, 2012
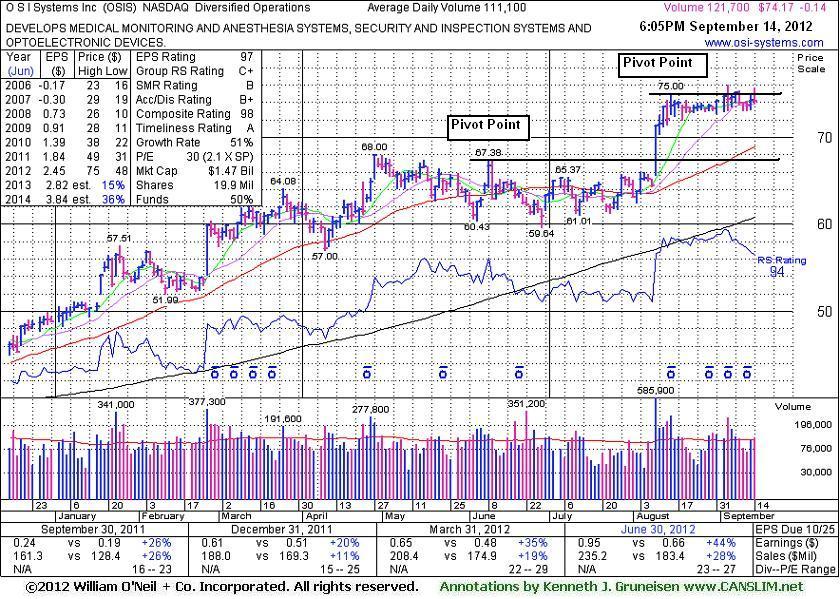
O S I Systems Inc (OSIS -$0.14 or -0.19% to $74.17) has encountered mild distributional pressure since a new pivot point was cited based on its 8/15/12 high plus 10 cents. Subsequent volume-driven gains for a close above its pivot point may clinch a new (or add-on) technical buy signal. On pullbacks, its 50-day moving average (DMA) line defines support above prior highs in the $67-68 area.
Its last appearance in this FSU section was on 8/09/12 with an annotated daily graph under the headline, "Breakout Gain Backed With Nearly 6 Times Average Volume". Its considerable gain was backed by nearly 6 times average volume as it triggered a technical buy signal. It rallied higher and has stubbornly held its ground since.
It reported earnings +20% on +11% sales revenues for the quarter ended December 31, 2011 versus the year ago period. Those results, below the +25% minimum earnings guideline (C criteria) of the investment system, marked its weakest earnings comparison in 2 years. However, it has followed with sequentially stronger sales revenues increases and earnings increases in the latest quarters, including earnings +44% on +28% sales revenues for the quarter ended June 30, 2012 versus the year ago period. Such acceleration in its growth rate is a very encouraging sign. Its annual earnings (A criteria) growth history has also been very strong.
Ownership by top-rated funds rose from 281 in Sep '11 to 309 in the Jun '12 quarter, a reassuring sign concerning the I criteria. As always, limit losses if any stock ever falls more than -7% from the purchase price. Its current Up/Down Volume Ratio of 1.5 is an unbiased indication that its shares have been under accumulation during the past 50 days.
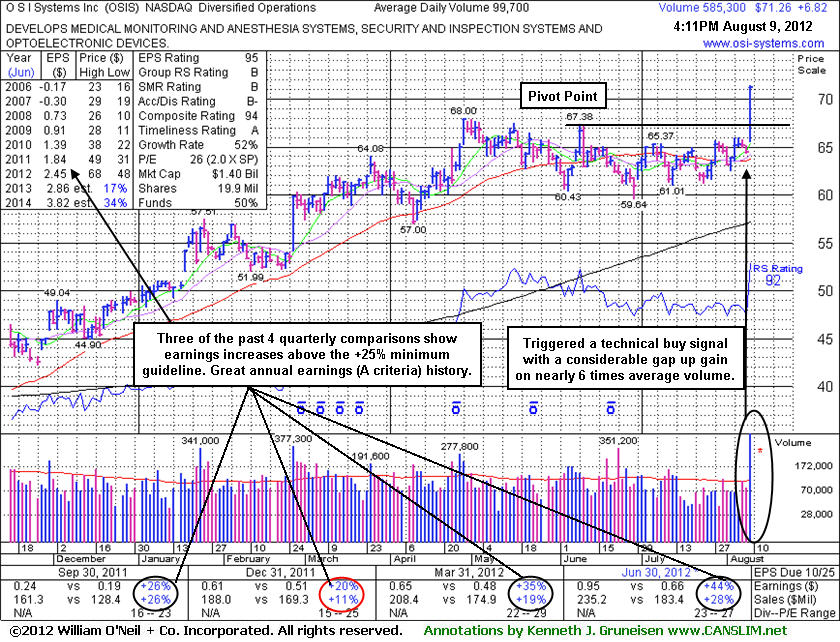
Breakout Gain Backed With Nearly 6 Times Average Volume - Thursday, August 09, 2012
Often, when a leading stock is setting up to breakout of a solid base it is highlighted in CANSLIM.net's Mid-Day Breakouts Report. The most relevant factors are noted in the report which alerts prudent CANSLIM oriented investors to place the issue in their watch list. After doing any necessary backup research, the investor is prepared to act after the stock triggers a technical buy signal (breaks above its pivot point on more than +50% average turnover) but before it gets too extended from a sound base. In the event the stock fails to trigger a technical buy signal and its price declines then it will simply be removed from the watch list. Disciplined investors know to buy as near as possible to the pivot point and avoid chasing stocks after they have rallied more than +5% above their pivot point. It is crucial to always limit losses whenever any stock heads the wrong direction, and disciplined investors sell if a struggling stock ever falls more than -7% from their purchase price.
O S I Systems Inc (OSIS +$6.82 or +10.58% to $71.26) finished strong after it was highlighted in yellow with pivot point cited based on its 6/08/12 high plus 10 cents in the earlier mid-day report (read here). It reported earnings +44% on +28% sales revenues for the quarter ended June 30, 2012 versus the year ago period. Its considerable gain was backed by nearly 6 times average volume as it triggered a technical buy signal.
Its last appearance in this FSU section was on 1/31/12 with an annotated daily graph under the headline, "Earnings in Latest Quarter Reported Below System Guidelines." OSIS found support well above its 200-day moving average (DMA) line while consolidating after it was later dropped from the Featured Stocks list on 2/22/12. It had reported earnings +20% on +11% sales revenues for the quarter ended December 31, 2011 versus the year ago period. Those results, below the +25% minimum earnings guideline (C criteria) of the investment system, marked its weakest earnings comparison in 2 years. However, it has followed with sequentially stronger sales revenues increases and earnings increases in the latest quarters, and such acceleration in its growth rate is a very encouraging sign.
Annual earnings (A criteria) growth has been strong. Ownership by top-rated funds rose from 281 in Sep '11 to 307 in the Jun '12 quarter, a reassuring sign concerning the I criteria. As always, limit losses if any stock ever falls more than -7% from the purchase price. On pullbacks, its prior highs in the $67 area define initial support above its 50 DMA line.
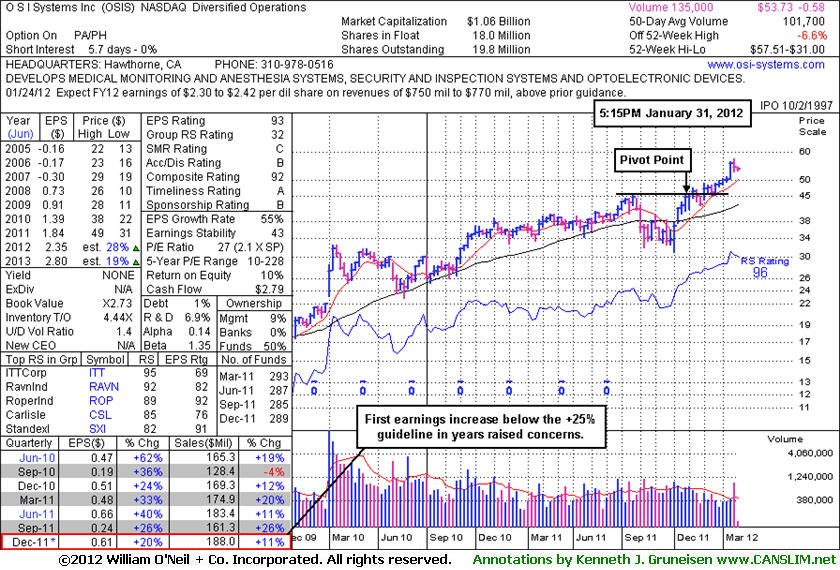
Earnings in Latest Quarter Reported Below System Guidelines - Tuesday, January 31, 2012
O S I Systems Inc (OSIS +$0.24 or +0.45% to $53.73) is quietly consolidating -6.6% from its all-time high. It recently reported earnings +20% on +11% sales revenues for the quarter ended December 31, 2011 versus the year ago period. The annotated weekly graph illustrates how the latest results, below the +25% minimum earnings guideline of the investment system, also marked its weakest earnings comparison in 2 years, raising concerns. Its 50-day moving average (DMA) line defines important support to watch where a violation would trigger a technical sell signal.
Its last appearance in this FSU section was on 12/27/11 with an annotated daily graph under the headline, "Best Ever Close For High-Ranked Leader", followed by an ongoing spurt of volume-driven gains afterward. In the process it rallied as much as +36.7% above its price ($42.07) when first highlighted in yellow in the 11/01/11 mid-day breakouts report (read here). Annual earnings (A criteria) growth has been strong. Ownership by top-rated funds has not shown any great increases in the past 6 months. As always, limit losses if any stock ever falls more than -7% from the purchase price.
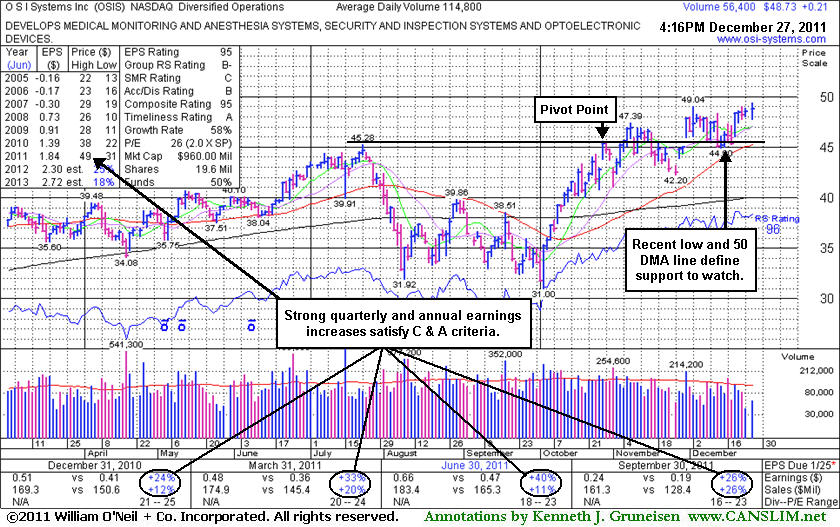
Best Ever Close For High-Ranked Leader - Tuesday, December 27, 2011
O S I Systems Inc (OSIS +$0.33 or +0.68% to $48.85) was up today without great volume conviction, yet it inched further above its "max buy" level into new all-time high territory and its color code was changed to green. Its 50-day moving average (DMA) line and recent chart lows near $45 define important near-term support to watch on pullbacks. Its last appearance in this FSU section was on 11/28/11 with an annotated daily graph under the headline, "Gap Up Today has Leader Poised Near Pivot Previously Cited." Subsequent volume-driven gains above its pivot point and recent chart highs triggered a convincing technical buy signal on 11/30/11. Since then it has held its ground well above its 50 DMA line while consolidating, and it continued wedging higher without great volume conviction as it inched to another new 52-week high.
Annual earnings (A criteria) growth has been strong, and quarterly earnings increases have been above the +25% guideline satisfying the C criteria. Ownership by top-rated funds has not shown any great increases in the past 6 months. As always, limit losses if any stock ever falls more than -7% from the purchase price.
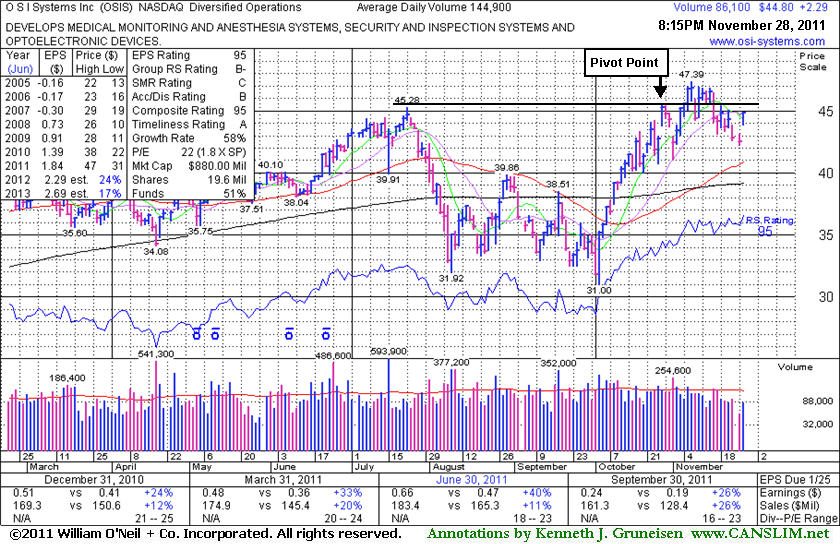
Gap Up Today has Leader Poised Near Pivot Previously Cited - Monday, November 28, 2011
O S I Systems Inc (OSIS +$2.29 or +5.39% to $44.80) gapped up today, rallying with higher (but still below average) volume back toward its previously cited pivot point. A new pivot point has not been cited however its color code was changed to yellow while consolidating well above its 50-day moving average (DMA) line. Subsequent volume-driven gains above its pivot point and recent chart highs may trigger a convincing technical buy signal.
There were no confirming gains backed by volume, and it has instead endured mild distributional pressure. Its last appearance in this FSU section was on 11/01/11 with an annotated daily graph under the headline, "Pullback My Be Handle Following Cup Shaped Base." It had gapped down, pulling back after wedging to a new 52-week high without great volume conviction.
It may be forming a longer and higher handle following the previously noted cup shaped base. It is normally considered ideal for volume to dry up during the period when a handle forms, and that is what it has done. Annual earnings (A criteria) growth has been strong and quarterly earnings increases have been above the +25% guideline satisfying the C criteria. Ownership by top-rated funds has not shown any great increases in the past 6 months. That may serve as a reminder for disciplined investors to watch for proof of fresh buying demand from the institutional crowd to confirm a proper technical buy signal. As always, limit losses if any stock ever falls more than -7% from the purchase price.
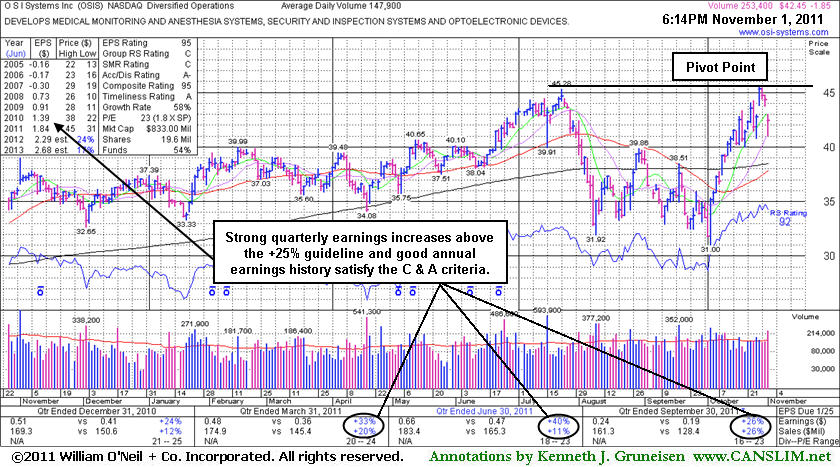
Pullback My Be Handle Following Cup Shaped Base - Tuesday, November 01, 2011
O S I Systems Inc (OSIS -$1.85 or -4.18% to $42.45) gapped down today, pulling back after recently wedging to a new 52-week high without great volume conviction. It may be forming a handle following a 14-week cup shaped base, however it is normally considered ideal for volume to dry up during the period when a handle forms. In the mid-day report today its color code was changed to yellow with pivot point cited based on its 10/27/11 high. Subsequent volume-driven gains above its pivot point may trigger a technical buy signal. Annual earnings (A criteria) growth has been strong and quarterly earnings increases have been above the +25% guideline satisfying the C criteria. Ownership by top-rated funds fell from 352 in Mar '11 to 333 in Sep '11. That may serve as a reminder for disciplined investors to watch for proof of fresh buying demand from the institutional crowd to confirm a proper technical buy signal. As always, limit losses if any stock ever falls more than -7% from the purchase price.