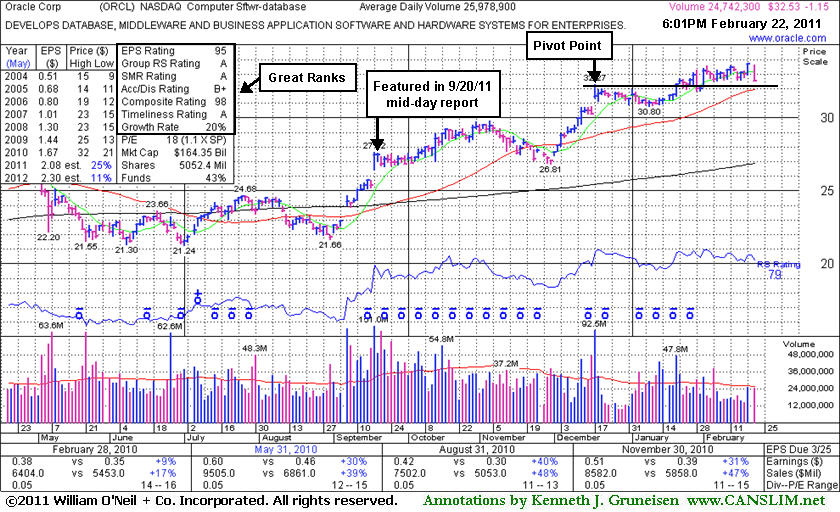
Oracle Corp (ORCL -$1.15 or -3.41% to $32.53) suffered a considerable loss today on near average volume. It closed near the session low just -3.5% off last week's new 52-week high. Recently volume had been cooling while hovering below its "max buy" level. Near-term support to watch is its 50-day moving average (DMA) line which coincides with chart support at its old resistance level. Since last analyzed in this FSU section with an annotated graph on 1/07/11 under the headline "Tight Consolidation For Strong Software Giant" it had gone on to gradually rally for new highs.
ORCL has maintained a strong annual earnings (A criteria) history and sales revenues and earnings increases showed impressive acceleration in its most recent quarterly comparisons, satisfying the C criteria. Its large supply of 5.05 billion shares outstanding makes it an unlikely sprinter. It is also already heavily owned by funds. However, no overhead supply remains to hinder its progress, and its current Up/Down Volume Ratio of 1.6 is still providing an unbiased indication of institutional accumulation.
When ORCL was featured in yellow in the 9/20/10 mid-day report (read here) it had triggered a technical buy signal with a "breakaway gap" with 5 times average volume behind its considerable 9/17/10 gain. This FSU section headline announced "Big-Cap Tech Firm is Technically and Fundamentally Strong".
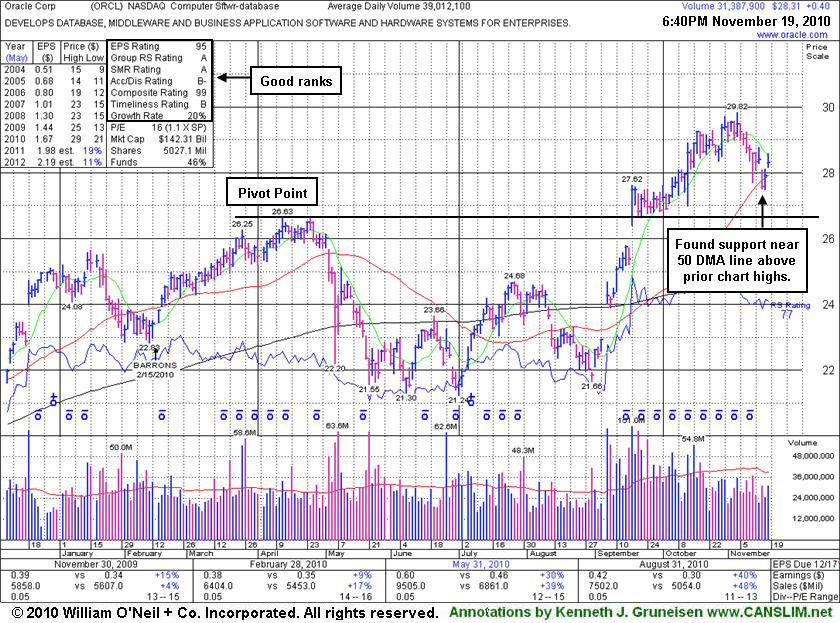
Oracle Corp (ORCL -$0.14 or -0.45% to $31.03) has been consolidating in a tight range in recent weeks, extended from any sound base. It was last analyzed in this FSU section with an annotated graph on 11/18/10 under the headline "Recent Support Found Near 50-Day Average" and during the broader market's November pullback it later fell below that important short-term average yet found support near its old resistance level. It has maintained a strong annual earnings (A criteria) history and sales revenues and earnings increases showed impressive acceleration in its most recent quarterly comparisons, satisfying the C criteria. Its large supply of 5.05 billion shares outstanding makes it an unlikely sprinter. It is also already heavily owned by funds. However, no overhead supply remains to hinder its progress, and its current Up/Down Volume Ratio of 1.2 is still providing an unbiased indication of institutional accumulation.
It would not be considered a proper "3-weeks tight" or "4-weeks tight" type pattern now. That type of advanced chart pattern requires a significant run up in price prior to 3 tight weekly closes, for example, if the stock had rallied 70-100% or more in the prior 9-16 weeks without any sufficient consolidation periods.
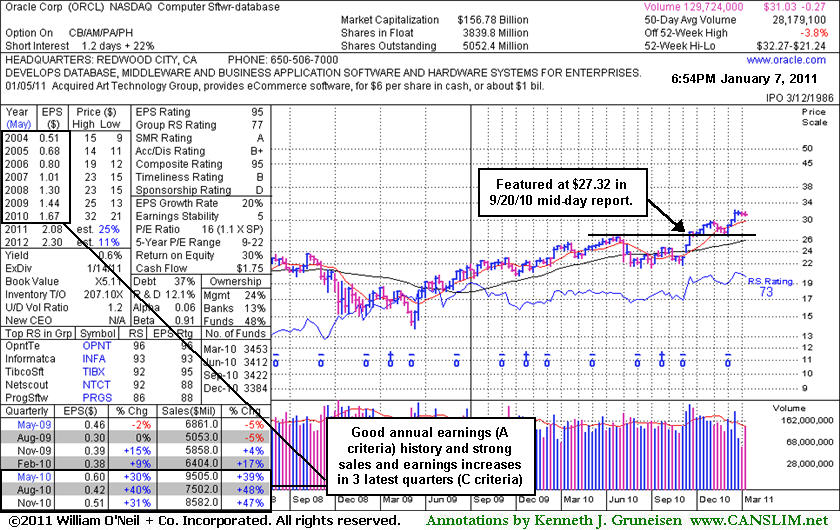
When ORCL was featured in yellow in the 9/20/10 mid-day report (read here) it had triggered a technical buy signal with a "breakaway gap" with 5 times average volume behind its considerable 9/17/10 gain. This FSU section headline announced "Big-Cap Tech Firm is Technically and Fundamentally Strong"
Oracle Corp (ORCL +$0.40 or +1.43% to $28.31) posted a small gap up gain today after promptly trading back above its 50-day moving average (DMA) line on the prior session. Recent weakness raised concerns even while the volume totals were below average. More damaging losses below its latest chart lows near $27.50 would raise greater concerns. It was last analyzed in this FSU section on 9/20/10 under the headline "Big-Cap Tech Firm is Technically and Fundamentally" after it was featured in yellow in the mid-day report (read here). It had triggered a technical buy signal with a "breakaway gap" with 5 times average volume behind its considerable 9/17/10 gain. It has maintained a strong annual earnings (A criteria) history and sales revenues and earnings increases showed impressive acceleration in its most recent quarterly comparisons. Its large supply of 5.03 billion shares outstanding makes it an unlikely sprinter. However, no overhead supply remains to hinder its progress, and its current Up/Down Volume Ratio of 1.3 is still providing an unbiased indication of institutional accumulation.
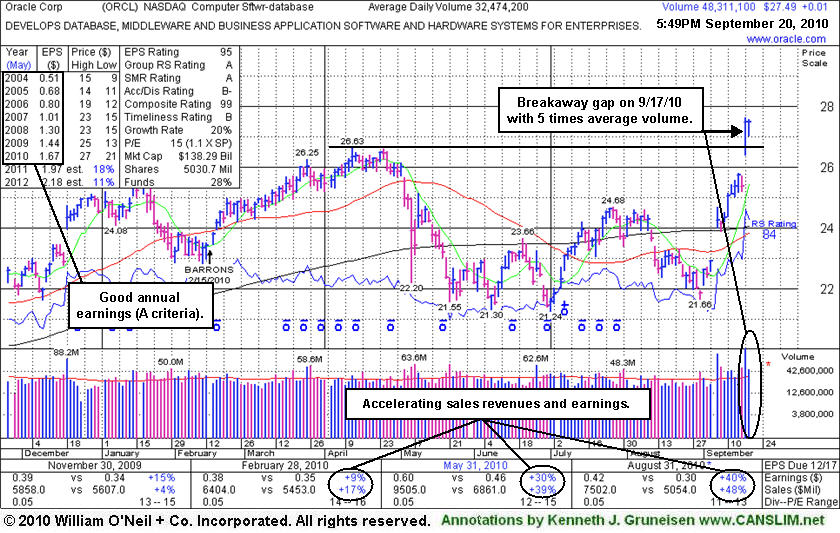
Oracle Corp (ORCL +$0.01 or +0.04% to $27.49) overcame early weakness and managed to hold its ground today after it was featured in yellow in the mid-day report (read here). It had triggered a technical buy signal with a "breakaway gap" on the prior session with 5 times average volume behind its considerable 9/17/10 gain. It has maintained a strong annual earnings (A criteria) history and sales revenues and earnings increases showed impressive acceleration in its most recent quarterly comparisons. Its large supply of 5.03 billion shares outstanding makes it an unlikely sprinter. However, no overhead supply remains to hinder its progress, and its current Up/Down Volume Ratio of 1.5 is an unbiased indication of institutional accumulation.