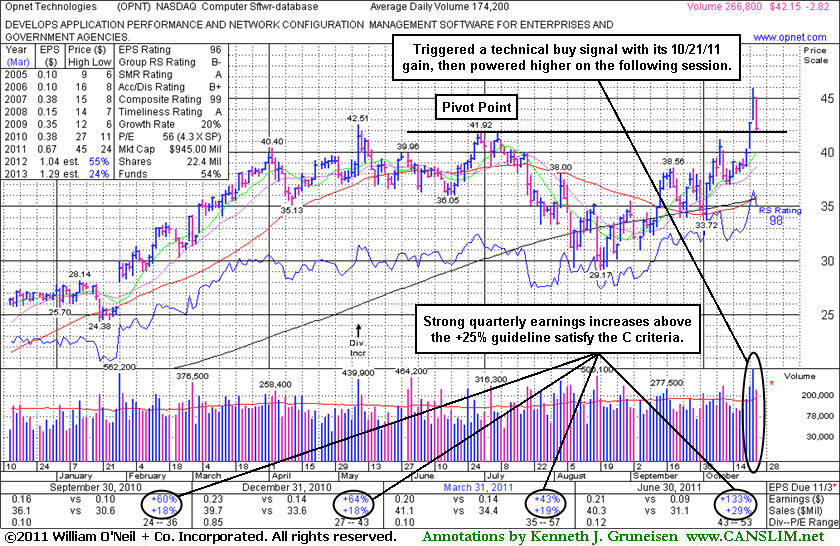
Opnet Technologies Inc (OPNT -$2.82 or -6.27% to $42.15) abruptly erased the prior gain, finishing near the session low today. Its loss on above average volume sent it to a close just above its pivot point and its color code was changed to yellow again. Its prior highs in the $41 area define near-term chart support to watch. Following its powerful breakout, any subsequent close below its old high close ($41.30 on 6/29/11) would raise concerns and might negate the technical buy signal it produced on 10/21/11. The breakout came ten days after it was first highlighted in yellow in the 10/11/11 mid-day report and in that evening's FSU section analysis with an annotated graph under the headline, "Weak Finish Reminds Investors to Resist the Urge to Get in 'Early'".
It finished today -8.2% off the prior session high, and the pullback serves as a reminder and an example to undisciplined investors, as those who may have chased it more than +5% above its pivot point could already be getting into trouble. Rule #1 in any sound investment strategy is to always avoid losing big. Disciplined fans of this fact-based system always sell if any stock falls more than -7% from their purchase price. Hanging on when a loss grows beyond -7% can lead to more painful and damaging financial consequences. Buying on pullbacks can sometimes work out, however historic studies have proven that investors' odds are typically best when buying a stock which is on the rise while it is as close to the pivot point as possible. Pyramiding is a smart tactic taught in the Certification which allows investors to carefully accumulate shares as the market action dictates. Sloppy buying efforts beyond the ideal range can lead to investors being forced to sell a healthy stock on an ordinary pullback. Approximately 40% of successful breakouts pull back and test support near prior highs before going on to produce much greater gains. so there is n
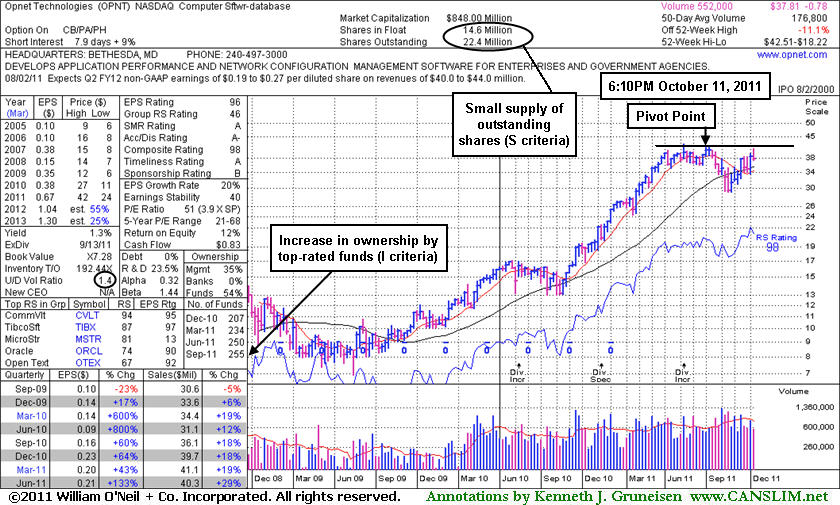
Recent quarters showed decent sales revenues growth and earnings above the +25% minimum guideline. Its annual earnings growth rate (A criteria) has been respectable since a previously noted downturn in FY '08. The lack of robust leadership (L criteria) in the Computer Software - Database group (current Group RS Rating 56) is somewhat discouraging. However, its Up/Down Volume Ratio of 1.8 suggests that it has recently been under heavy accumulation. Ownership by top-rated funds rose from 188 in Sep '10 to 257 in Jun '11, another reassuring sign concerning the I criteria. Return On Equity is reported at 12%, which is below the 17% guideline. However, management owns a 35% stake in its shares, keeping the directors motivated to maintain and build shareholder value.
Opnet Technologies Inc (OPNT -$2.70 or -6.67% to $37.81) finished weak today with a loss on 2 times average volume after its appearance in the mid-day report (read here) where its color code was changed to yellow with a new pivot point cited based on its 6/30/11 high plus ten cents. It was cautiously noted - "Volume-driven gains above its pivot point may trigger a technical buy signal. It has rebounded after slumping below its 200 DMA line during its consolidation since dropped from the Featured Stocks list on 7/21/11." Its last appearance in this FSU section on 7/01/11 included an annotated graph under the headline, "New Base Formation Awaiting Technical Breakout", while it was perched near its 52-week high after building an orderly base. Those who followed it before may recall the prudent warning that - "Disciplined investors resist the urge to get in 'early' and would watch for a confirming technical buy signal before taking action."
Recent quarters showed decent sales revenues growth and earnings above the +25% minimum guideline. Its annual earnings growth rate (A criteria) has been respectable since a previously noted downturn in FY '08. The lack of robust leadership (L criteria) in the Computer Software - Database group (current Group RS Rating 46) is somewhat discouraging. However, its Up/Down Volume Ratio of 1.4 suggests that it has recently been under accumulation. Ownership by top-rated funds rose from 188 in Sep '10 to 255 in Jun '11, another reassuring sign concerning the I criteria. Return On Equity is reported at 12%, which is below the 17% guideline. However, management owns a 35% stake in its shares, keeping the directors motivated to maintain and build shareholder value.
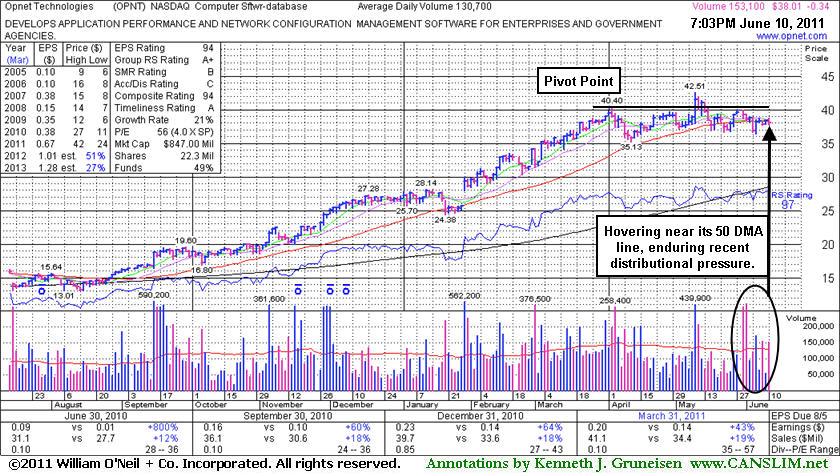
The stock's last appearance in this FSU section on 6/10/11 included an annotated graph under the headline, "Near 50 Day Average While Enduring Distributional Pressure". Recent quarters showed decent sales revenues growth and earnings above the +25% minimum guideline. Its annual earnings growth rate (A criteria) has been respectable since a previously noted downturn in FY '08. Strength and leadership (L criteria) in the Computer Software - Database group has recently been encouraging. Ownership by top-rated funds rose from 188 in Sep '10 to 228 in Mar '11, a reassuring sign concerning the I criteria. Return On Equity is reported at 12%, which is below the 17% guideline. However, management owns a 36% stake in its shares, keeping the directors motivated to maintain and build shareholder value.
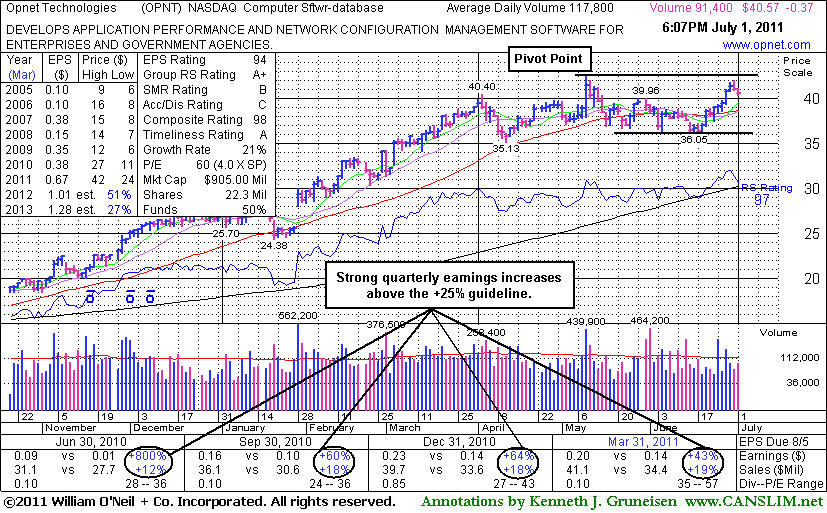
Recent quarters showed decent sales revenues growth and earnings above the +25% minimum guideline. Its annual earnings growth rate (A criteria) has been respectable since a previously noted downturn in FY '08 (see red oval). Strength and leadership (L criteria) in the Computer Software - Database group has recently been encouraging. Ownership by top-rated funds rose from 188 in Sep '10 to 228 in Mar '11, a reassuring sign concerning the I criteria.
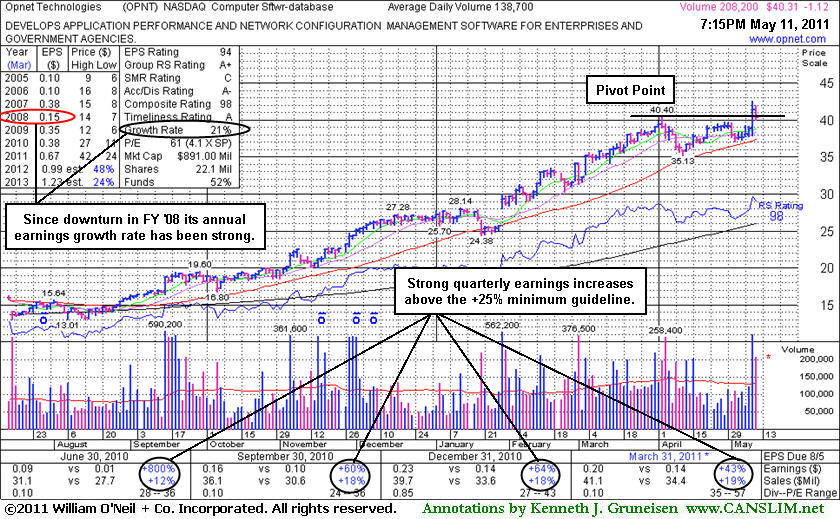
Opnet Technologies Inc (OPNT -$1.12 or -2.70% to $40.31) was pulling back when featured in yellow in the mid-day report today (read here). Its close below its pivot point raised concerns while the broader market (M criteria) suffered a damaging distribution day. Subsequent weakness leading to closes below its prior high closes would raise greater concerns by completely negating its breakout and closing back in the prior base. A violation of its 50-day moving average would trigger a more worrisome sell signal.
OPNT had spiked to a new 52-week high while posting a considerable gain with heavy volume on the prior session, which technically triggered a buy signal with its strong close on heavy volume above the pivot point cited based on its 4/04/11 high plus ten cents. Enthusiasm following its report of a solid +43% earnings increase on +19% sales revenues for the quarter ended March 31, 2011 versus the year ago period helped it rally from a late stage flat base above its 50-day moving (DMA) line. Recent quarters showed decent sales revenues growth and earnings above the +25% minimum guideline. Its annual earnings growth rate (A criteria) has been respectable since a previously noted downturn in FY '08 (see red oval). Strength and leadership (L criteria) in the Computer Software - Database group has recently been encouraging. Ownership by top-rated funds rose from 188 in Sep '10 to 221 in Mar '11, a reassuring sign concerning the I criteria.