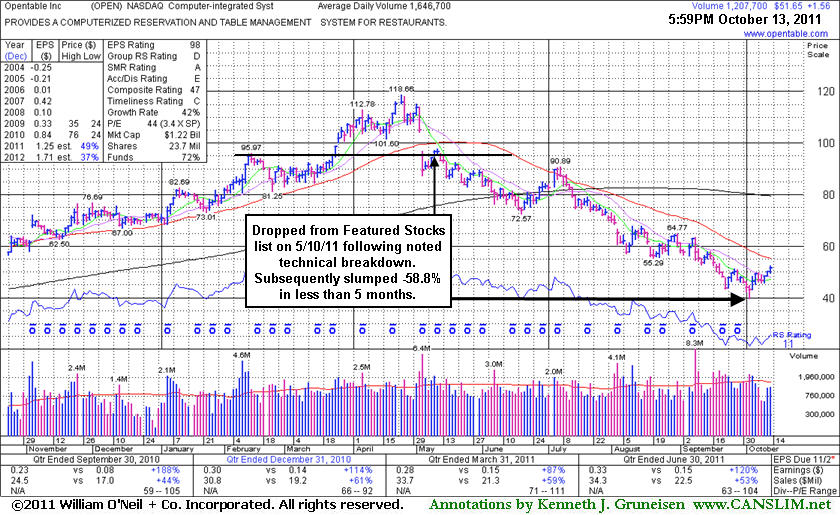
When the number of stocks included on the Featured Stocks page is low, and those currently listed have all received recent analysis in this FSU section, we occasionally go back to revisit a previously featured stock that was dropped. Today we will have another look at a stock that was dropped from the Featured Stocks list back on 5/10/11. OPEN sank as much as -58.8% lower in less than 5 months after it was dropped from the Featured Stocks list. That serves as a reminder that losses should always be limited by selling if ever any stock falls more than -7% from your purchase price. That is Rule #1 in the fact-based investment system CANSLIM.net supports.
Opentable Inc. (OPEN $51.65) was dropped from Featured Stocks list on 5/10/11 shortly after a noted technical breakdown. Regardless of all other criteria, technical action should always dictate investors' buying and selling decisions. The chart below illustrates how its 50-day moving average (DMA) line later acted as a resistance level while the stock subsequently slumped -58.8% in less than 5 months. The C criteria is still solidly satisfied as earnings and sales revenues increases have been strong in its latest quarterly comparisons versus the year ago period. The number of top-rated funds owning shares rose from 326 in Dec '10 to 370 in Sep '11, a very reassuring sign concerning the I criteria. Favorable criteria today does little to ease the pain for investors who may have decided to hang in there following the decisive technical breakdown that was noted. Overhead supply is now a source of great resistance if the stock can find the means to rebound. Meanwhile, any fundamental disappointment could hurt its chances of ever making a full recovery.

The C criteria is solidly satisfied as earnings and sales revenues increases have been strong in its latest quarterly comparisons versus the year ago period. Its current Up/Down Volume Ratio of 1.5 provides an unbiased indication of institutional accumulation, along with its favorable A- rating for Accumulation/Distribution.
The company's management still owns a 32% stake in its shares, keeping them motivated to look after and build shareholder value. Of course, they also may be inclined to employ the help of an underwriter to complete a Secondary Offering at some future point, although no such news has been announced. Meanwhile, the number of top-rated funds owning shares rose from 167 in Dec '09 to 328 in Mar '11, a very reassuring sign concerning the I criteria.
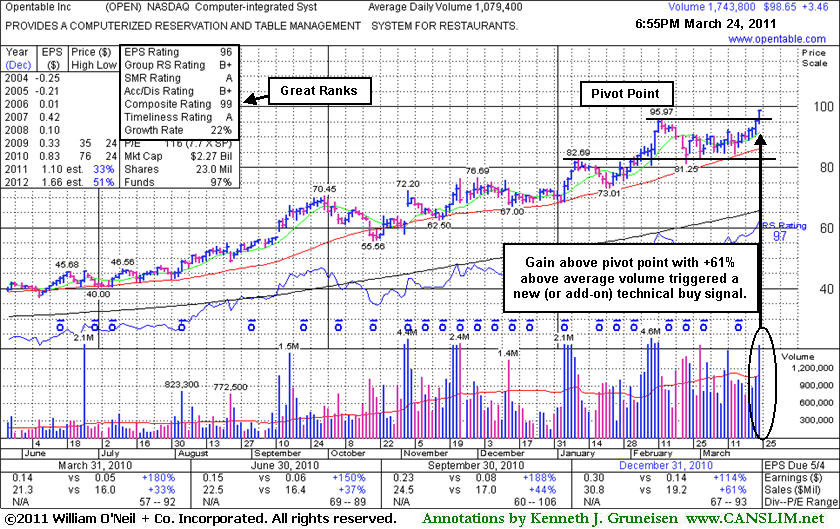
Opentable Inc. (OPEN +$3.46 or +3.63% to $99.65) hit a new all-time high today with +61% above average volume behind its solid gain above its pivot point, triggering a new (or add-on) technical buy signal. Since its last appearance in this FSU section with detailed analysis and an annotated graph on 2/15/11 under the headline, "Strong Earnings Underpin Bullish Performance", it consolidated and built a sound new base above its 50-day moving average (DMA) line. A new pivot point was cited on March 17th.
The C criteria is solidly satisfied as earnings and sales revenues increases have been strong in the 5 latest quarterly comparisons versus the year ago period. Its current Up/Down Volume Ratio of 1.7 provides an unbiased indication of institutional accumulation, aside from its favorable B+ rating for Accumulation/Distribution.
The company's management still owns a 32% stake in its shares, keeping them motivated to look after and build shareholder value. Of course, they also may be inclined to employ the help of an underwriter to complete a Secondary Offering at some future point, although no such news has been announced. Meanwhile, the number of top-rated funds owning shares rose from 167 in Dec '09 to 320 in Dec '10, a very reassuring sign concerning the I criteria. It could go on to produce more climactic gains, but disciplined investors know 3 out of 4 stocks follow the direction of the major averages (M criteria), and a convincing follow-through day by strict definition did not yet occur.
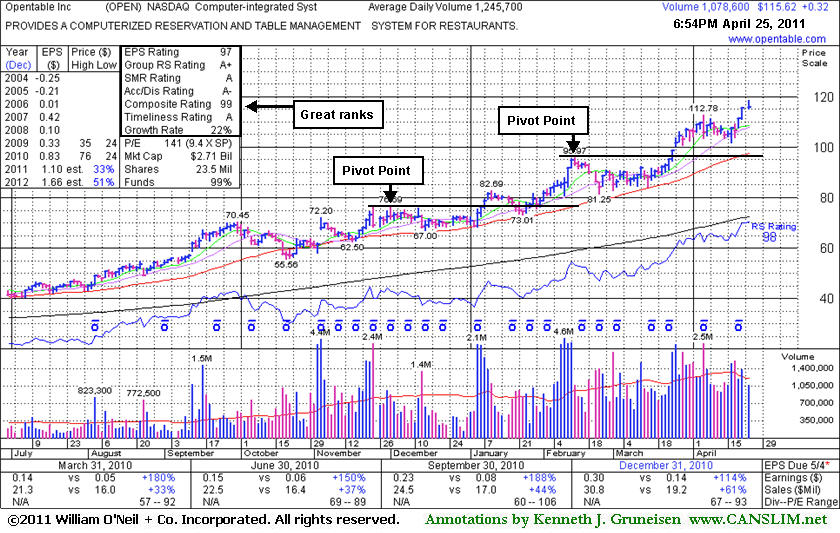
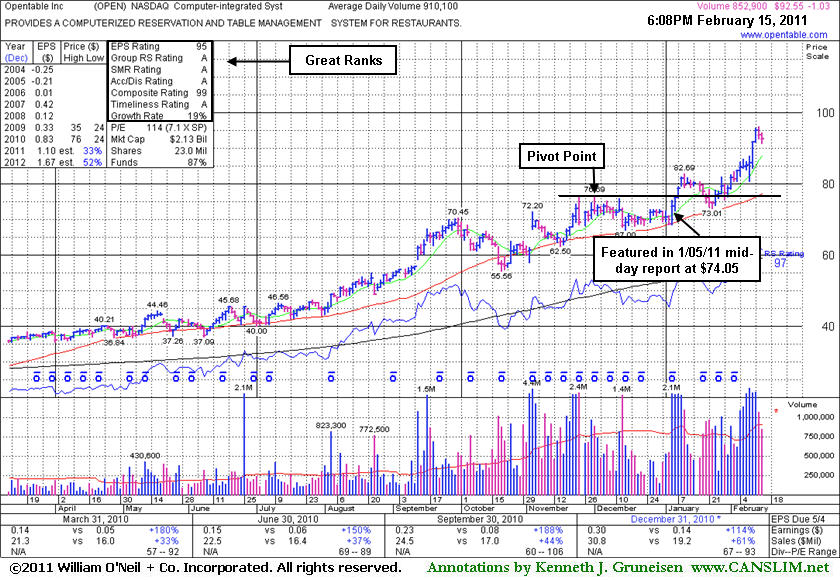
Opentable Inc. (OPEN -$1.03 or -1.10% to $92.55) is quietly consolidating after a streak of volume-driven gains for new all-time highs. It is extended from a sound base pattern, meanwhile prior highs define support above its 50-day moving average (DMA) line. Since its last appearance in this FSU section with detailed analysis and an annotated graph on 1/05/11 under the headline "Solid Gain Today Approaches 52-Week High" it reported earnings +114% on +61% sales revenues for the quarter ended December 31, 2010 versus the year-ago period. The C criteria is solidly satisfied as earnings and sales revenues increases have been strong in the 5 latest quarterly comparisons versus the year ago period. Its current Up/Down Volume Ratio of 2.2 provides an unbiased indication of institutional accumulation, aside from its favorable A rating for Accumulation/Distribution.
The company's management still owns a 32% stake in its shares, keeping them motivated to look after and build shareholder value. Of course, they also may be inclined to employ the help of an underwriter to complete a Secondary Offering at some future point, although no such news has been announced. Meanwhile, the number of top-rated funds owning shares rose from 167 in Dec '09 to 305 in Dec '10, a very reassuring sign concerning the I criteria. It could go on to produce more climactic gains, but disciplined investors know not to chase extended stocks. Patience may allow for secondary buy points to develop.
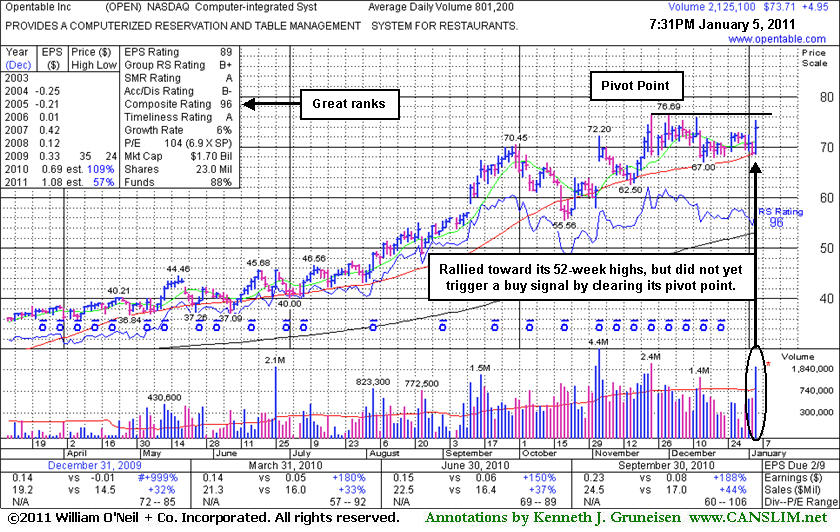
Opentable Inc. (OPEN +7.20%) posted a solid gain today with above average volume, rallying from its 50-day moving average (DMA) support and approaching its 52-week high. It was featured in yellow in today's mid-day report with a pivot point cited based on its 52-week high plus 10 cents after an orderly base. Disciplined investors know that confirming gains above its pivot with at least +50% above average volume are needed to confirm a proper technical buy signal. It had last been noted in the 11/24/10 mid-day report -"Reported earnings +188% on +44% sales revenues for the quarter ended September 30, 2010 versus the year ago period. It could go on to produce more climactic gains."
The C criteria is satisfied as earnings and sales revenues increases have been strong the 4 latest quarterly comparisons versus the year ago period. It got off to a very volatile start after its 5/11/09 IPO at $20, and it slumped for more than 4 months after it completed a Secondary Offering on 9/23/09. The company's management still owns a 32% stake in its shares and top-rated funds owning shares rose from 167 in Dec '09 to 273 in Sep '10. (NOTE: Prior notes on this and other stocks cited top-rated US funds, and now our source is including foreign funds and hedge funds in their totals reported).
