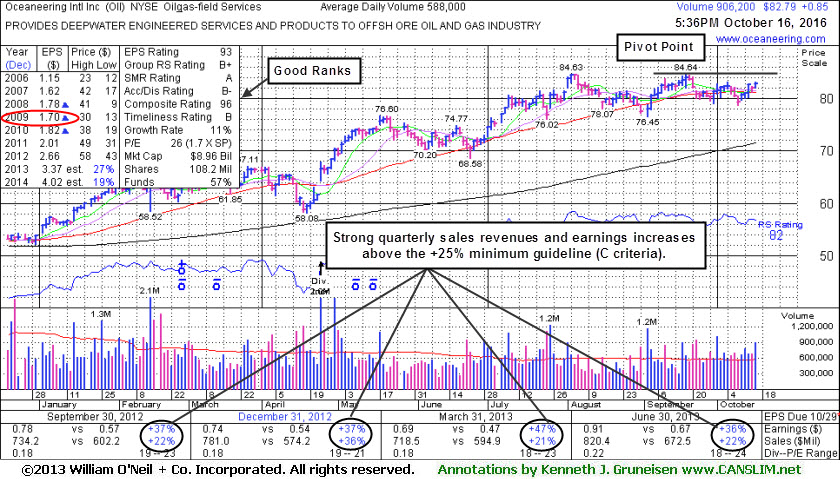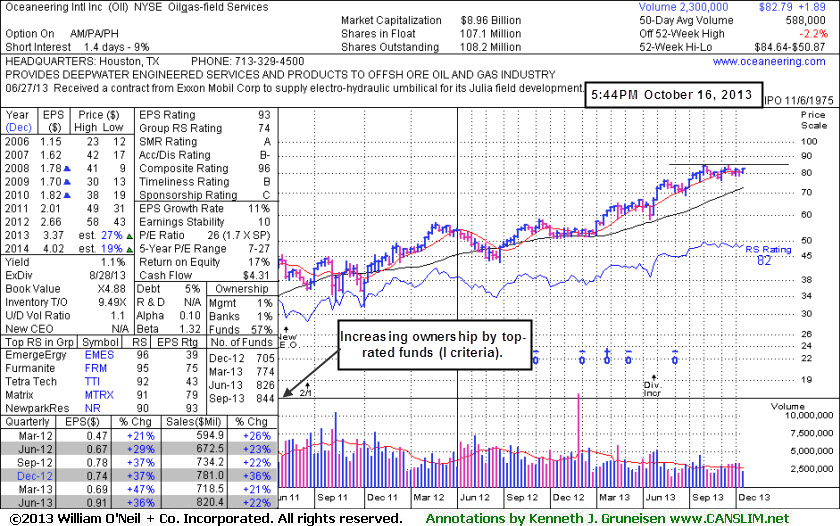
Oceaneering International Inc. (OII +$0.85 or +1.04% to $82.79) was highlighted in yellow in the earlier mid-day report (read here) while building an orderly base with pivot point based on its 9/18/13 high plus 10 cents. Subsequent volume-driven gains above the pivot point may trigger a technical buy signal. It is perched -2.2% off its 52-week high, consolidating near its 50-day moving average (DMA) line. It reported earnings +36% on +22% sales revenues for the quarter ended Jun 30, 2013 versus the year ago period, its 5th consecutive quarter with earnings increasing above the +25% minimum guideline (C criteria).
The Oil & Gas - Field Services group has a B+ Group Relative Strength Rating and leadership from others in the group is a reassurance concerning the L criteria. The number of top-rated funds owning its shares rose from 705 in Dec '12 to 844 in Sep '13, a reassuring sign concerning the I criteria. It had some choppy years and its annual earnings (A criteria) history included a downturn in FY '09. However, the company survived and made a lot of progress since last shown in this FSU section long ago with an annotated graph on 8/16/06 under the headline, "Struggle Continues After 50 DMA Breach".


C A N S L I M | StockTalk | News | Chart | SEC | Zacks Reports
View all notes | Alert me of new notes | CANSLIM.net Company Profile
Longstanding readers of this section in the CANSLIM.net After Market Report are well versed on the importance of upward trendlines. It is also important to note how stocks behave after an upward trendline is violated. By definition, an upward trendline develops when a stock has steadily appreciated for an extended period of time. During that period the stock vacillates between the lower and upper boundary of the trendline. However, once the bears show up and the lower trendline is violated then odds start favoring the possibility of further downside testing.
Oceaneering International Inc. (OII +$0.35 or +0.96% to $35.97) closed higher on below average volume today. This stock was first featured on Tuesday, January 17, 2006 in the CANSLIM.net Mid Day Breakouts Report (read here) at +$27.54 (split adjusted) as it was setting up to breakout above its $27.69 (split adjusted) pivot point. More recently, a detailed analysis appeared in the August 07, 2006 CANSLIM.net After-Market Report (read here) as it was testing support its 50-day moving average (DMA) line. Three days later, this stock sliced through its important 50 DMA line, and it also violated its longer term upward trendline. The next level of support is at its longer term 200 DMA line ($32.48), then its prior chart highs near $30. Meanwhile, OII faces resistance due to having spent a few months trading at higher levels, creating overhead supply. The recent weakness in energy related issues, and the stock's D- Accumulation/Distribution rank (circled in red), are additional causes for concern. For now, this selection is looking more like damaged goods, and it needs time to repair itself technically. Meanwhile, another fresh new breakout might make a more timely purchase candidate.
C A N S L I M | StockTalk | News | Chart | SEC | Zacks Reports
View all notes | Alert me of new notes | CANSLIM.net Company Profile
A very important technical tool that savvy investors have learned to incorporate in their technical analysis is the 50-day moving average (DMA) line. The 50 DMA line plays a pivotal role relative to a stock's price. If the price of a stock is above its 50 DMA then odds are that its 50 DMA will act as formidable support. Conversely, if the price is below its 50 DMA then the moving average acts as resistance. Healthy stocks sometimes trade under their 50 DMA lines briefly, but usually a strong candidate will promptly bounce and repair a 50 DMA violation. When a stock has violated its 50 DMA line and then lingers beneath it, the stock's outlook gets worse and worse as it spends a greater period of time trading under that important short-term average line. Once the 50 DMA line starts sloping downward it should also be acknowledged that the stock has been struggling for a while, and it might be time to reduce exposure and look for places to put that money to work in stronger buy candidates.
Oceaneering International Inc. (OII +$1.14 or +2.64% to $42.10) found support at its 50 day moving average and closed higher today on below average volume. This stock was first featured on Tuesday, January 17th, 2006 in the CANSLIM.net Mid Day Breakouts Report (read here) at +$27.54 (split adjusted) as it was setting up to breakout above its $27.69 (split adjusted) pivot point. It ended up encountering resistance near $30 and forming a long flat base through mid-April, then it gapped up on April 18th with high volume gains and cleared all resistanc edue to overhead supply. At its July 3rd, 2006 peak it had traded up +71.50% above the price when first featured. On Tuesday July 11th, 2006 this stock was featured in the After-Market Report while it was consolidating (read here). Prior chart highs near $41 (mentioned in the July 11th report) were briefly violated along with its 50 DMA line on July 21st, however the stock found prompt support and repaired the violation on the very next session. It is very healthy for a stock to pullback and find support near its 50 DMA line before resuming its uptrend. However, caution is raised by the fact that it has not posted a gain on above average volume since June 30th, meanwhile in that period since there have been several distribution days. Violations of recent chart lows would be considered technical sell signals. As long as this stock continues trading above its 50 DMA odds favor further gains.
C A N S L I M | StockTalk | News | Chart | SEC | Zacks Reports
C A N S L I M | StockTalk | News | Chart | SEC | Zacks Reports
View all notes | Alert me of new notes | CANSLIM.net Company Profile
A classic example of the success enjoyed by many CANSLIM.net readers usually starts when an investor reads a CANSLIM.net report and buys a featured stock before it has risen above the pivot point by greater than 5%. After a stock breaks out above its pivot point, there is only a +5% window that investors have to purchase the stock under the proper guidelines. Once a stock rises above the "maximum buy price" the risk of a shake out balloons, meaning that even a normal retracement in the stock might force you to employ the 7-8% loss cutting rule. Much can be told by the stock's daily action in the weeks and months that follow a breakout. Typically, a light volume and orderly pullback suggests that the bulls remain in control. However, high volume pullbacks that violate support paint a totally different picture.
Oceaneering International Inc. (OII $3.79 or 4.59% to $78.79) blasted to a fresh all time high on nearly twice normal turnover on Thursday. This stock was featured on Tuesday, January 17, 2006 in the CANSLIM.net Mid Day Breakouts Report (read here) at +$55.08 as it was setting up to breakout of its $55.37 pivot point. Two days later, on January 19, 2006, this stock blasted above its pivot point on above average volume which triggered a technical buy signal. Since then, this issue paused to build a long flat base, then resumed its ascent in April. It has rallied over +40% sicne first featured. For the past four weeks, while the major averages were moving lower, this stock built a new flat four week base. Today it blasted out of its short base and hit a new 52- week high. Now that this issue has taken out all remaining overhead resistance, the path of least resistance is higher.
C A N S L I M | StockTalk | News | Chart | SEC | Zacks Reports

View all notes | Alert me of new notes | CANSLIM.net Company Profile