Technical and Fundamental Concerns Recently Raised - Tuesday, May 21, 2019
Hitting New High and Very Extended From Prior Base - Thursday, April 4, 2019
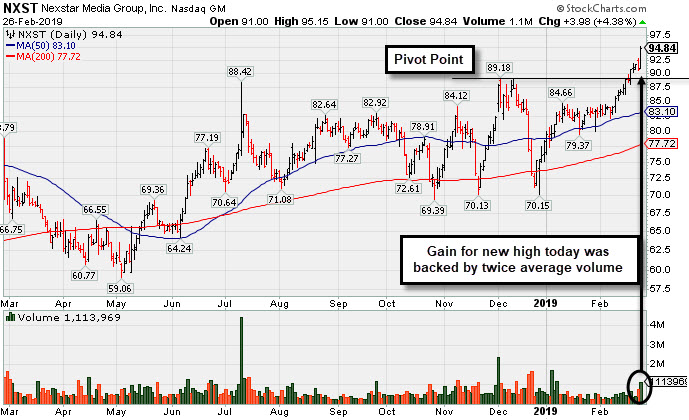
Twice Average Volume Behind Gain for New High - Tuesday, February 26, 2019
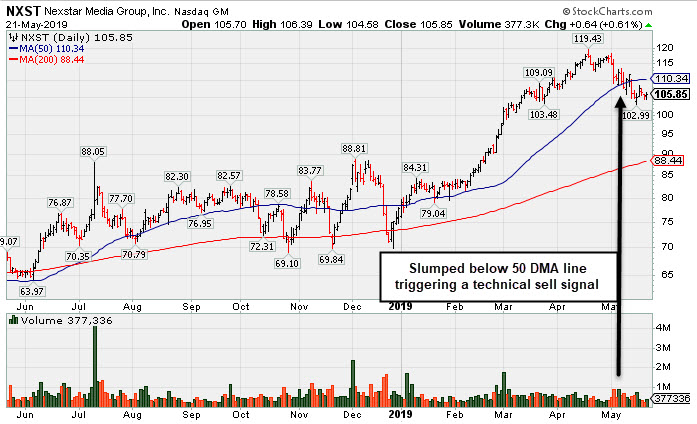
Technical and Fundamental Concerns Recently Raised - Tuesday, May 21, 2019
Nexstar Media Group Cl A (NXST +$0.64 or +0.61% to $105.85) needs to rebound above the 50-day moving average (DMA) line for its outlook to improve. The slump below its 50 DMA line recently raised concerns and triggered a technical sell signal. Fundamental concerns were raised when it recently it reported earnings +14% on +2% sales revenues for the Mar '19 quarter, below the +25% minimum earnings guideline (C criteria).
Quarterly comparisons through Dec '18 had shown strong earnings increases above the +25% minimum guideline (C criteria) versus the year ago periods with encouraging sales revenues acceleration. Its strong annual earnings history (A criteria) helped it get a 96 Earnings Per Share Rating.
The number of top rated funds owning its shares rose from 415 in Mar '18 to 558 in Mar '19, a reassuring sign concerning the I criteria. Its current Up/Down Volume Ratio of 1.5 is an unbiased indication its shares have been under accumulation over the past 50 days. It completed Secondary Offerings on 11/29/12 and 2/08/13.
Charts courtesy of www.stockcharts.com
Hitting New High and Very Extended From Prior Base - Thursday, April 4, 2019
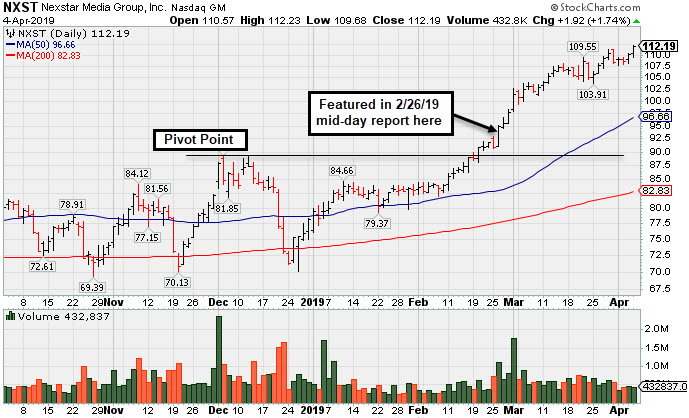
Nexstar Media Group Cl A (NXST +$1.69 or +1.53% to $111.96) hit another new all-time high today, getting very extended from any sound base. Disciplined investors avoid chasing stocks more than +5% above the prior high.
It finished the session strong after highlighted in yellow with pivot point cited based on its 12/04/18 high plus 10 cents in the 2/26/19 mid-day report (read here). Its solid gain for a new 52-week high today was backed by twice average volume, clinching a technical buy signal. It was shown in this FSU section on 2/26/19 with an annotated graph under the headline, "Twice Average Volume Behind Gain for New High"
Recent quarterly comparisons through Dec '18 showed strong earnings increases above the +25% minimum guideline (C criteria) versus the year ago periods with encouraging sales revenues acceleration. Its strong annual earnings history (A criteria) helped it get the highest possible Earnings Per Share Rating of 99.
The number of top rated funds owning its shares rose from 415 in Mar '18 to 507 in Dec '18, a reassuring sign concerning the I criteria. Its current Up/Down Volume Ratio of 2.7 is an unbiased indication its shares have been under accumulation over the past 50 days.
It completed Secondary Offerings on 11/29/12 and 2/08/13.
Charts courtesy of www.stockcharts.com
Twice Average Volume Behind Gain for New High - Tuesday, February 26, 2019
Nexstar Media Group Cl A (NXST +$3.98 or +4.38% to $94.84) finished the session strong after highlighted in yellow with pivot point cited based on its 12/04/18 high plus 10 cents in the earlier mid-day report (read here). Its solid gain for a new 52-week high today was backed by twice average volume, clinching a technical buy signal.
Recent quarterly comparisons through Dec '18 showed strong earnings increases above the +25% minimum guideline (C criteria) versus the year ago periods with encouraging sales revenues acceleration. Its strong annual earnings history (A criteria) helped it get the highest possible Earnings Per Share Rating of 99.
The number of top rated funds owning its shares rose from 415 in Mar '18 to 509 in Dec '18, a reassuring sign concerning the I criteria. Its current Up/Down Volume Ratio or 1.3 is an unbiased indication its shares have been under accumulation over the past 50 days. It completed Secondary Offerings on 11/29/12 and 2/08/13.
Charts courtesy of www.stockcharts.com