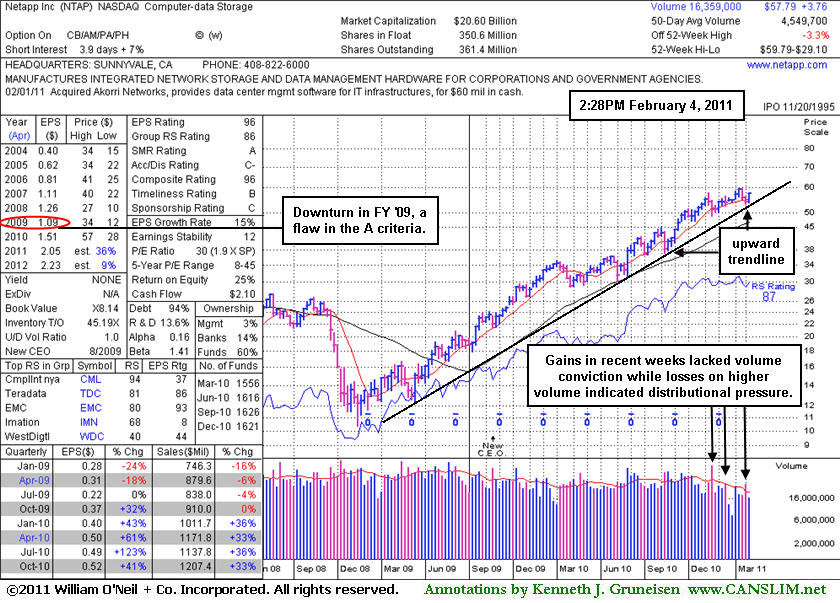
Longer-Term Upward Trendline Recently Being Tested - Friday, February 04, 2011
Network Appliance Inc's (NTAP +$0.92 or +1.61% to $57.93) quiet gains this week have it perched only -3.1% off its 52 week high after recently showing some resilience near its 50-day moving average (DMA) line. More damaging losses below the recently noted chart low ($53.14 on 1/25/11) could raise greater concerns and trigger more serious technical sell signals. It has recently traded near a longer-term upward trendline shown on its weekly graph below. Any subsequent violation of that longer-term trendline might be considered an ominous sign. Keep in mind it is still a couple of weeks away from reporting its earnings results (scheduled for Feb 16th after the close) and the latest results are likely to be a catalyst for more decisive action.
NTAP wedged to new highs without great volume conviction and then raised concerns. It endured distributional pressure and violated the shorter-term upward trendline shown on the daily graph included in this FSU section on 12/27/10 under the headline "Upward Trendline and 50 Day Average Line Define Near-Term Support".
Practitioners of this fact-based investment system know to look for stocks that are being discovered and accumulated by the institutional crowd. In this case, institutional ownership (I criteria) is already very substantial, and the number of top-rated funds owning its shares fell from 1,626 in Sept '10 to 1,621 in Dec '10. (NOTE: Prior notes on this and other stocks cited top-rated US funds, and now our source is including foreign funds and hedge funds in their totals reported).
Recent quarterly comparisons (C criteria) showed better sales revenues and strong earnings increases, but a down turn in its FY '09 earnings has been noted as a concern with respect to its annual earnings (A criteria) history. Long ago, this stock was featured on Thursday, March 30th, 2006 in the CANSLIM.net Mid Day Breakouts Report (read here). In May 2006, weak action resulted in it being dropped from the Featured Stocks list.
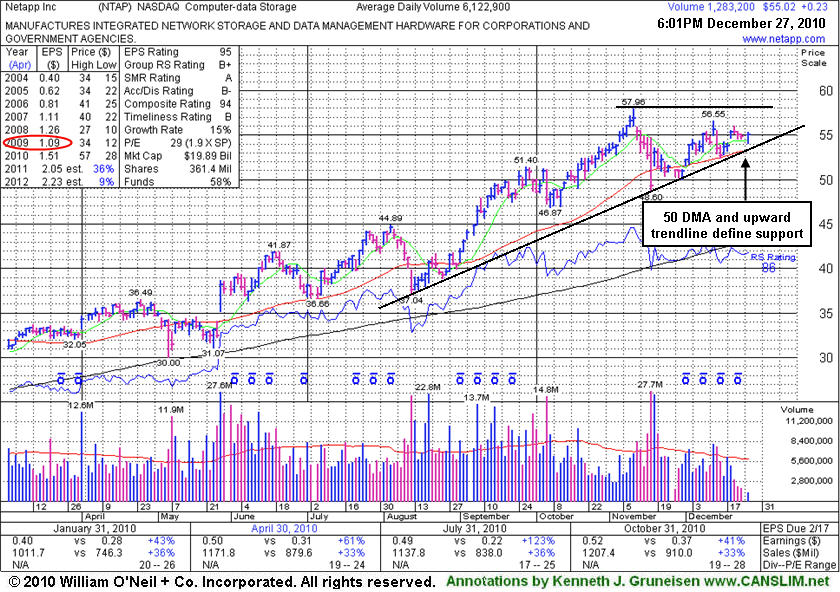
Upward Trendline and 50 Day Average Line Define Near-Term Support - Monday, December 27, 2010
Network Appliance Inc. (NTAP +$0.23 or +0.42% to $55.02) volume totals have been cooling while consolidating above its 50-day moving average (DMA) line and working on building a new base. Since its last appearance with an annotated graph on 11/03/10 under the headline "Wedging To New Highs Without Great Volume Conviction" it endured some distributional pressure but found prompt support near its its 50 DMA line. A line connecting its August - November lows creates an upward trendline which helps define important support near its short-term average line. More damaging losses could trigger worrisome technical sell signals. Increasing institutional ownership (I criteria) has been a very reassuring sign, having climbed from 1,588 top-rated funds in Dec '09 to 1,620 top-rated funds in Sep '10. (NOTE: Prior notes on this and other stocks cited top-rated US funds, and now our source is including foreign funds and hedge funds in their totals reported).
It has not formed a sound base pattern but it has been consolidating for almost 7 weeks and there is virtually no resistance remaining due to overhead supply. Gains above its recent chart highs with volume conviction would be a very encouraging sign of accumulation. Recent quarterly comparisons (C criteria) showed better sales revenues and strong earnings increases, but a down turn in its FY '09 earnings has been noted as a concern with respect to its annual earnings (A criteria) history. Long ago, this stock was featured on Thursday, March 30th, 2006 in the CANSLIM.net Mid Day Breakouts Report (read here). In May 2006, weak action resulted in it being dropped from the Featured Stocks list.
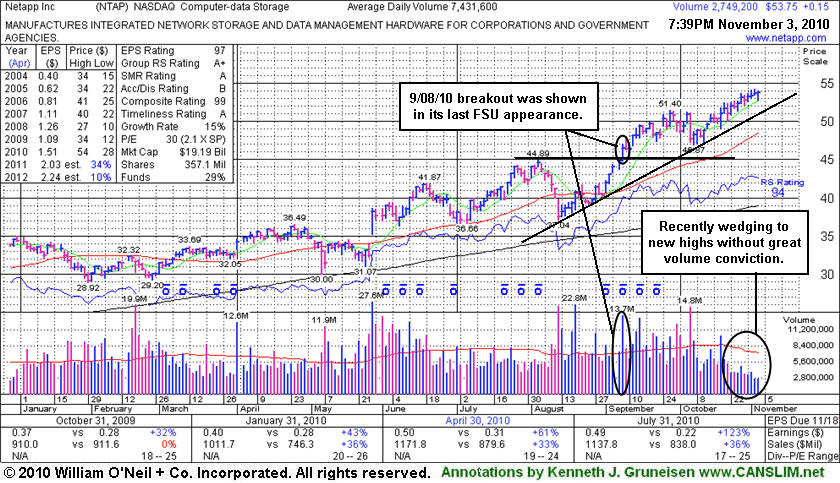
Wedging To New Highs Without Great Volume Conviction - Wednesday, November 03, 2010
Network Appliance Inc. (NTAP +$0.15 or +0.28% to $53.75) posted another small gain today with light volume for a new high close. An upward trendline defines initial support above recent lows near $47 and its 50-day moving average (DMA) line. It has shown healthy action since its last appearance with an annotated graph on 9/08/10 under the headline "Gains For New Highs Today Backed By Nearly Twice Average Volume". Increasing institutional ownership (I criteria) is a very reassuring sign, having climbed from 308 top-rated funds in Sept '09 to 368 top-rated funds in Sep '10. There is no resistance remaining, making higher prices more likely for this high-ranked leader. However, its recent price/volume action is termed "wedging" as it has crept to new highs without great volume conviction. It has not formed a sound base pattern recently, and disciplined investors know that it is usually best to avoid chasing stocks that are extended from a sound base. Patience may allow for it to form a proper base.
Recent quarterly comparisons (C criteria) showed accelerating sales revenues and strong earnings increases, but a down turn in its FY '09 earnings has been noted as a concern with respect to its annual earnings (A criteria) history. Long ago, this stock was featured on Thursday, March 30th, 2006 in the CANSLIM.net Mid Day Breakouts Report (read here). In May 2006, weak action resulted in it being dropped from the Featured Stocks list.
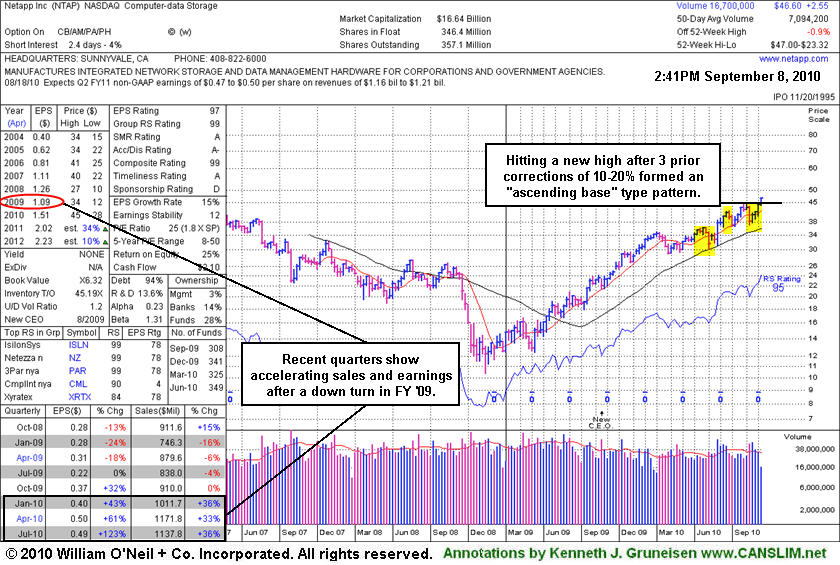
Gains For New Highs Today Backed By Nearly Twice Average Volume - Wednesday, September 08, 2010
Network Appliance Inc. (NTAP +$1.65 or +3.68% to $46.43) hit a new 52-week high today and closed strong, rising from an "ascending base" type pattern with volume nearly 2 times average, triggering a technical buy signal. It was featured in the mid-day report (read here) in yellow with pivot point based on its 52-week high plus ten cents. The yellow highlighted areas in the annotated graph show 3 prior corrections of 10-20%, forming a series of "higher highs and higher lows" typical of an ascending base type pattern. Having cleared all overhead supply, there is no resistance remaining, making higher prices more likely for this high-ranked leader.
Recent quarterly comparisons (C criteria) showed accelerating sales revenues and strong earnings increases, but a down turn in its FY '09 earnings has been noted as a concern with respect to its annual earnings (A criteria) history. Long ago, this stock was featured on Thursday, March 30th, 2006 in the CANSLIM.net Mid Day Breakouts Report (read here). In May 2006, weak action resulted in it being dropped from the Featured Stocks list. Increasing institutional ownership (I criteria) is a very reassuring sign, having climbed from 308 top-rated funds in Sept '09 to 349 top-rated funds in Jun '10.
Leader Tests Important 50 DMA Support - Wednesday, May 03, 2006
An upward trendline, by definition, develops as a stock steadily appreciates over an extended period of time. During that period, the stock vacillates between the lower and upper boundaries of trendlines which can be drawn by connecting a series of recent highs or lows. In order to ensure the overall health of the stock, the lower boundary should not be violated. Technically, if the lower boundary is violated, this signals that the trend is deteriorating and bears are gaining control, making the odds start to favor the possibility of further downside testing. It is also important to note the 50-day moving average (DMA) line, a reliable technical tool that savvy investors have learned to incorporate in their technical analysis. The 50 DMA line plays a pivotal role relative to a stock's price. If the price of a stock is above its 50 DMA, then odds are that its 50 DMA will act as formidable support. Conversely, if the price is below its 50 DMA, then the moving average commonly acts as resistance barrier.
Network Appliance Inc. (NTAP +$0.23 or +0.64% to $35.97) has not posted a gain on above average volume in about a month. Technically of some concern is that its upward trend line (drawn in green) appears to have been violated with heavier volume in the two prior down sessions. It found support at its 50-day moving average (DMA) line today and reversed from its session lows to close with a small gain on lighter volume. This stock was featured on Thursday, March 30th, 2006 in the CANSLIM.net Mid Day Breakouts Report (read here). NTAP has been steadily advancing for the past 8 months, and for the most part, this issue has remained above its 50 DMA (with one brief violation in December which was quickly repaired). As long as this issue remains above its 50 DMA, odds favor higher prices will follow; however a violation on heavy volume would prompt greater concern. Prior resistance in the $34 range (the stock's 2004-5 highs) however is another place where firm support may be expected. Deterioration beyond that extreme would be a definitive sell signal. Meanwhile, provided its fundamentals remain strong in the upcoming financial report, higher prices appear likely for this high-ranked leader.
C A N S L I M | StockTalk | News | Chart | ![]() DGO | SEC | Zacks Reports
DGO | SEC | Zacks Reports

View all notes | Alert me of new notes | CANSLIM.net Company Profile