Relative Strength Rating Slumped Under 80+ Minimum - Wednesday, March 27, 2013
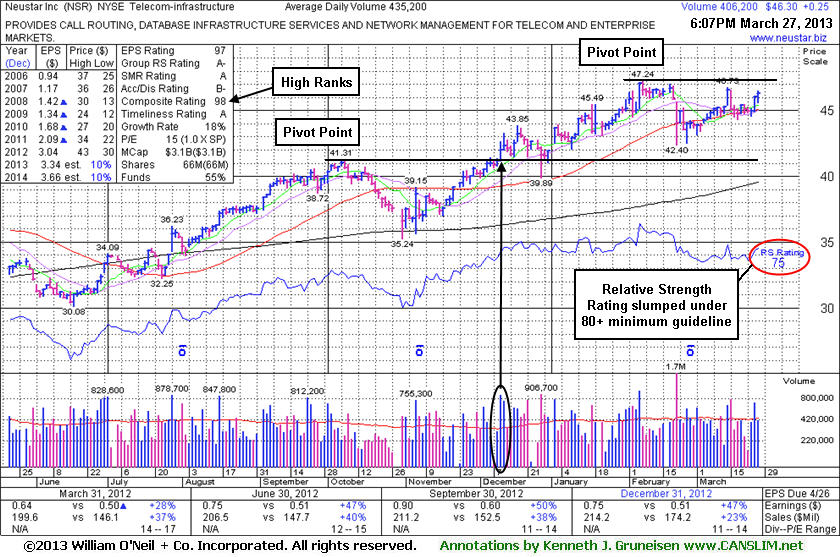
Neustar Inc (NSR +$0.25 or +0.54% to $46.30) found support in recent weeks near its 50-day moving average (DMA) line - a textbook support level for chart readers. A new pivot point was noted on 3/08/13 based on its 2/27/13 high plus 10 cents while forming a "square box" base while it was noted - "Volume-driven gains above the pivot point may trigger a new (or add-on) technical buy signal." Since that time it has not triggered a new (or add-on) technical buy signal, however it tallied some gains backed by above average volume which were encouraging signs it was finding recent institutional support. Meanwhile, its Relative Strength Rating has slumped to 75 (see red circle), under the 80+ minimum guideline for buy candidates, raising some concerns.
The 2/21/13 low ($42.40) defines near-term support below its 50 DMA line, where any subsequent deterioration would raise greater concerns and trigger worrisome technical sell signals. It was last shown in this FSU section on 2/27/13 with an annotated graph under the headline, "Finding Support Near 50-Day Average After Recent Damaging Loss." Leadership from other high-ranked leaders in the Telecom - Infrastructure group is still a reassuring sign (concerning the L criteria). However, NSR only traded up as much as +12.9% since highlighted in yellow at $41.85 in the 12/11/12 mid-day report (read here) as it rose from a 10-week base. Quarterly comparisons through Dec '12 showed 4 consecutive increases of more than the +25% minimum earnings guideline (C criteria). The number of top-rated funds owning its shares rose from 400 in Mar '12 to 414 in Dec '12, a slightly reassuring trend concerning the I criteria. Its Return On Equity is reported at 36%, well above the 17% minimum guideline. Its small supply of 66 million shares (S criteria) outstanding can lead to greater price volatility if the institutional crowd rushes to accumulate shares, or if they decide to leave.
Finding Support Near 50-Day Average After Recent Damaging Loss - Wednesday, February 27, 2013
Neustar Inc (NSR +$0.05 or +0.11% to $44.06) is hovering near its 50-day moving average (DMA) line. It has been holding its ground near that important short-term average line since a damaging loss on 2/21/13 with heavy volume raised concerns and triggered a technical sell signal. More damaging losses below the recent lows would raise greater concerns and could lead to testing near its prior highs in the $41 area which define the next important support level.It was last shown in this FSU section on 2/01/13 with an annotated graph under the headline, "Getting Extended After Volume-Driven Gains To New Highs". While rallying with above average volume behind its gains while we then cautioned members - "Disciplined investors know to avoid chasing extended stocks more than +5% above their pivot point, and they always sell if ever any stock falls more than -7% from their purchase price to properly manage risk under the fact-based system's guidelines."
Leadership from other high-ranked leaders in the Telecom - Infrastructure group is still a reassuring sign (concerning the L criteria). It has traded up as much as +12.9%since highlighted in yellow in the 12/11/12 mid-day report (read here) as it rose from a 10-week base. Quarterly comparisons through Dec '12 showed 4 consecutive increases of more than the +25% minimum earnings guideline (C criteria). The number of top-rated funds owning its shares rose from 400 in Mar '12 to 414 in Dec '12, a slightly reassuring trend concerning the I criteria. Its Return On Equity is reported at 29%, well above the 17% minimum guideline. Its small supply of 66 million shares (S criteria) outstanding can lead to greater price volatility if the institutional crowd rushes to accumulate shares, or if they decide to leave.

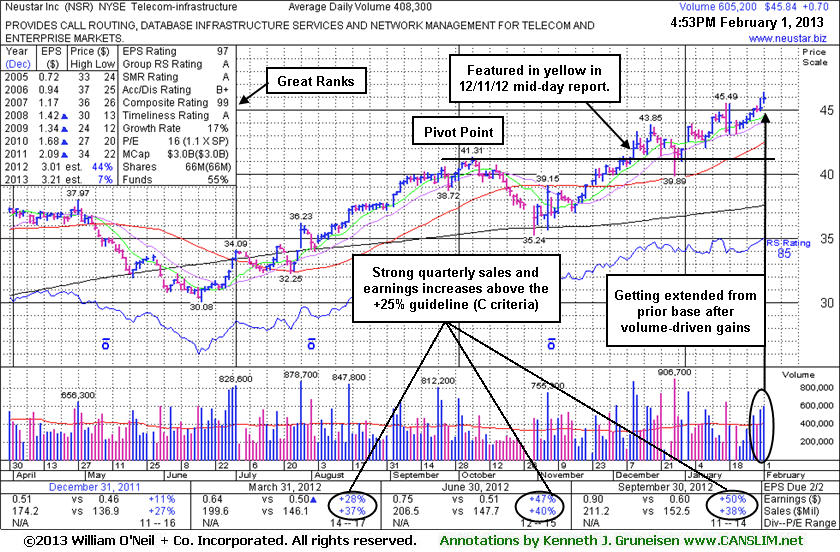
Getting Extended After Volume-Driven Gains To New Highs - Friday, February 01, 2013
Neustar Inc (NSR +$0.70 or +1.55% to $45.84) hit another new 52-week high today, getting more extended from its prior base while rallying with above average volume behind its latest gains. Disciplined investors know to avoid chasing extended stocks more than +5% above their pivot point, and they always sell if ever any stock falls more than -7% from their purchase price to properly manage risk under the fact-based system's guidelines. Its 50-day moving average (DMA) line defines near-term support.
Leadership from other high-ranked leaders in the Telecom - Infrastructure group is a reassuring sign (concerning the L criteria). Its Group Relative Strength Rating has improved to an 88 rating. It was highlighted in yellow in the 12/11/12 mid-day report (read here) as that day's gain on heavy volume +172% above average clinched a technical buy signal. It rose from a 10-week base during which it found support at its 200-day moving average (DMA) line. Prior highs and its 50-day moving average (DMA) line acted as support when consolidating after its technical breakout while investors may have accumulated shares before rallying further into new high territory. It was last shown in this FSU section on 1/16/13 with an annotated graph under the headline, "Extended From Base After Prior Highs Acted as Support".
Quarterly comparisons through Sep '12 showed 3 consecutive increases of more than the +25% minimum earnings guideline (C criteria). The number of top-rated funds owning its shares rose from 400 in Mar '12 to 409 in Dec '12, a slightly reassuring trend concerning the I criteria. Its Return On Equity is reported at 29%, well above the 17% minimum guideline. Its small supply of 66 million shares (S criteria) outstanding can lead to greater price volatility if the institutional crowd rushes to accumulate shares, or if they decide to leave.
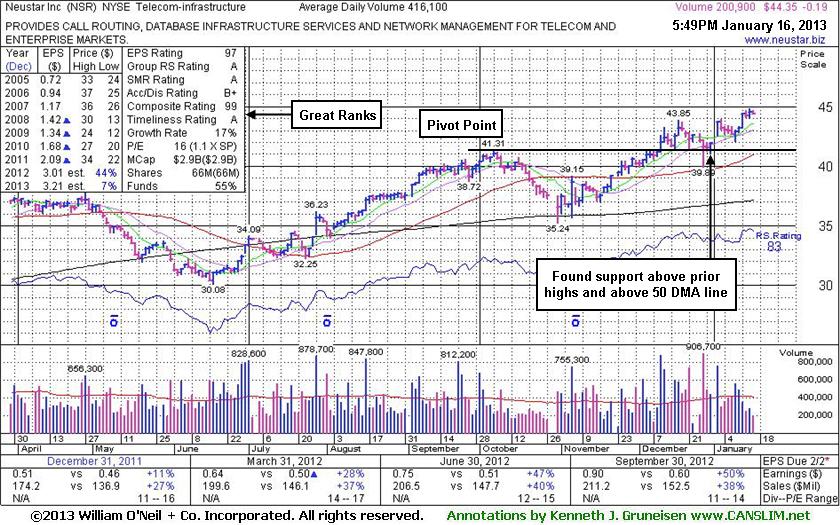
Extended From Base After Prior Highs Acted as Support - Wednesday, January 16, 2013
Neustar Inc (NSR -$0.19 or -0.43% to $44.35) is perched at its 52-week high today, extended from its prior base. Prior highs and its 50-day moving average (DMA) line coincide near $41 defining chart support to watch on pullbacks. Leadership from other high-ranked leaders in the Telecom - Infrastructure group is a reassuring sign (concerning the L criteria). Its Group Relative Strength Rating has improved to a 86 from a 79 rating since since it was last shown in this FSU section on 1/02/13 with an annotated graph under the headline, "Held Ground Following Prior Breakout; Getting Extended Now", as it rallied above its "max buy" level with a volume-driven gain.Disciplined investors know to avoid chasing extended stocks more than +5% above their pivot point, and they always sell if ever any stock falls more than -7% from their purchase price to properly manage risk under the fact-based system's guidelines. Its 12/11/12 gain on heavy volume +172% above average clinched a technical buy signal. It rose from a 10-week base during which it found support at its 200-day moving average (DMA) line. Prior highs and its 50 DMA line acted as support while investors may have accumulated shares before rallying further into new high territory.
Quarterly comparisons through Sep '12 showed 3 consecutive increases of more than the +25% minimum earnings guideline (C criteria). The number of top-rated funds owning its shares rose from 400 in Mar '12 to 408 in Dec '12, a slightly reassuring trend concerning the I criteria. Its Return On Equity is reported at 29%, well above the 17% minimum guideline. Its small supply of 66 million shares (S criteria) outstanding can lead to greater price volatility if the institutional crowd rushes to accumulate shares, or if they decide to leave.
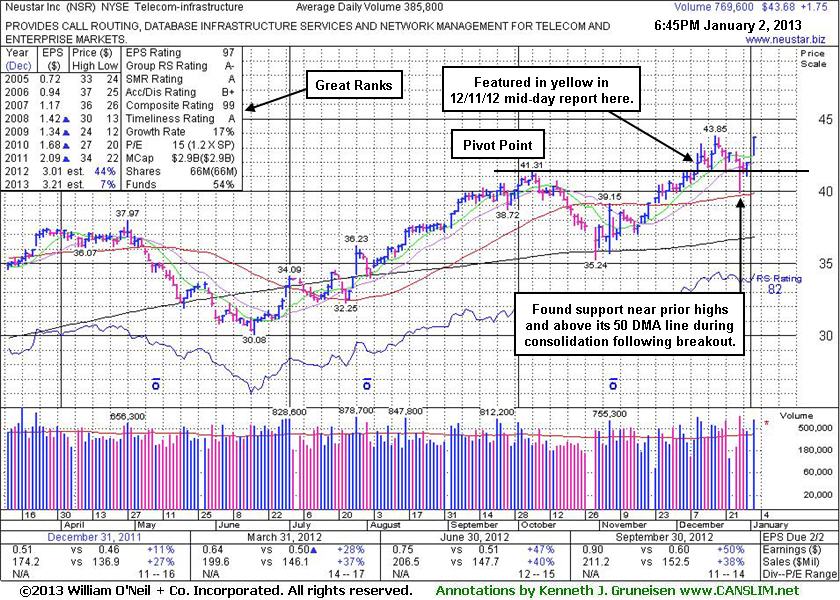
Held Ground Following Prior Breakout; Getting Extended Now - Wednesday, January 02, 2013
Neustar Inc (NSR +$1.75 or +4.17% to $43.68) gapped up today and rallied above its "max buy" level with a volume-driven gain and its color code was changed to green. Subsequent deterioration below its old high close ($41.05 on 10/05/12) could negate its recent breakout, a worrisome sign. Disciplined investors know to avoid chasing extended stocks more than +5% above their pivot point, and they always sell if ever any stock falls more than -7% from their purchase price to properly manage risk under the fact-based system's guidelines.Leadership from a couple of other high-ranked leaders in the Telecom - Infrastructure group is a reassuring sign (concerning the L criteria) and its Group Relative Strength Rating has improved to a 79 from a 61 rating since last shown in this FSU section on 12/11/12 with an annotated graph under the headline, "Featured in Mid-day Report and Finished With Strong Gain Above Pivot Point". Its 12/11/12 gain on heavy volume +172% above average clinched a technical buy signal. It rose from a 10-week base during which it found support at its 200-day moving average (DMA) line. Quarterly comparisons through Sep '12 showed 3 consecutive increases of more than the +25% minimum earnings guideline (C criteria).
The number of top-rated funds owning its shares rose from 404 in Dec '11 to 421 in Sep '12, a slightly reassuring trend concerning the I criteria. Its Return On Equity is reported at 29%, well above the 17% minimum guideline. Its small supply of 66 million shares (S criteria) outstanding can lead to greater price volatility if the institutional crowd rushes to accumulate shares, or if they decide to leave.
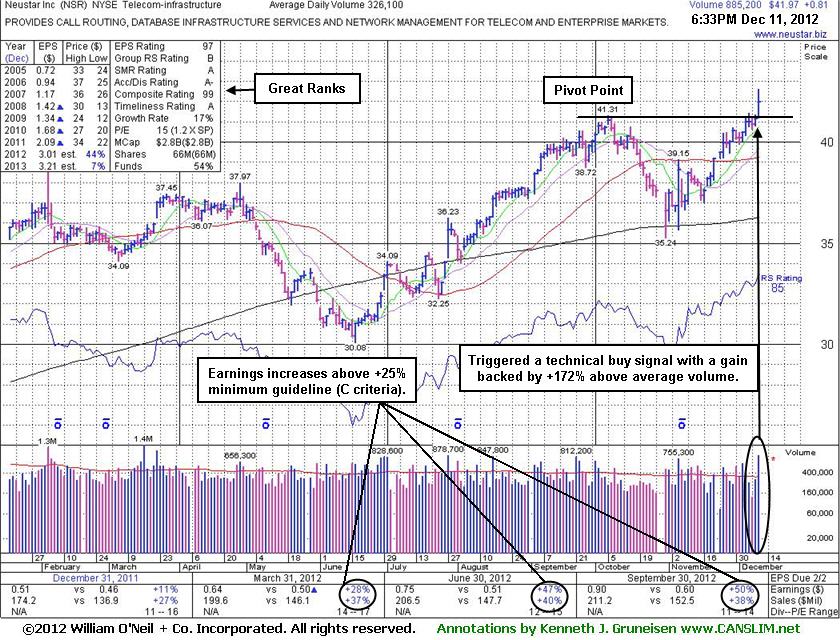
Featured in Mid-day Report and Finished With Strong Gain Above Pivot Point - Tuesday, December 11, 2012
Often, when a leading stock is setting up to breakout of a solid base it is highlighted in CANSLIM.net's Mid-Day Breakouts Report. Sometimes stocks are highlighted shortly after a technical breakout, yet while the potential buy candidate may still be considered action-worthy. The most relevant factors are noted in the report which alerts prudent CANSLIM oriented investors to place the issue in their watch list. After doing any necessary backup research, the investor is prepared to act after the stock triggers a technical buy signal (breaks above its pivot point on more than +50% average turnover) but before it gets too extended from a sound base. In the event the stock fails to trigger a technical buy signal and its price declines then it will simply be removed from the watch list. Disciplined investors know to buy as near as possible to the pivot point and avoid chasing stocks after they have rallied more than +5% above their pivot point. It is crucial to always limit losses whenever any stock heads the wrong direction, and disciplined investors sell if a struggling stock ever falls more than -7% from their purchase price.
Neustar Inc (NSR +$0.69 or +1.68% to $41.85) was highlighted in yellow with pivot point cited based on its 10/05/12 high plus 10 cents in the earlier mid-day report (read here) and its strong finish on heavy volume +172% above average clinched a technical buy signal. It hit a new 52-week high today, rising from a 10-week base during which it found support at its 200-day moving average (DMA) line. Quarterly comparisons through Sep '12 showed 3 consecutive increases of more than the +25% minimum earnings guideline (C criteria).
The number of top-rated funds owning its shares rose from 404 in Dec '11 to 422 in Sep '12, a slightly reassuring trend concerning the I criteria. Its Return On Equity is reported at 29%, well above the 17% minimum guideline. Leadership from a couple of other high-ranked leaders in the Telecom - Infrastructure group is a reassuring sign (concerning the L criteria) although its Group Relative Strength Rating of 61 is mediocre. Its small supply of 65 million shares (S criteria) outstanding can lead to greater price volatility if the institutional crowd rushes to accumulate shares, or if they decide to leave.
Disciplined investors know to avoid chasing extended stocks more than +5% above their pivot point, and they always sell if ever any stock falls more than -7% from their purchase price to properly manage risk under the fact-based system's guidelines.