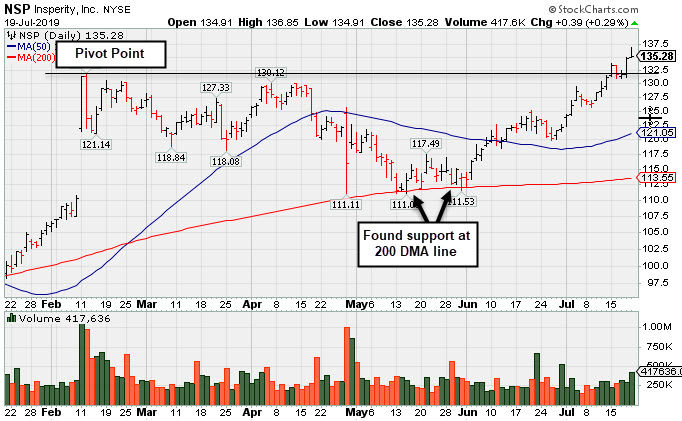
Insperity Hit New High With +55% Above Average Volume - Friday, July 19, 2019
Insperity Inc (NSP +$0.39 or +0.29% to $135.28) was highlighted in yellow with pivot point cited based on its 2/12/19 high plus 10 cents in the earlier mid-day report (read here). Today's gain above its pivot point was backed by +55% above average volume to clinch a technical buy signal, however it ended near the session low. It has recently been wedging from a 5-month base during which if found support at its 200-day moving average (DMA) line.
It showed resilience since dropped from the Featured Stocks list on 5/13/19 after last shown in this FSU section on 4/23/19 with an annotated graph under the headline, "Rebound Above 50-Day Moving Average Line Needed". The high-ranked Commercial Services - Outsourcing firm reported earnings +40% on +14% sales revenues for the Mar '19 quarter. The past 8 quarterly earnings increases were above the +25% minimum guideline (C criteria). Its Timeliness Rating is A and its Sponsorship Rating is C. Annual earnings (A criteria) history has improved after a downturn in FY '13.
Shares split 2:1 effective 12/19/17. The number of top-rated funds owning its shares rose from 319 in Mar '16 to 629 in Mar '19, a reassuring sign concerning the I criteria. Its small supply of only 38.4 million shares in the public float (S criteria) can contribute to greater price volatility in the event of institutional buying or selling.
Charts used courtesy of www.stockcharts.com
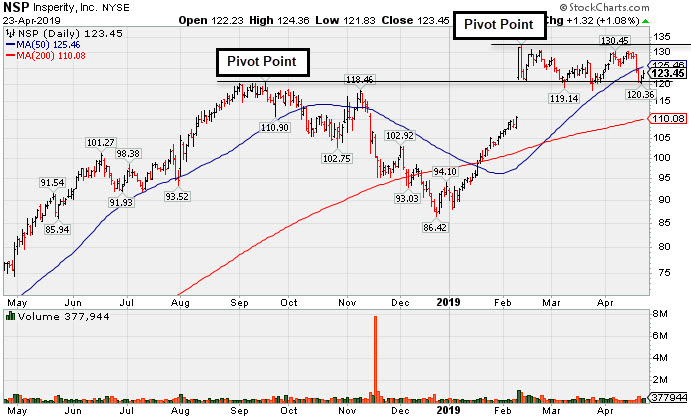
Rebound Above 50-Day Moving Average Line Needed - Tuesday, April 23, 2019
Insperity Inc (NSP +$1.32 or +1.08% to $123.45) violated its 50-day moving average (DMA) line ($125.59) on 4/18/19 and triggered a technical sell signal with higher volume behind a 5th consecutive loss. A rebound above the 50 DMA line is needed for its outlook to improve.
A new pivot point was cited based on its 2/12/19 high plus 10 cents. Subsequent gains above the pivot point backed by at least +40% above average volume may trigger a new (or add-on) technical buy signal. Prior highs in the $118-121 area recently acted as support.
A new pivot point was cited based on its 2/12/19 high plus 10 cents. Subsequent gains above the pivot point backed by at least +40% above average volume may trigger a new (or add-on) technical buy signal. Prior highs in the $118-121 area recently acted as support.
Keep in mind it is due to report earnings news before the open on Monday, April 29, 2019. Volume and volatility often increase near earnings news. NSP was last shown in this FSU section on 3/14/19 with an annotated graph under the headline, "Volume Totals Cooling and Consolidating Near Prior Highs". It was highlighted in yellow with new pivot point cited based on its 9/11/18 high plus 10 cents in the 2/11/19 mid-day report (read here).
The high-ranked Commercial Services - Outsourcing firm reported earnings +25% on +17% sales revenues for the Dec '18 quarter. The past 7 quarterly earnings increases were above the +25% minimum guideline (C criteria). Its Timeliness Rating is B and its Sponsorship Rating is B. Annual earnings (A criteria) history has improved after a downturn in FY '13.
Shares split 2:1 effective 12/19/17. The number of top-rated funds owning its shares rose from 319 in Mar '16 to 643 in Mar '19, a reassuring sign concerning the I criteria. Its small supply of only 38.4 million shares in the public float (S criteria) can contribute to greater price volatility in the event of institutional buying or selling.
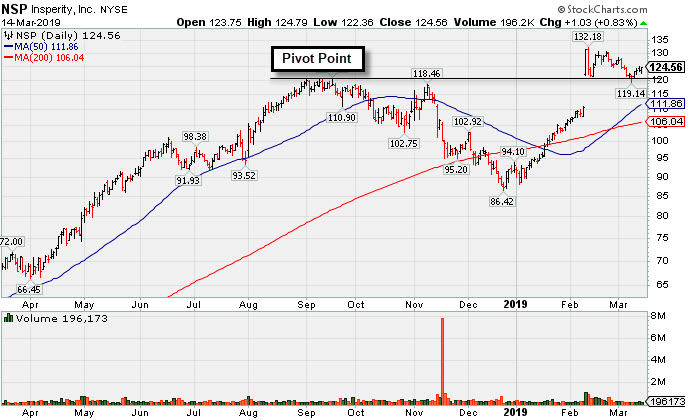
Volume Totals Cooling and Consolidating Near Prior Highs - Thursday, March 14, 2019
Insperity Inc (NSP +$1.03 or +0.83% to $124.56) has seen volume totals cooling while quietly consolidating below its "max buy" level. Prior highs in the $119-121 area define important near-term support to watch on pullbacks. It stalled after last shown in this FSU section on 2/11/19 with an annotated graph under the headline, "Big Breakaway Gap Triggered Technical Buy Signal". It was highlighted in yellow with new pivot point cited based on its 9/11/18 high plus 10 cents in the earlier mid-day report (read here).
The high-ranked Commercial Services - Outsourcing firm reported earnings +25% on +17% sales revenues for the Dec '18 quarter. The past 7 quarterly earnings increases were above the +25% minimum guideline (C criteria). Its Timeliness Rating is A and its Sponsorship Rating is B.Annual earnings (A criteria) history has improved after a downturn in FY '13.
Shares split 2:1 effective 12/19/17. The number of top-rated funds owning its shares rose from 319 in Mar '16 to 635 in Dec '18, a reassuring sign concerning the I criteria. Its small supply of only 37.6 million shares in the public float (S criteria) can contribute to greater price volatility in the event of institutional buying or selling.
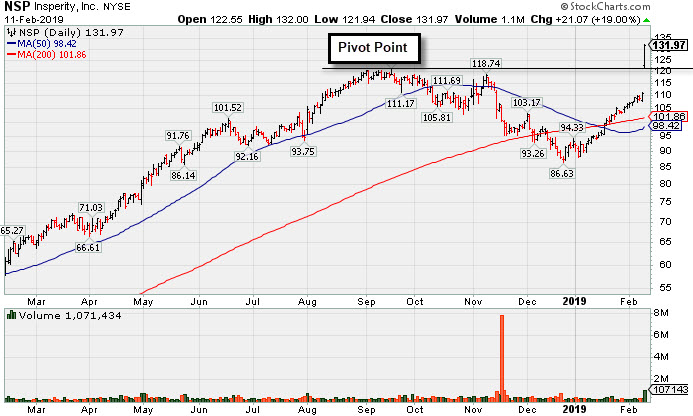
Big Breakaway Gap Triggered Technical Buy Signal - Monday, February 11, 2019
Insperity Inc (NSP +$21.07 or +19.00% to $131.97) was highlighted in yellow with new pivot point cited based on its 9/11/18 high plus 10 cents in the earlier mid-day report (read here). It hit a new all-time high with today's big "breakaway gap" triggering a technical buy signal.
The high-ranked Commercial Services - Outsourcing firm reported earnings +25% on +17% sales revenues for the Dec '18 quarter. The past 7 quarterly earnings increases were above the +25% minimum guideline (C criteria). Its Timeliness Rating is A and its Sponsorship Rating is B. Annual earnings (A criteria) history has improved after a downturn in FY '13.
Shares split 2:1 effective 12/19/17. The number of top-rated funds owning its shares rose from 319 in Mar '16 to 634 in Dec '18, a reassuring sign concerning the I criteria. Its small supply of only 37.6 million shares in the public float (S criteria) can contribute to greater price volatility in the event of institutional buying or selling.
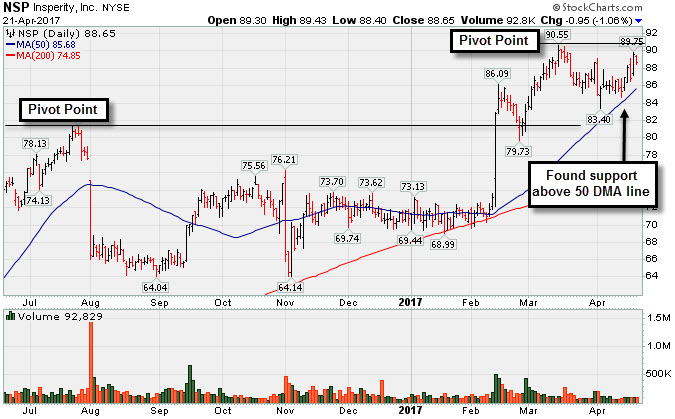
New Base Formed Above 50-Day Moving Average Line - Friday, April 21, 2017
Insperity Inc (NSP -$0.95 or -1.06% to $88.65) has been quietly consolidating above its 50-day moving average (DMA) line. It is perched within close striking distance of its all-time high. Its color code was changed to yellow with a new pivot point cited based on its 3/15/17 high plus 10 cents. Subsequent volume-driven gains for new highs may trigger a new (or add-on) technical buy signal. Old highs the $82 area define the next important support level to watch below its 50 DMA line. Subsequent losses leading to violations would trigger technical sell signals.
Its Timeliness Rating is A and its Sponsorship Rating is B. The high-ranked Commercial Services - Outsourcing firm was highlighted in the 2/14/17 mid-day report (read here) with a pivot point cited based on its 7/26/16 high plus 10 cents. A considerable volume-driven gain on 2/13/17 had triggered a technical buy signal. It was last shown in this FSU section on 3/22/17 with an annotated graph under the headline, "Ordinary Pullback From Highs With Lighter Volume".
It has tallied 4 consecutive strong earnings increases above the +25% minimum guideline (C criteria). It reported earnings +76% on +12% sales revenues for the Dec '16 quarter. Annual earnings (A criteria) history has improved after a downturn in FY '13.
The number of top-rated funds owning its shares rose from 319 in Mar '16 to 408 in Mar '17, a reassuring sign concerning the I criteria. Its small supply of only 15.1 million shares in the public float (S criteria) can contribute to greater price volatility in the event of institutional buying or selling.
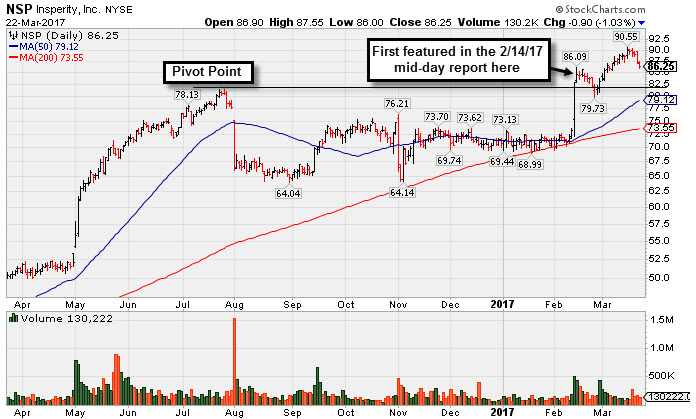
Ordinary Pullback From Highs With Lighter Volume - Wednesday, March 22, 2017
Insperity Inc (NSP -$0.90 or -1.03% to $86.25) quietly pulled back below its "max buy" level with lighter than average volume behind today's 5th consecutive loss. Its color code was changed to yellow. Prior highs in the $86 area and old highs the $82 area define initial support levels to watch above its 50-day moving average (DMA) line ($79.28).
Its Timeliness Rating improved from C to A and its Sponsorship Rating improved from C to B since the high-ranked Commercial Services - Outsourcing firm was last shown in this FSU section on 2/14/17 with an annotated graph under the headline, "Big Volume-Driven Gains Indicative of Institutional Demand". It was highlighted in the earlier mid-day report (read here) with a pivot point cited based on its 7/26/16 high plus 10 cents. A considerable volume-driven gain on 2/13/17 had triggered a technical buy signal.
It has tallied 4 consecutive strong earnings increases above the +25% minimum guideline (C criteria). It reported earnings +76% on +12% sales revenues for the Dec '16 quarter. Annual earnings (A criteria) history has improved after a downturn in FY '13.
The number of top-rated funds owning its shares rose from 319 in Mar '16 to 399 in Dec '16, a reassuring sign concerning the I criteria. Its small supply of only 15.1 million shares in the public float (S criteria) can contribute to greater price volatility in the event of institutional buying or selling.
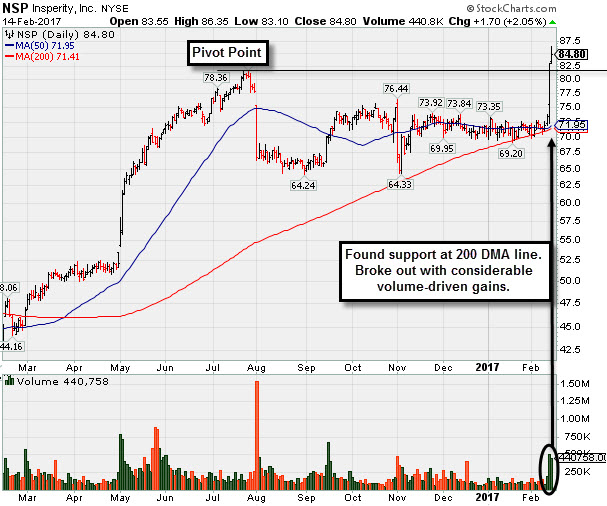
Big Volume-Driven Gains Indicative of Institutional Demand - Tuesday, February 14, 2017
Insperity Inc (NSP +$1.70 or +2.05% to $84.80) was highlighted in yellow in the earlier mid-day report (read here) with a pivot point cited based on its 7/26/16 high plus 10 cents. It spiked to new all-time highs today after a considerable volume-driven gain on the prior session triggering a technical buy signal.
The high-ranked Commercial Services - outsourcing firm has tallied 4 consecutive strong earnings increases above the +25% minimum guideline (C criteria). It reported earnings +76% on +12% sales revenues for the Dec '16 quarter. Annual earnings (A criteria) history has improved after a downturn in FY '13.
It has earned a Timeliness Rating of C and a Sponsorship Rating of C. The number of top-rated funds owning its shares rose from 319 in Mar '16 to 388 in Dec '16, a reassuring sign concerning the I criteria. Its small supply of only 21.3 million shares outstanding (S criteria) can contribute to greater price volatility in the event of institutional buying or selling.