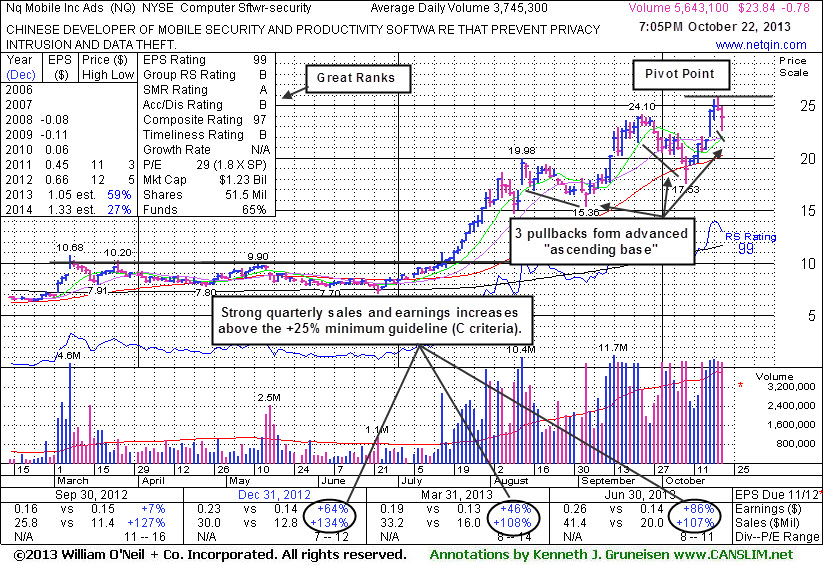
Nq Mobile Inc Ads (NQ -$0.78 or -3.17% to $23.84) was highlighted in yellow in the earlier mid-day-report (read here) while its latest pullback gives it the look of an advanced "ascending base" pattern. That kind of advanced base pattern is marked by 3 pullbacks of 10-20% following an earlier technical breakout which produced considerable gains. Choppy action when the broader market (M criteria) encountered pressure contributed to the latest pullback, and technically that led to greater than -20% pullbacks, however it showed great resilience and did not spend much time consolidating before rallying again with heavy volume.
It endured distributional pressure yet found great support near its 50-day moving average line, a level where the institutional crowd often accumulates more shares when they believe a company's outlook remains favorable. Subsequent volume-driven gains above its pivot point cited may trigger a technical buy signal from this "advanced" type of base pattern. It ended the session in the middle of its intra-day range after pulling back further today following a "negative reversal" at its 52-week high on the prior session. A rally above the latest high could signal a move that produces more climactic gains. As always, disciplined investors sell any stock that falls more than -7% from their purchase price, and that discipline is more important when dealing with advanced bases.
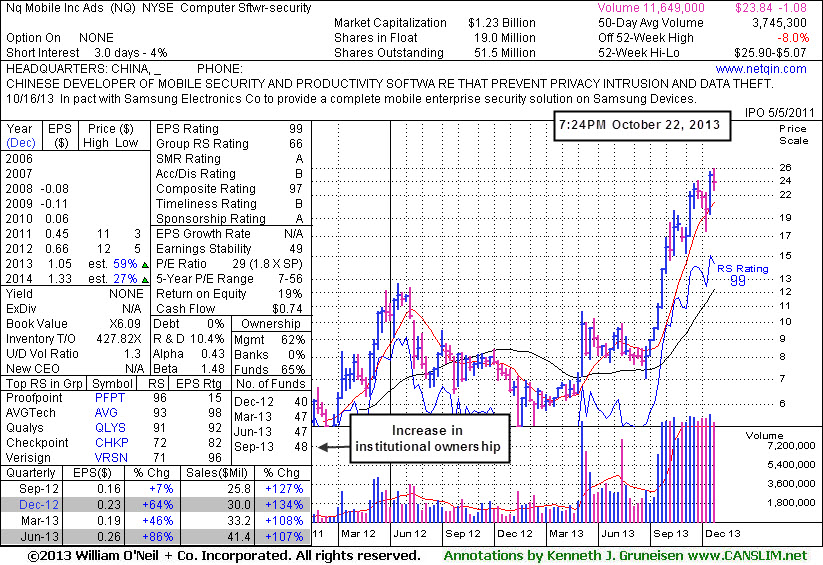
Quarterly sales and earnings comparisons have shown great increases percentage-wise in the 3 most recent quarterly comparisons through Jun '13 satisfying the C criteria. Annual earnings (A criteria) history for this Chinese Computer Software - Security firm has also been strong even though it got off to a poor start from its 5/05/11 IPO priced at $12, then gradually made great progress.
The number of top-rated funds owning its shares rose from 40 in Dec '12 to 48 in Sep '13, a reassuring sign concerning the I criteria. Its current Up/Down Volume Ratio of 1.3 is also an unbiased indication its shares have been under accumulation in the past 50 days.