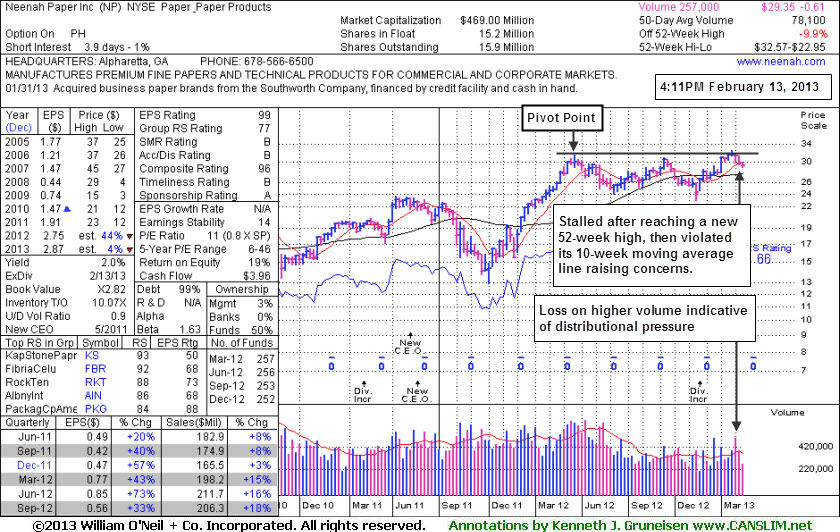
Slumping and Relative Strength Waning After Failed Breakout - Wednesday, February 13, 2013
Neenah Paper Inc (NP -$0.10 or -0.34% to $29.35) stalled after recently reaching a new 52-week high and then it slumped below its pivot point and traded below its 10-week moving average line defining important chart support, raising more concerns. Its Relative Strength rating has slumped to a 66, well below the 80+ minimum guideline for buy candidates under the fact-based investment system, and its color code was noted as it was changed to green due to the technical deterioration. It faces a little resistance due to the small amount of overhead supply up through the $32 area that may hinder its ability to rally, yet it remains perched only -9.9% off its 52-week high.
The "negative reversal" for a loss on heavy volume after hitting a new 52-week high on 1/25/13 was noted as a worrisome sign of distributional pressure as it failed to finish strong and did not clinch a technical buy signal. The stock's last appearance in this FSU section on 1/25/13 included an annotated daily graph under the headline, "Featured in Mid-day Report and Finished With Negative Reversal Below Pivot Point". It was the observed - "A negative reversal indicates that it encountered a rush of willing sellers when it was a good position to close the session above its pivot point. Disciplined investors might be watching for subsequent gains with great volume conviction while rising above its pivot point and into new high territory as proof of lurking institutional buying demand which might lead to a more meaningful and sustained advance."
The weekly chart below illustrates the distributional action of late, as opposed to showing signs of institutional accumulation. The number of top-rated funds reportedly owning its shares has not shown any favorable trend, in fact, falling from 257 in Mar '12 to 252 in Dec '12, is a discouraging sign concerning the I criteria. Without any signs of fresh and substantial buying demand there is little reason for investors to take action.
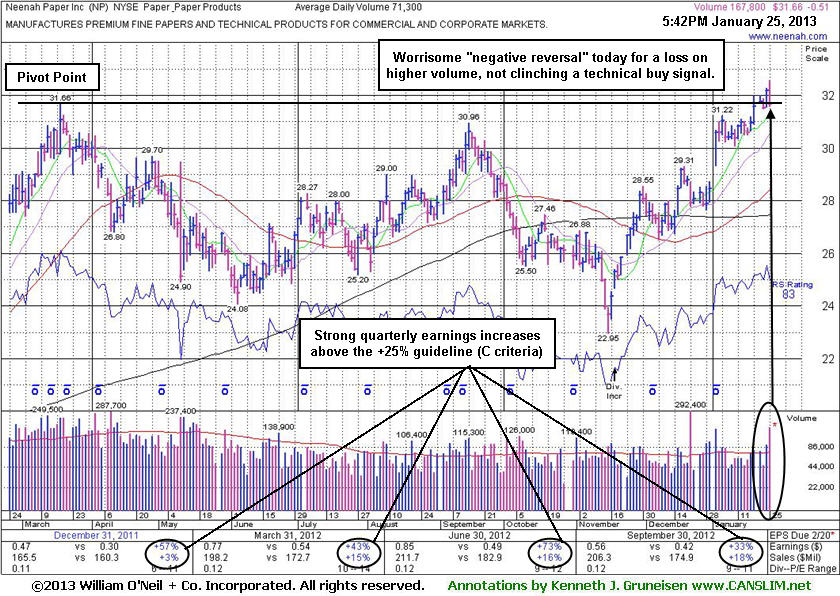
Featured in Mid-day Report and Finished With Negative Reversal Below Pivot Point - Friday, January 25, 2013
Often, when a leading stock is setting up to breakout of a solid base it is highlighted in CANSLIM.net's Mid-Day Breakouts Report. The most relevant factors are noted in the report which alerts prudent CANSLIM oriented investors to place the issue in their watch list. After doing any necessary backup research, the investor is prepared to act after the stock triggers a technical buy signal (breaks above its pivot point on more than +50% average turnover) but before it gets too extended from a sound base. In the event the stock fails to trigger a technical buy signal and its price declines then it will simply be removed from the watch list. Disciplined investors know to buy as near as possible to the pivot point and avoid chasing stocks after they have rallied more than +5% above their pivot point. It is crucial to always limit losses whenever any stock heads the wrong direction, and disciplined investors sell if a struggling stock ever falls more than -7% from their purchase price.
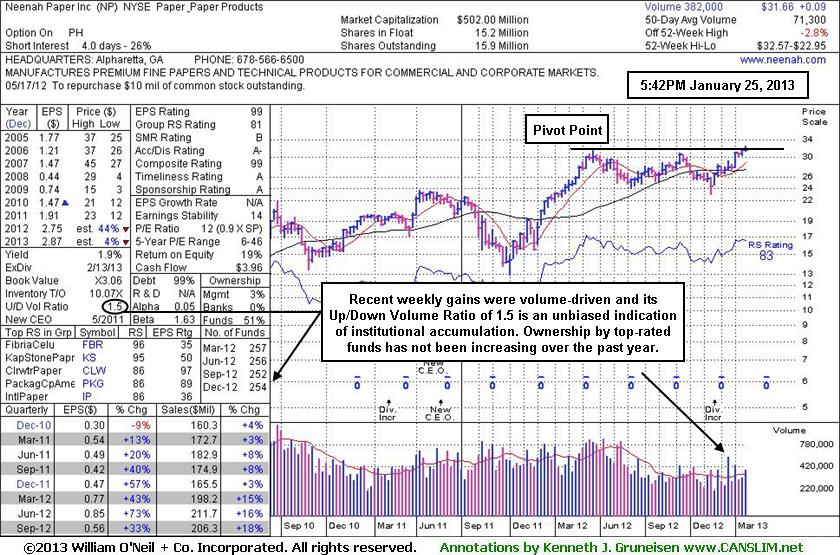
Neenah Paper Inc (NP -$0.51 or -1.59% to $31.66) finished near the session low with a loss on heavy volume after a worrisome "negative reversal" from early gains hitting a new 52-week high. The negative reversal was noted as is a worrisome sign of distributional pressure. It was highlighted in yellow with pivot point cited based on its 3/19/12 high plus 10 cents in the mid-day report (read here) while noted - "A strong close above its pivot point backed by at least +40% above average volume may clinch a technical buy signal. Recent gains lacked great volume conviction while wedging above previously stubborn resistance in the $31 area."
A negative reversal indicates that it encountered a rush of willing sellers when it was a good position to close the session above its pivot point. Disciplined investors might be watching for subsequent gains with great volume conviction while rising above its pivot point and into new high territory as proof of lurking institutional buying demand which might lead to a more meaningful and sustained advance.
The weekly graph (below) shows bullish price/volume action with recent weekly gains backed by higher volume. Its Up/Down Volume Ratio of 1.5 is an unbiased indication that its shares have been under accumulation over the past 50 days. However, the number of top-rated funds reportedly owning its shares has not shown any improvement in the past year. Quarterly earnings increases above the +25% guideline satisfy the C criteria and the sequential comparisons show encouraging accelerating sales revenues growth. Annual earnings (A criteria) have been improving steadily after a worrisome downturn in FY '08. Its small supply of 15.9 million shares (S criteria) could contribute to greater price volatility in the event of any institutional buying or selling.